Health Coverage and Care in the South in 2014 and Beyond
Profile of the Southern Population Today
As of 2012, 115 million individuals lived in the 17 southern states, accounting for over a third (37%) of US residents nationally (Figure 2). Over half (56%) of the southern population resides in just four states – Texas, Florida, Georgia, and North Carolina. These four most populous southern states also include more than a fifth (21%) of the total US population.1 The southern population is growing rapidly, largely due to high domestic and international migration to the South. The Census Bureau estimates that over half (52%) of the increase in the U.S. population by 2030 will be a result of population growth in the South.2
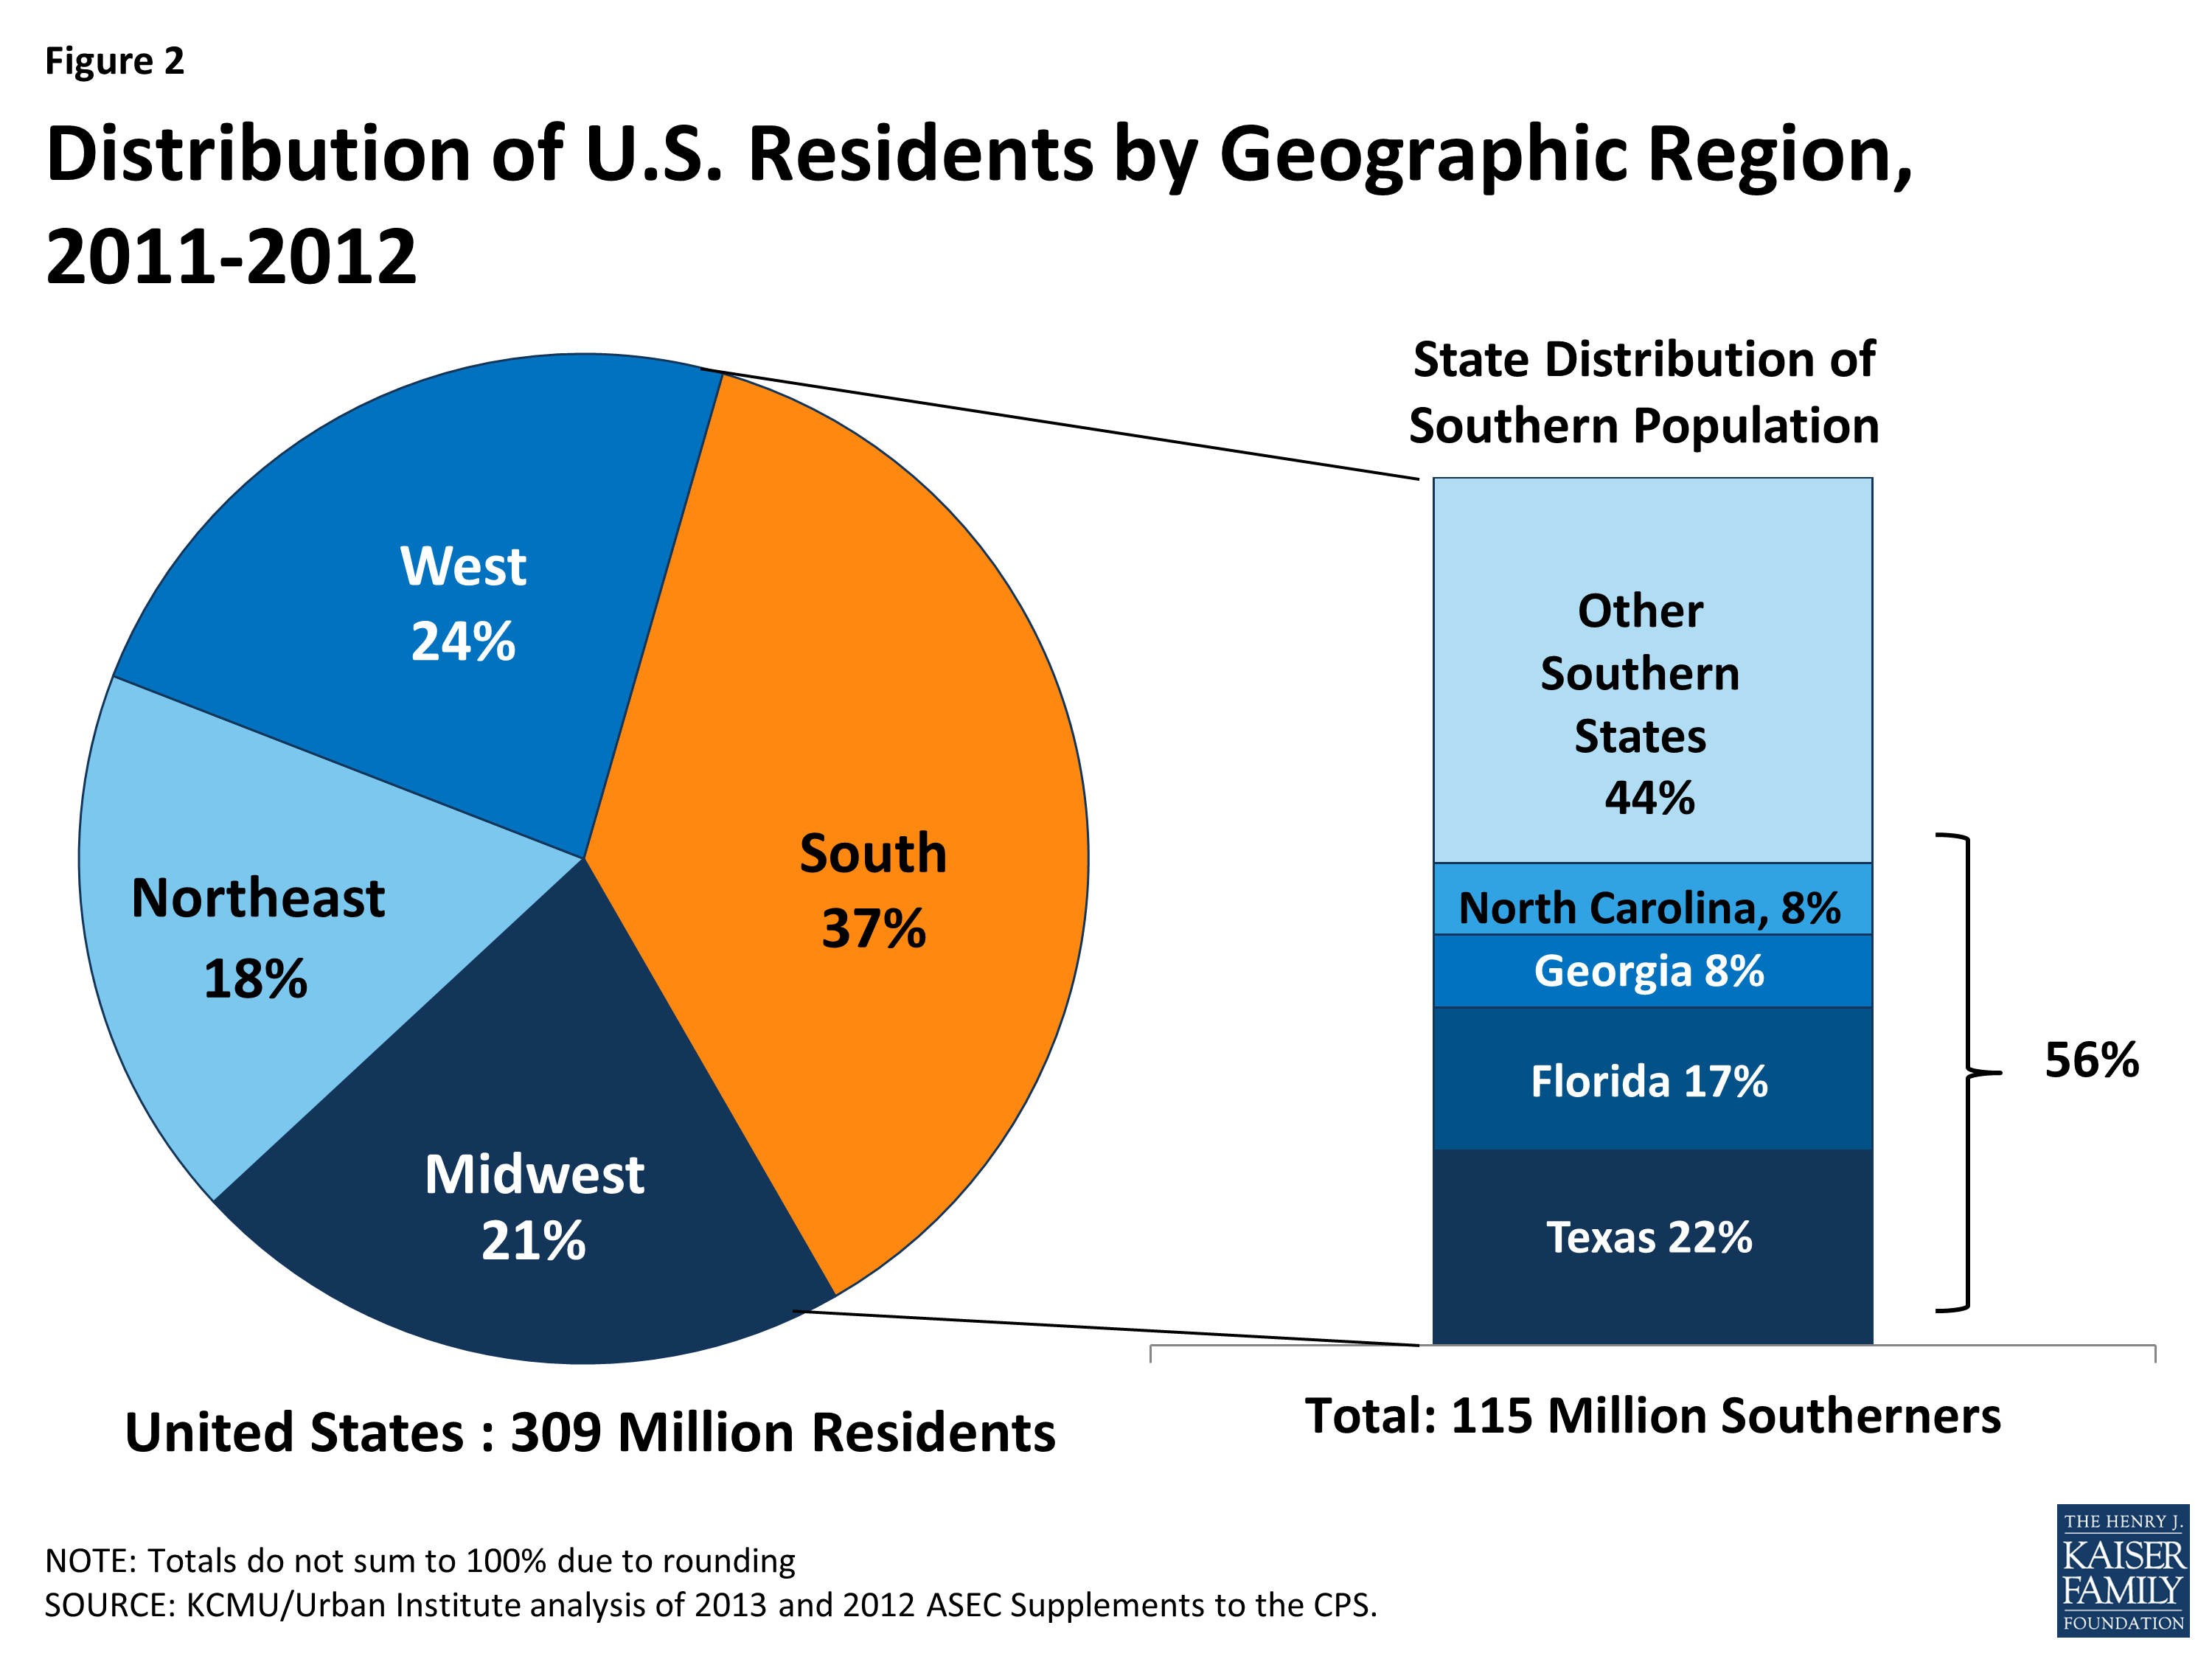
Figure 2: Distribution of U.S. Residents by Geographic Region, 2011-2012
The southern population is racially and ethnically diverse. People of color make up 41% of the total southern population (Figure 3). However, the share of the population who are people of color varies across southern states from less than 15% in Arkansas and West Virginia to over half of residents in the District of Columbia and Texas (see Appendix Table 1).
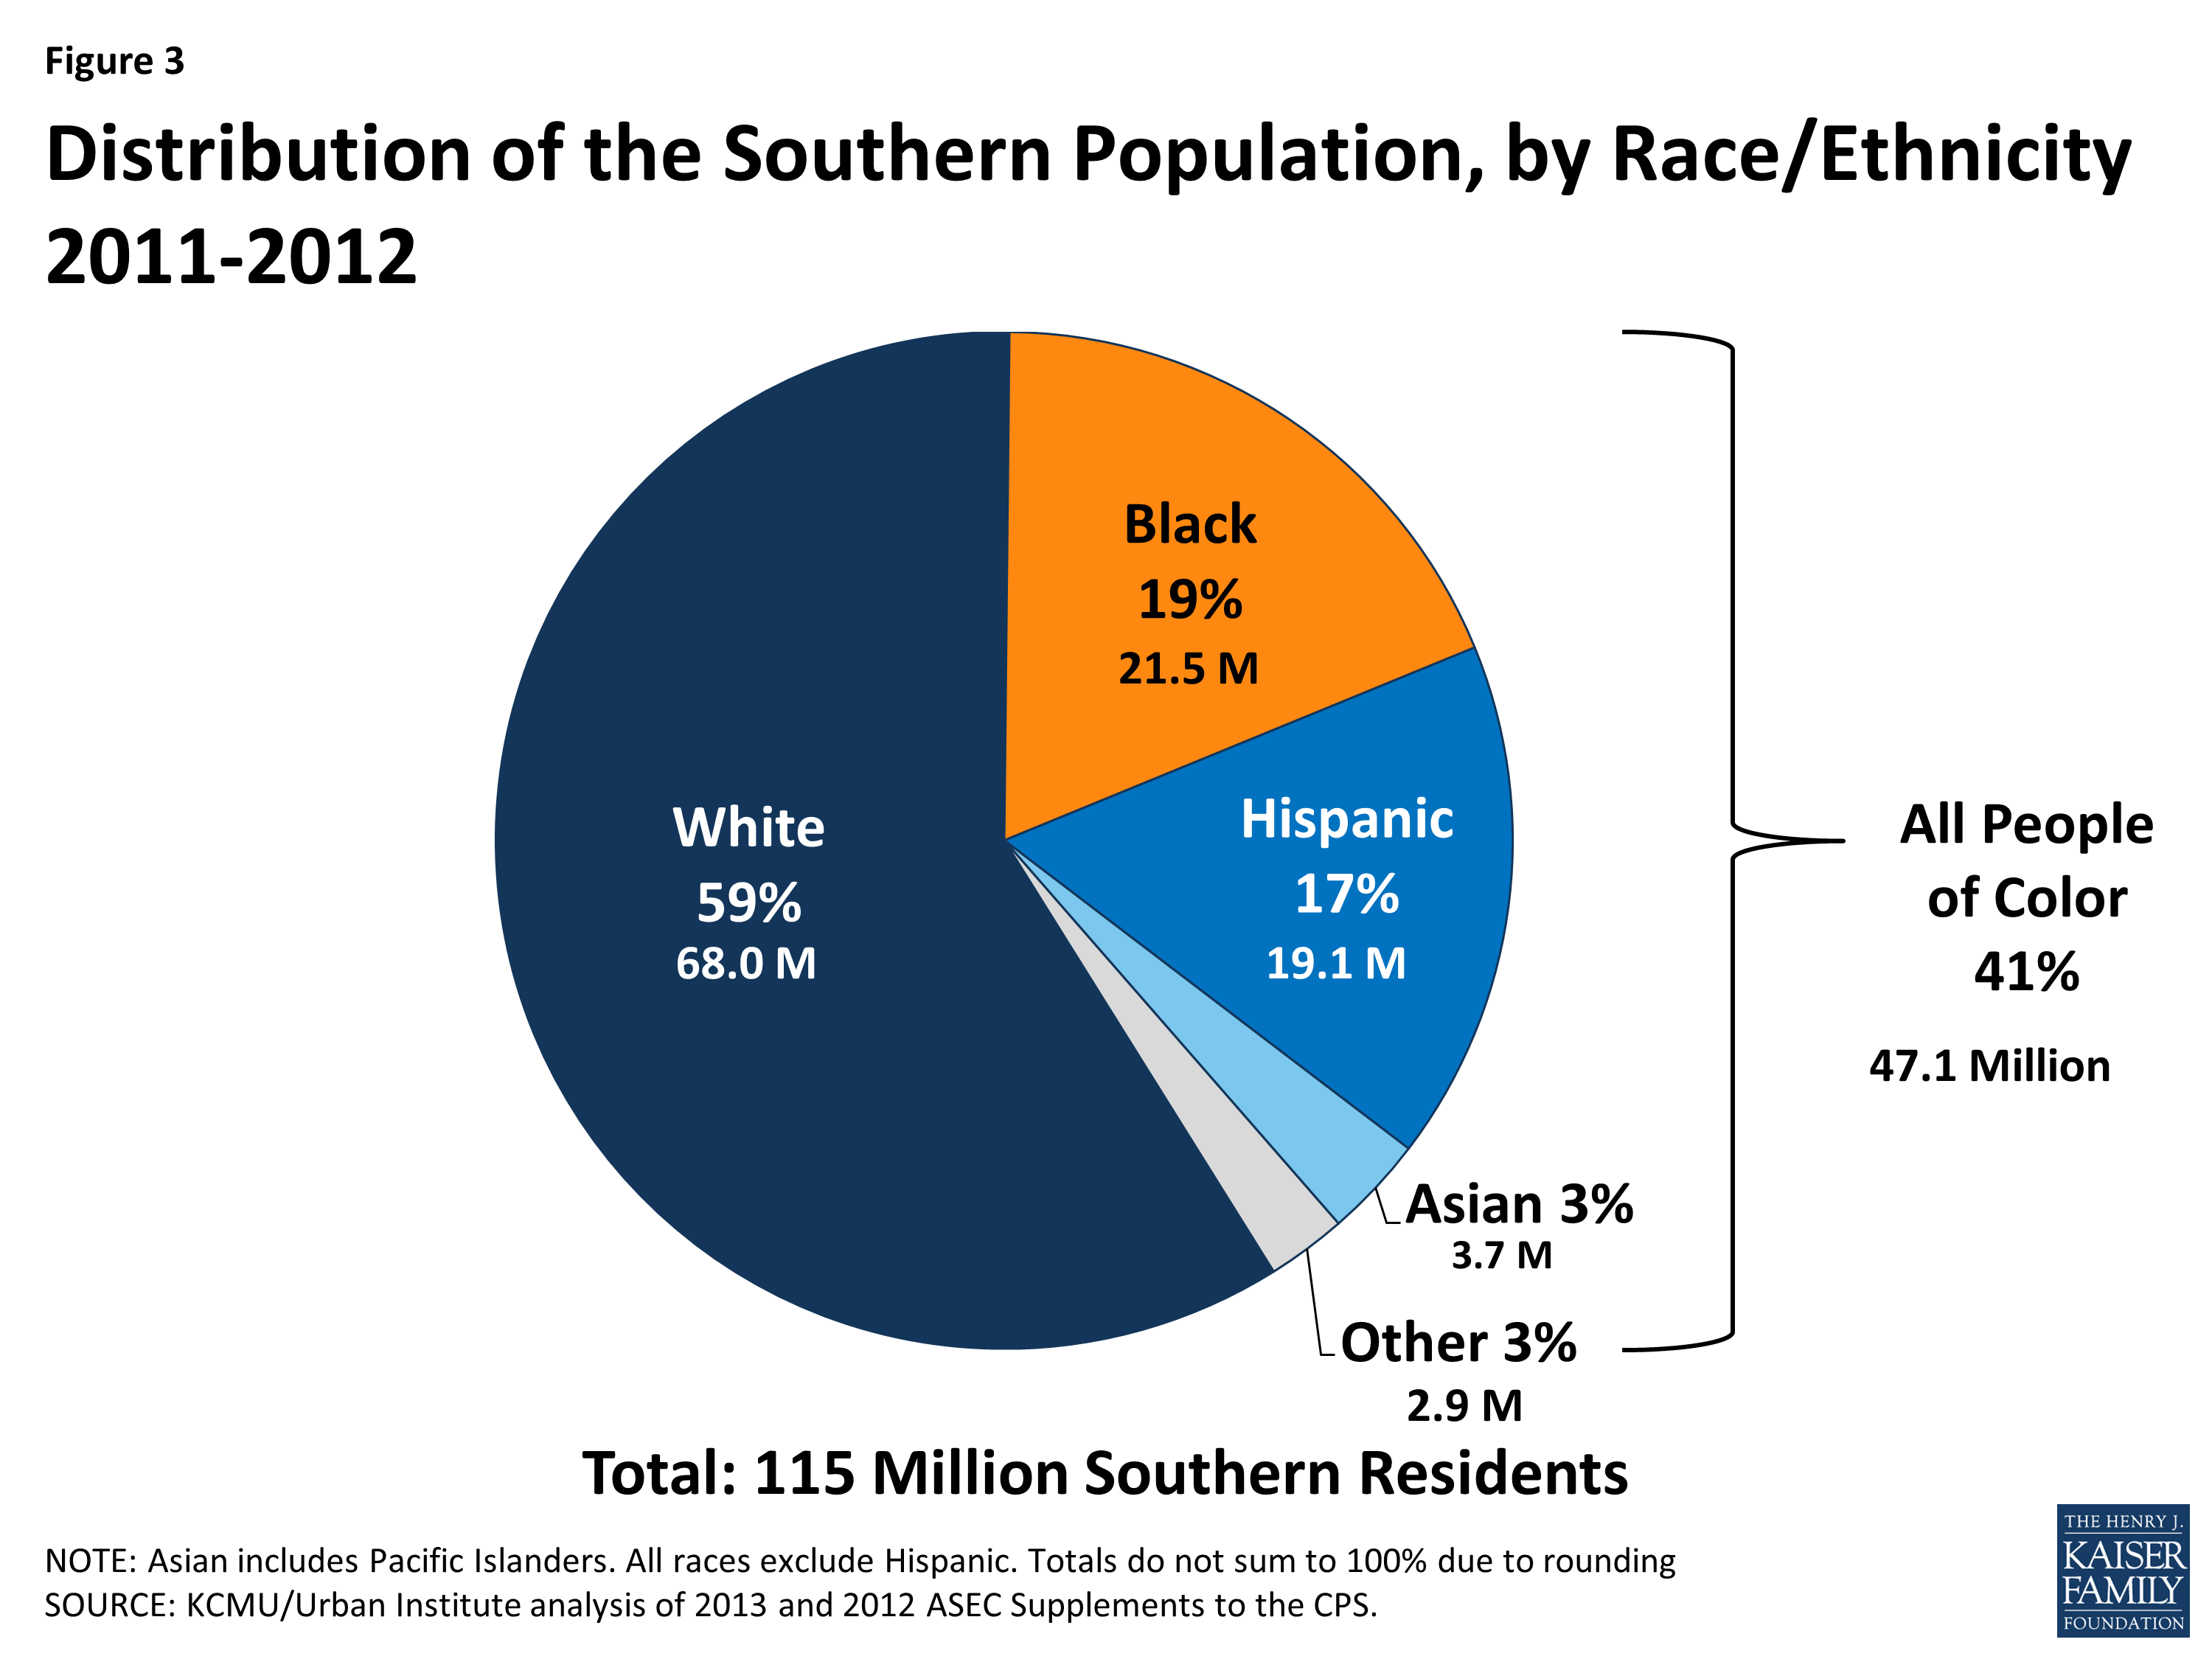
Figure 3: Distribution of the Southern Population, by Race/Ethnicity 2011-2012
Moreover, more than four in ten (41%) of all people of color reside in the South. However, the share of people residing in the South varies across racial and ethnic groups, with nearly six in ten Blacks residing in the South (58%) compared to about one in five Asians and Pacific Islanders (22%) (Figure 4).
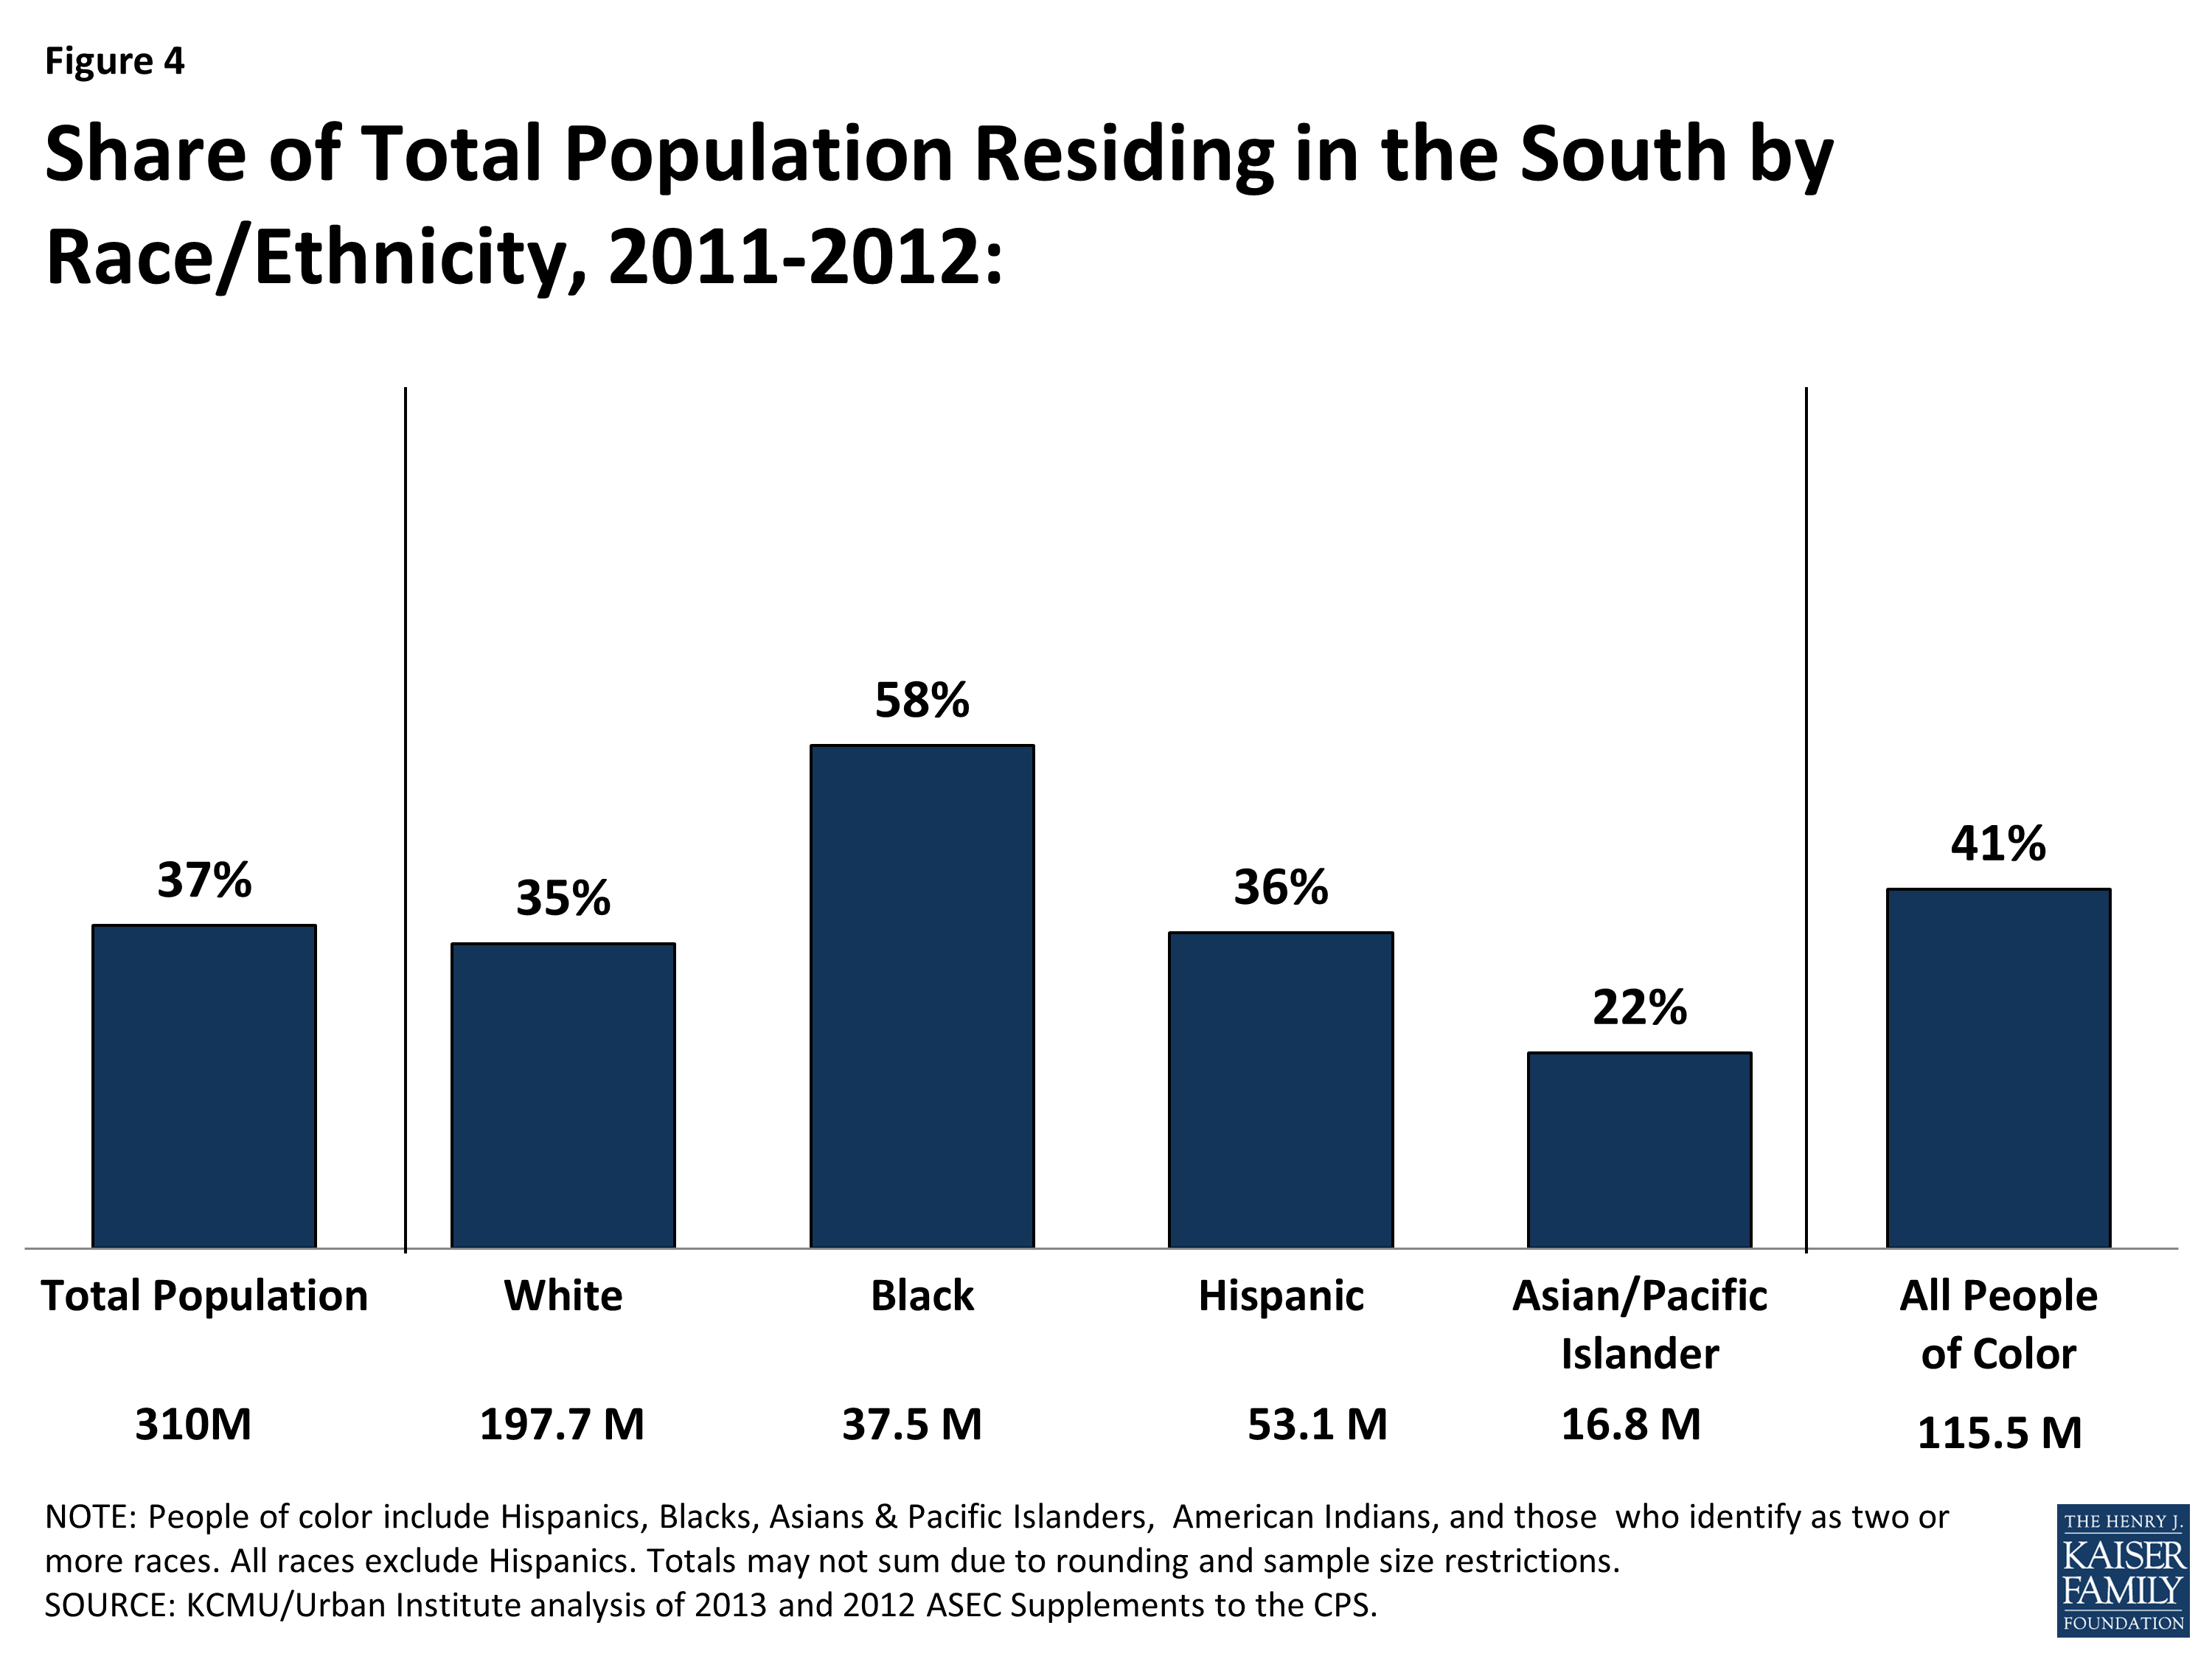
Figure 4: Share of Total Population Residing in the South by Race/Ethnicity, 2011-2012
The southern population is also diverse across a number of other characteristics, including citizenship status, age, educational attainment, and urban-rural composition. Similar to other regions, the large majority (89%) of Southerners are U.S.-born citizens, while about one in ten (11%) are immigrants, who include both naturalized citizens and non-citizens. The age distribution of the southern population is similar to that of other regions as well. About one-quarter (26%) of the region’s residents are children and 14% are elderly individuals. Young adults aged 19-34 account for 21% of the population. While the large majority (89%) of Southerners live in metropolitan settings, Southerners are more likely than those in the Northeast and West to live in a rural area (see Appendix Table 2).
Overall, three-quarters (77%) of nonelderly individuals in the South live in a household with at least one full-time worker. The majority of southern workers (62%) are in blue-collar jobs, most commonly in the service, trade, health services, and manufacturing industries.3 More than 15% of all workers have jobs in services, arts, or entertainment, and almost 14% of workers are in wholesale or retail trade.4 One in four workers in the South (25%) are employed by small firms or businesses with fewer than 50 employees, and 9% of Southern workers are self-employed (Figure 5). These work patterns in the South are similar to those of the general US population and other regions. 5
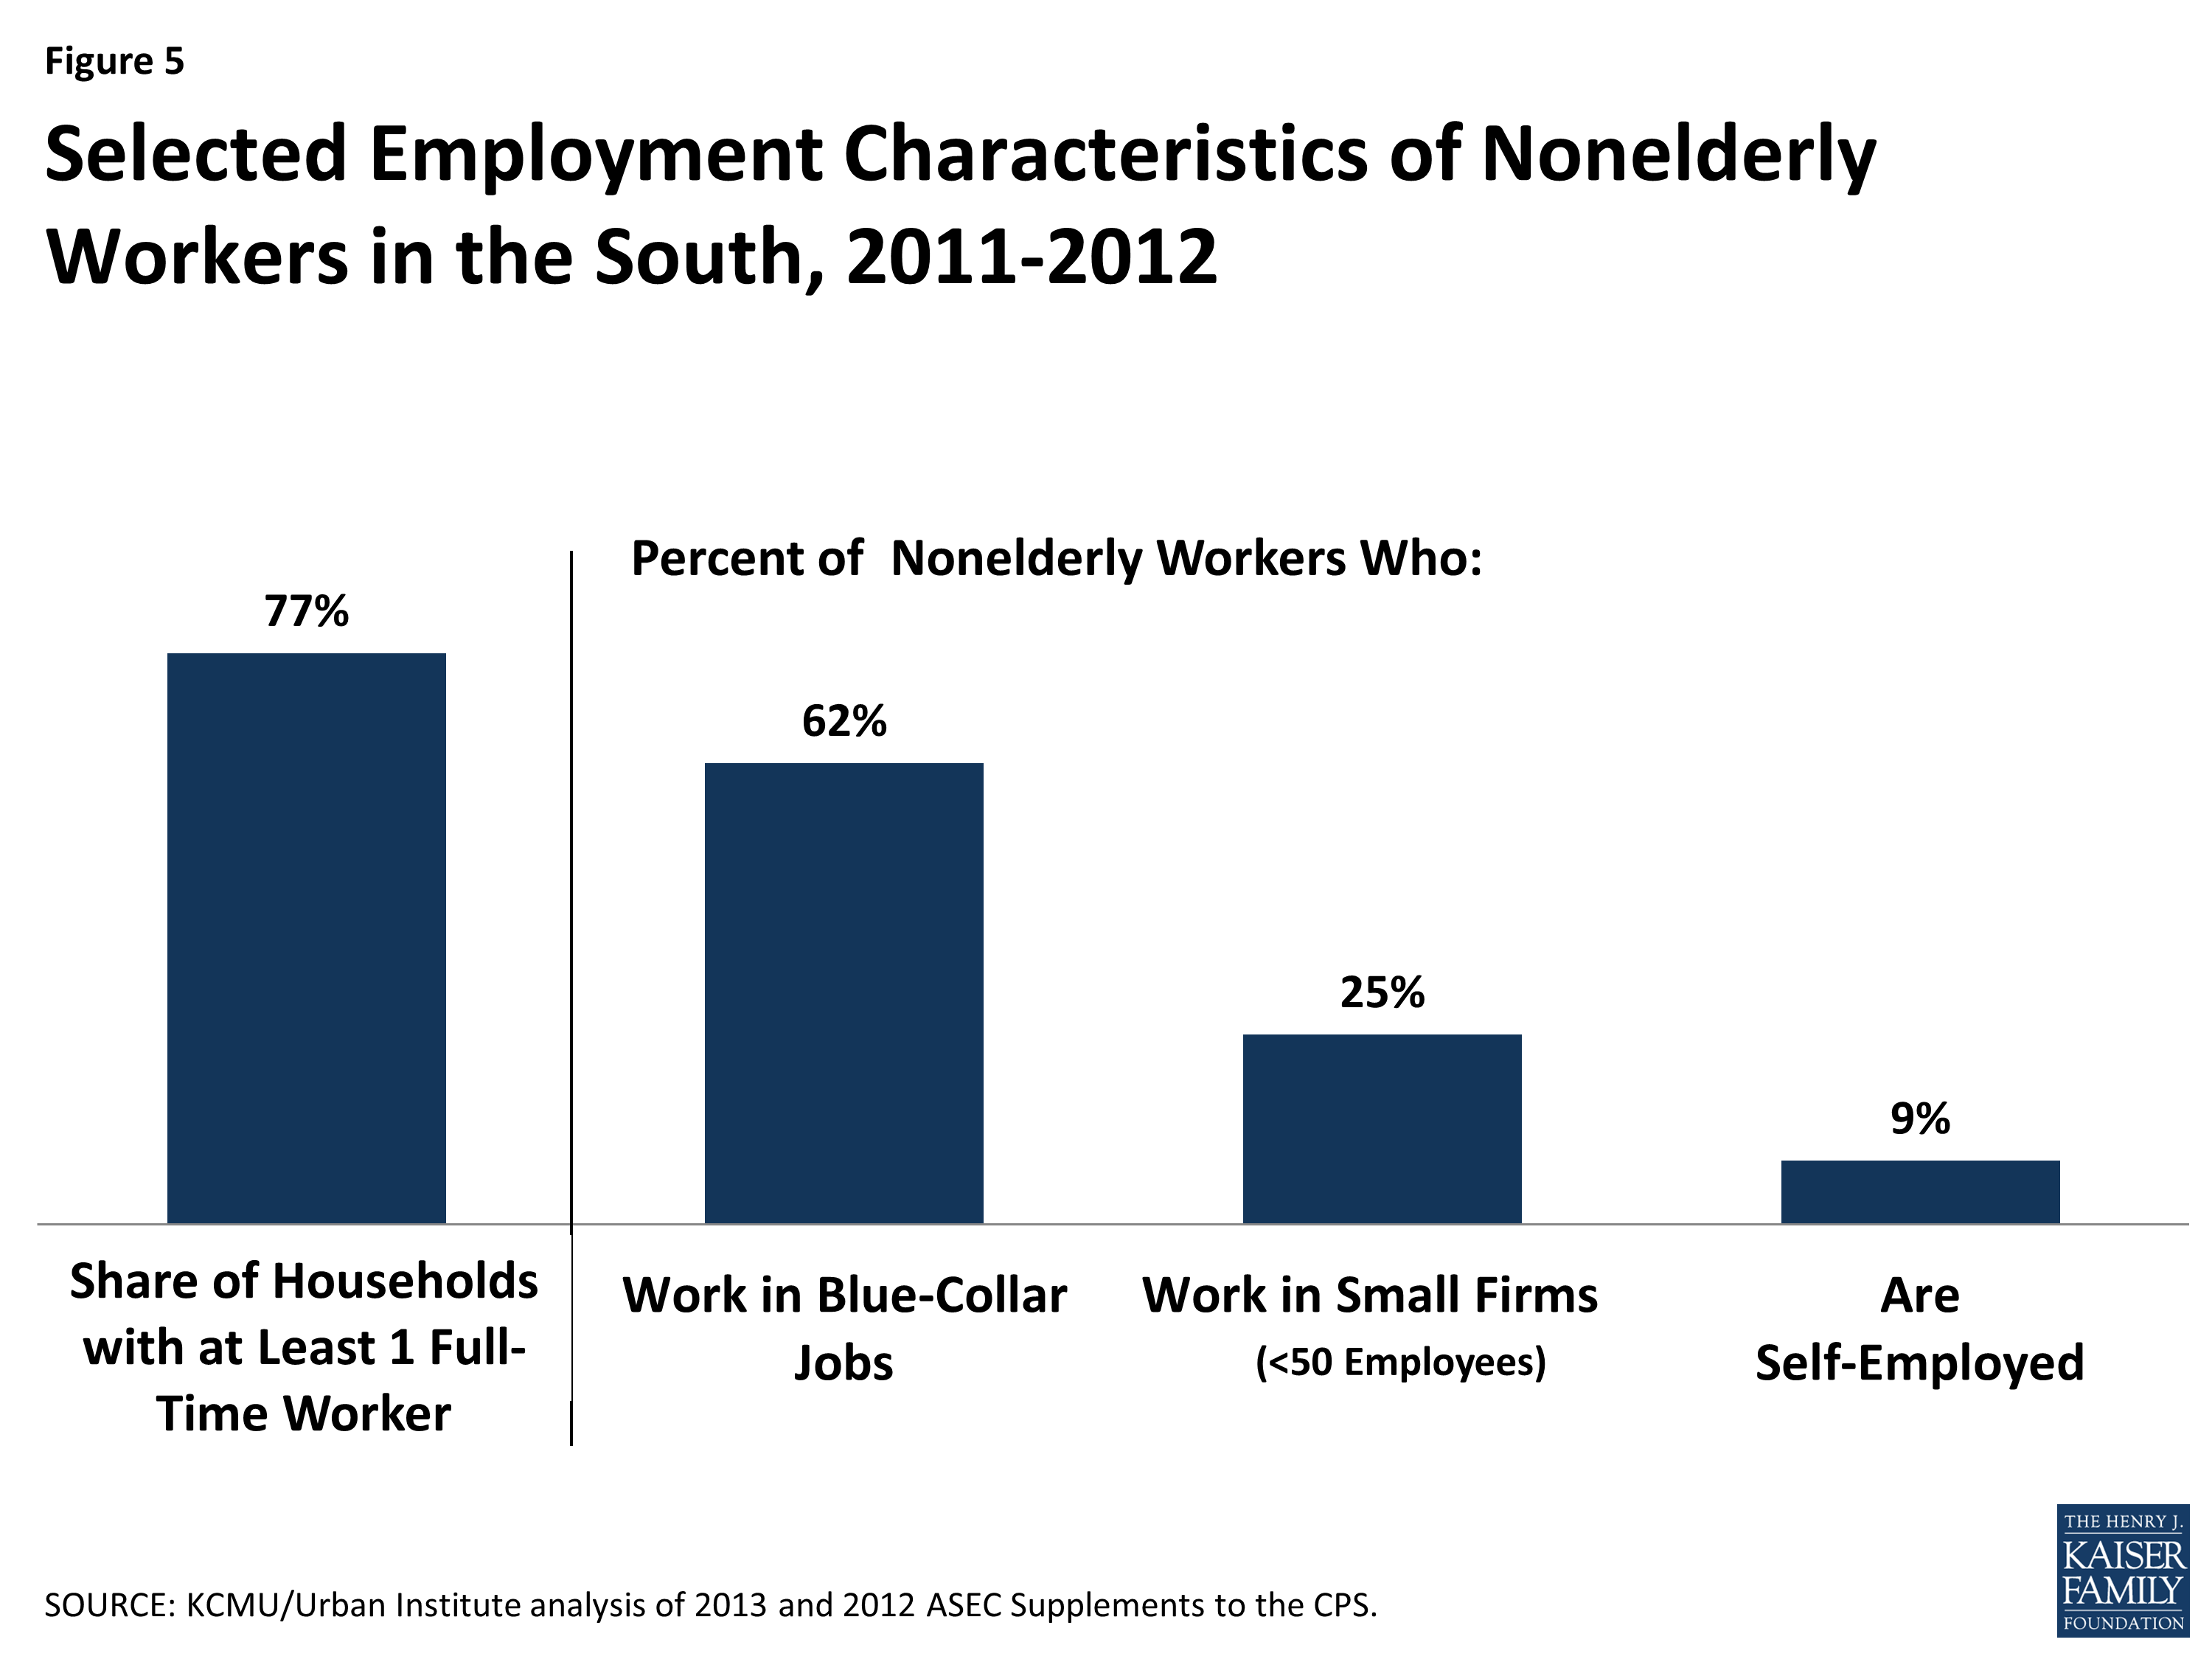
Figure 5: Selected Employment Characteristics of Nonelderly Workers in the South, 2011-2012
The South includes states with some of the nation’s highest poverty rates. Overall, the poverty rate for the South is not significantly different from the nation’s poverty rate, with just over one in five nonelderly southern residents (22%) living in a poor household.6 However, Southerners are significantly more likely than those in the Northeast and Midwest to be poor.7 Further, poverty rates vary widely across the southern states, and the region includes several states, including Louisiana, Mississippi, Arkansas, and the District of Columbia, that have among the highest rates of poverty in the nation (Table 2).
| Table 2: Number and Share of Nonelderly Southern Population Living in a Poor Household by State, 2011-2012 | ||
| State | Number Below Poverty | Percent Below Poverty |
| United States | 56,626,000 | 21% |
| South | 22,293,000 | 22% |
| Louisiana | 1,086,000 | 28% |
| Mississippi | 698,000 | 28% |
| Arkansas | 646,000 | 26% |
| District of Columbia | 137,000 | 25% |
| South Carolina | 952,000 | 24% |
| Alabama | 985,000 | 24% |
| Georgia | 2,028,000 | 24% |
| Kentucky | 879,000 | 24% |
| Tennessee | 1,262,000 | 23% |
| Texas | 5,363,000 | 23% |
| West Virginia | 345,000 | 22% |
| Florida | 3,431,000 | 22% |
| North Carolina | 1,772,000 | 22% |
| Oklahoma | 682,000 | 21% |
| Delaware | 155,000 | 20% |
| Virginia | 1,097,000 | 16% |
| Maryland | 776,000 | 15% |
| SOURCE: KCMU/Urban Institute analysis of 2013 and 2012 ASEC Supplements to the CPS. | ||