2024 Employer Health Benefits Survey
Section 9: Prescription Drug Benefits
Nearly all (99%) covered workers are at a firm which provides prescription drug coverage to enrollees in its largest health plan. Over time, employer plans have incorporated more complex benefit designs for prescription drugs as employers and insurers expand the use of formularies with multiple cost-sharing tiers, as well as other management approaches. To reduce the burden on respondents, we ask offering firms about the attributes of prescription drug coverage only for their largest health plan. This survey asks employers about the cost-sharing in up to four tiers, plus, if applicable, a tier exclusively for specialty drugs. Some plans may have more than one tier for specialty drugs or other variations that are not captured in the survey. There also may be other areas of variation in how plans structure their formularies that are not captured.
DISTRIBUTION OF COST SHARING
- The large majority of covered workers (89%) are in a plan with tiered cost sharing for prescription drugs [Figure 9.1]. Cost-sharing tiers generally refer to a health plan placing a drug on a formulary or preferred drug list that classifies drugs into categories that are subject to different cost sharing or management. Commonly, there are different tiers for generic, preferred and non-preferred drugs. In recent years, plans have created additional tiers that may be used for specialty drugs or more expensive drugs such as biologics. Some plans may have multiple tiers for different categories.
- Eighty-six percent of covered workers are in a plan with three, four, or even more tiers of cost sharing for prescription drugs [Figure 9.1]. These totals include tiers that cover only specialty drugs, although the cost-sharing information for the specialty tier is reported separately below.
- Compared to covered workers in other plan types, those in HDHP/SOs are more likely to be in a plan that has no cost sharing for prescriptions once the plan deductible is met (11% vs. 2%) [Figure 9.2].
- Small firms are more likely to have no cost sharing after the deductible is met compared to large firms (8% vs. 3%) [Figure 9.2].
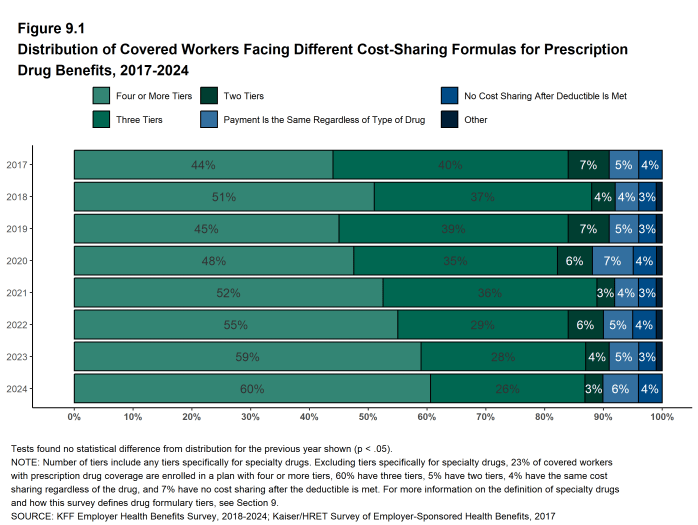
Figure 9.1: Distribution of Covered Workers Facing Different Cost-Sharing Formulas for Prescription Drug Benefits, 2017-2024
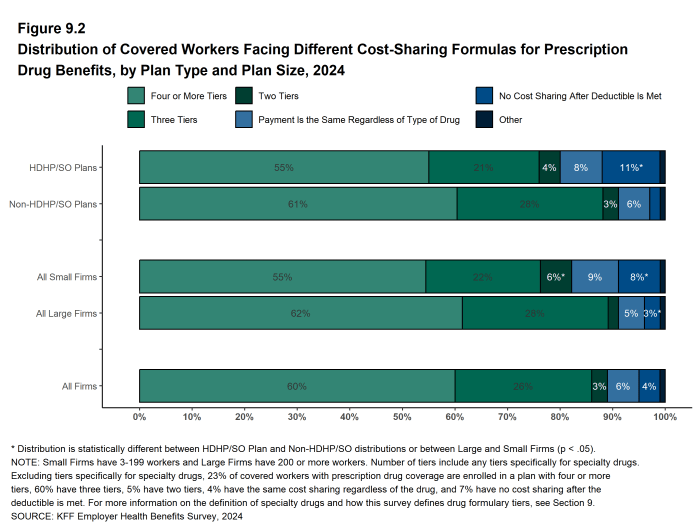
Figure 9.2: Distribution of Covered Workers Facing Different Cost-Sharing Formulas for Prescription Drug Benefits, by Plan Type and Plan Size, 2024
TIERS NOT EXCLUSIVELY FOR SPECIALTY DRUGS
- Even when formulary tiers covering only specialty drugs are not counted, a large share (83%) of covered workers are in a plan with three or more tiers of cost sharing for prescription drugs. The cost-sharing statistics presented in this section do not include information about tiers that cover only specialty drugs. In cases in which a plan covers specialty drugs on a tier with other drugs, they will be included in these averages. Cost-sharing statistics for tiers covering only specialty drugs are presented separately below.
- For covered workers in a plan with three or more tiers of cost sharing for prescription drugs, copayments are the most common form of cost sharing in the first three tiers and coinsurance is the second-most common [Figure 9.3].
- Among covered workers in plans with three or more tiers of cost sharing for prescription drugs, the average copayment is $12 for first-tier drugs, $36 second-tier drugs, $65 for third-tier drugs, and $128 for fourth-tier drugs [Figure 9.6].
- Among covered workers in plans with three or more tiers of cost sharing for prescription drugs, the average coinsurance rate is 22% for first-tier drugs, 27% for second-tier drugs, 35% for third-tier drugs, and 33% for fourth-tier drugs [Figure 9.6].
- Five percent of covered workers are in a plan with two tiers for prescription drug cost sharing (excluding tiers covering only specialty drugs).
- For these workers, copayments are more common than coinsurance in both tiers [Figure 9.3]. The average copayment is $11 for the first tier and $39 for the second tier. [Figure 9.6].
- Four percent of covered workers are in a plan with the same cost sharing for prescriptions regardless of the type of drug (excluding tiers covering only specialty drugs) [Figure 9.2].
- Among these workers, 53% have copayments and 47% have a coinsurance rate [Figure 9.3].
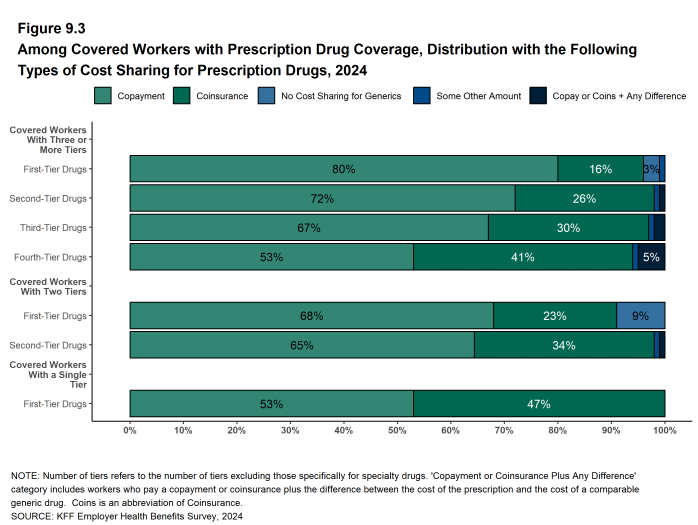
Figure 9.3: Among Covered Workers With Prescription Drug Coverage, Distribution With the Following Types of Cost Sharing for Prescription Drugs, 2024
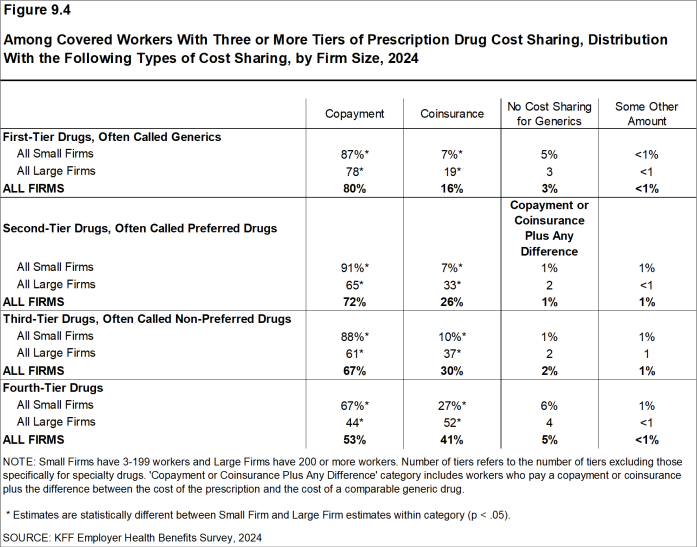
Figure 9.4: Among Covered Workers With Three or More Tiers of Prescription Drug Cost Sharing, Distribution With the Following Types of Cost Sharing, by Firm Size, 2024
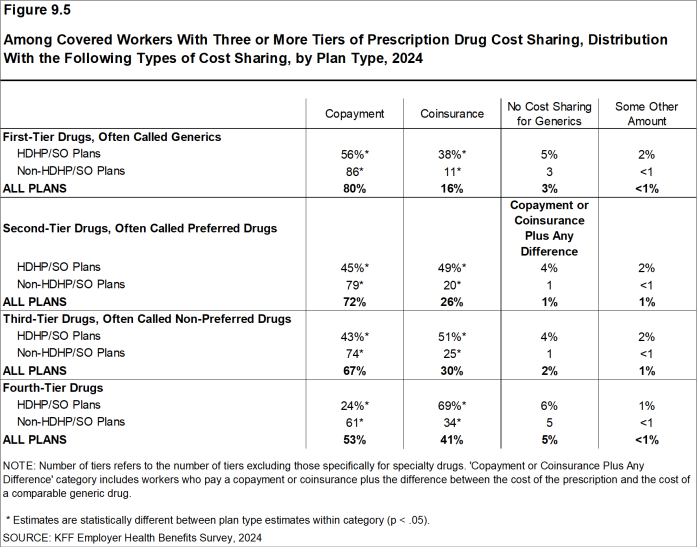
Figure 9.5: Among Covered Workers With Three or More Tiers of Prescription Drug Cost Sharing, Distribution With the Following Types of Cost Sharing, by Plan Type, 2024
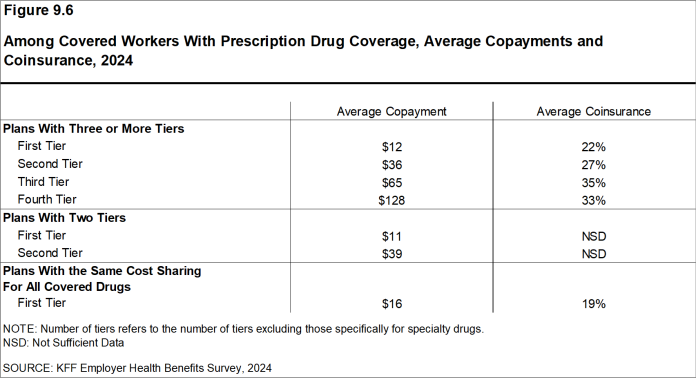
Figure 9.6: Among Covered Workers With Prescription Drug Coverage, Average Copayments and Coinsurance, 2024
COINSURANCE MAXIMUMS
- Coinsurance rates for prescription drugs often include maximum and/or minimum dollar amounts. Depending on the plan design, coinsurance maximums can significantly limit the amount an enrollee must spend out-of-pocket for higher-cost drugs. Even in plans without explicit coinsurance maximum amounts, the overall plan out-of-pocket maximum limits enrollee cost sharing on covered services, including prescription drugs.
- These coinsurance minimum and maximum amounts vary across tiers and plan designs.
- For example, among covered workers in a plan with coinsurance for the third cost-sharing tier, 32% have only a maximum dollar amount attached to the coinsurance rate, 7% have only a minimum dollar amount, 30% have both a minimum and maximum dollar amount, and 30% have neither. For those in a plan with coinsurance for the fourth cost-sharing tier, 56% have only a maximum dollar amount attached to the coinsurance rate, 2% have only a minimum dollar amount, 11% have both a minimum and maximum dollar amount, and 30% have neither [Figure 9.7].
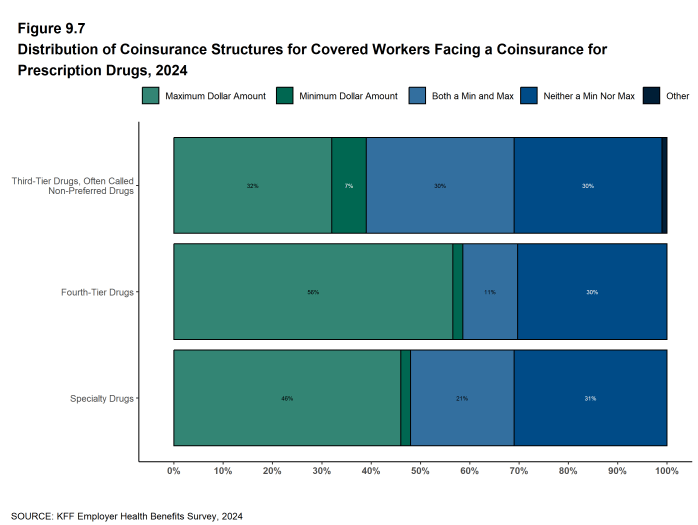
Figure 9.7: Distribution of Coinsurance Structures for Covered Workers Facing a Coinsurance for Prescription Drugs, 2024
SEPARATE TIERS FOR SPECIALTY DRUGS
- Specialty drugs, such as biologics that may be used to treat chronic conditions or some cancer drugs, can be quite expensive and often require special handling and administration. In 2016, we revised our survey questions to obtain more information about formulary tiers that are exclusively for specialty drugs. We are reporting results only among large firms because small firm respondents had large shares of “don’t know” responses to some of these questions.
- Ninety-seven percent of covered workers at large firms have coverage for specialty drugs, the same percentage as last year. Among these workers, 65% are in a plan with at least one cost-sharing tier just for specialty drugs [Figure 9.8].
- Among covered workers at large firms in a plan with at least one separate tier for specialty drugs, 41% have a copayment for specialty drugs and 55% have coinsurance [Figure 9.10]. The average copayment is $118 and the average coinsurance rate is 25% [Figure 9.11]. Sixty-five percent of those with coinsurance have a maximum dollar limit on the amount of coinsurance they must pay.
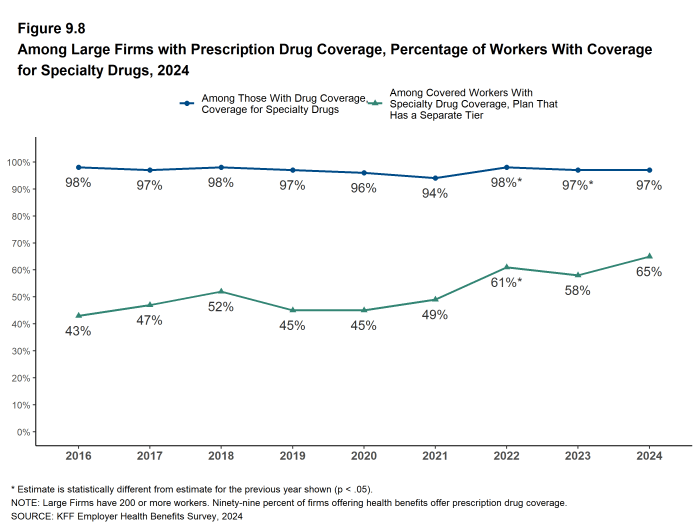
Figure 9.8: Among Large Firms With Prescription Drug Coverage, Percentage of Workers With Coverage for Specialty Drugs, 2024
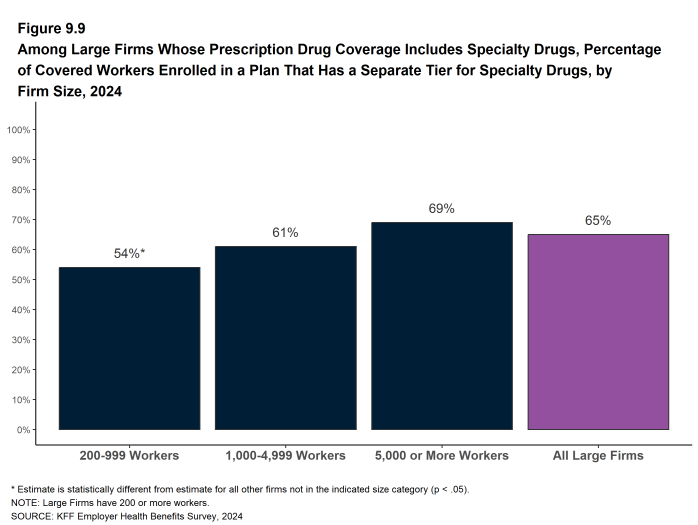
Figure 9.9: Among Large Firms Whose Prescription Drug Coverage Includes Specialty Drugs, Percentage of Covered Workers Enrolled in a Plan That Has a Separate Tier for Specialty Drugs, by Firm Size, 2024
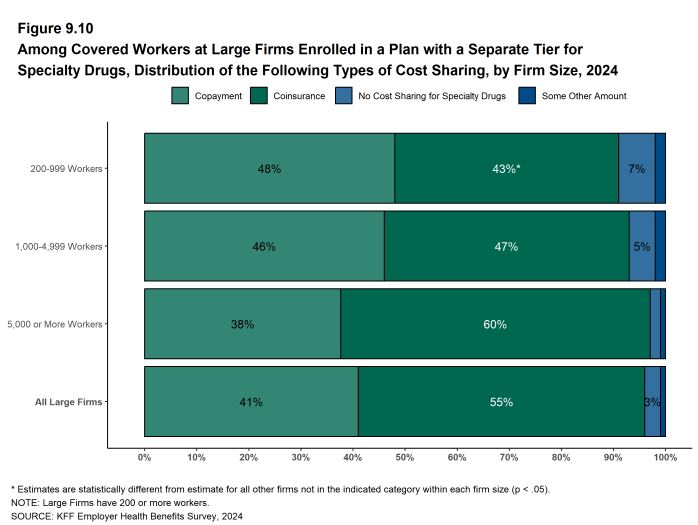
Figure 9.10: Among Covered Workers at Large Firms Enrolled in a Plan With a Separate Tier for Specialty Drugs, Distribution of the Following Types of Cost Sharing, by Firm Size, 2024
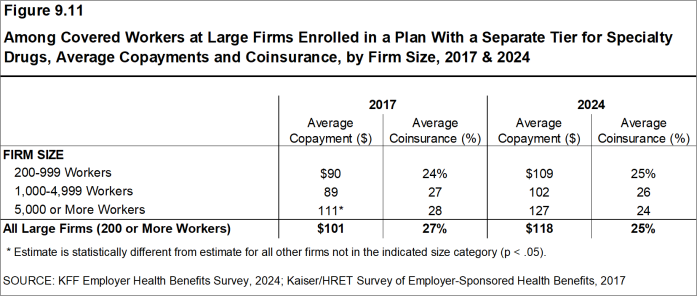
Figure 9.11: Among Covered Workers at Large Firms Enrolled in a Plan With a Separate Tier for Specialty Drugs, Average Copayments and Coinsurance, by Firm Size, 2017 & 2024
PRESCRIPTION DRUG ADMINISTRATION
Firms with 50 or more workers that offer coverage for prescriptions were asked about several attributes of their prescription drug coverage. Among the covered workers in these firms:
- Forty-four percent are enrolled in a plan that reduces or waives cost sharing for prescription drugs needed to maintain health for one or more chronic illnesses, such as insulin products for diabetics [Figure 9.12]. Firms with 5,000 or more workers are more likely to have this policy (51%) [Figure 9.13].
- Fifty-eight percent are enrolled in a plan that has incentives such as lower cost sharing to encourage enrollees to fill prescriptions through a mail-order pharmacy. Firms with 5,000 or more workers are more likely to have this policy (65%) while firms with 50 to 199 workers are less likely to have this policy (44%) [Figure 9.15].
- Eighteen percent are enrolled in a plan that limits coverage for some medications only to those received through a mail-order pharmacy [Figure 9.14].
- Thirty-one percent are enrolled in a plan that offers coverage for lower cost, mail-order generics, either as part of the plan or through a third- party vendor, such as “Mark Cuban Cost Plus” or “GoodRx” [Figure 9.16].
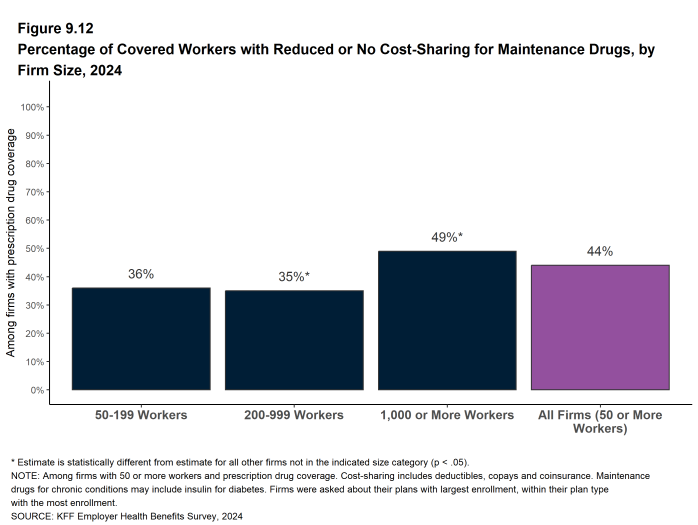
Figure 9.12: Percentage of Covered Workers With Reduced or No Cost-Sharing for Maintenance Drugs, by Firm Size, 2024
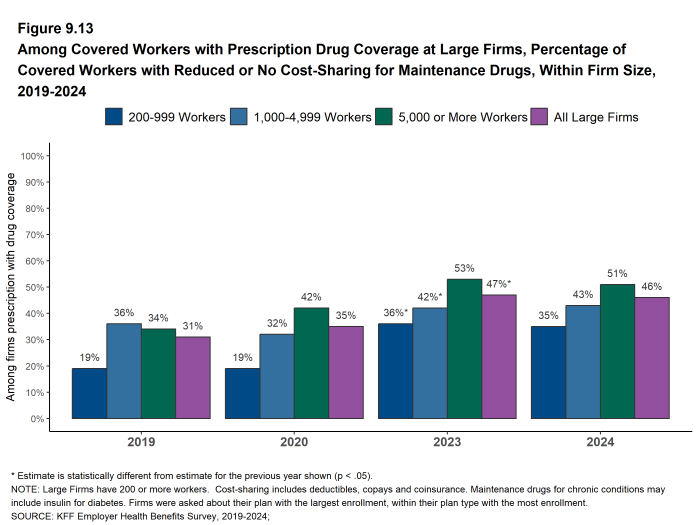
Figure 9.13: Among Covered Workers With Prescription Drug Coverage at Large Firms, Percentage of Covered Workers With Reduced or No Cost-Sharing for Maintenance Drugs, Within Firm Size, 2019-2024
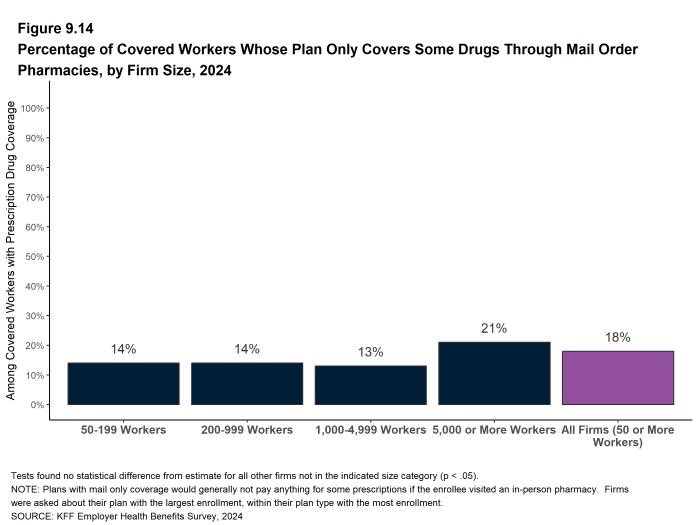
Figure 9.14: Percentage of Covered Workers Whose Plan Only Covers Some Drugs Through Mail Order Pharmacies, by Firm Size, 2024
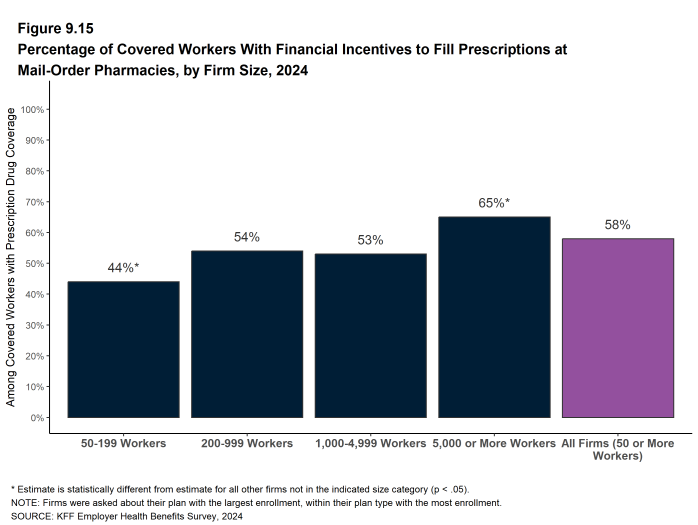
Figure 9.15: Percentage of Covered Workers With Financial Incentives to Fill Prescriptions at Mail-Order Pharmacies, by Firm Size, 2024
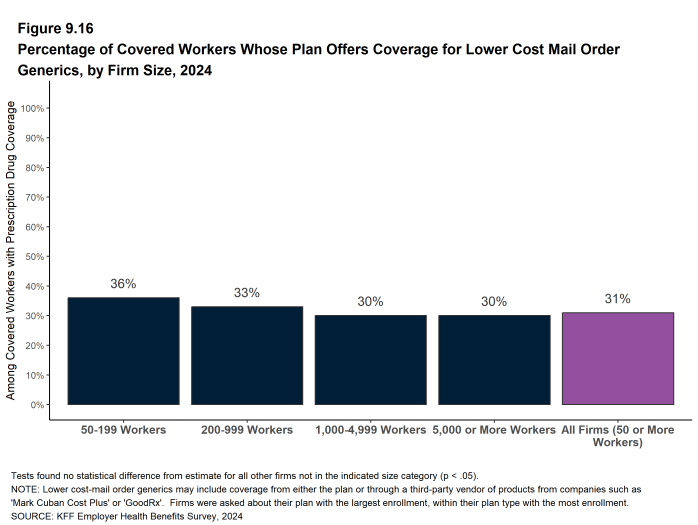
Figure 9.16: Percentage of Covered Workers Whose Plan Offers Coverage for Lower Cost Mail Order Generics, by Firm Size, 2024
Generic drugs Drugs that are no longer covered by patent protection and thus may be produced and/or distributed by multiple drug companies.
Preferred drugs Drugs included on a formulary or preferred drug list; for example, a brand-name drug without a generic substitute.
Non-preferred drugs Drugs not included on a formulary or preferred drug list; for example, a brand-name drug with a generic substitute.
Fourth-tier drugs New types of cost-sharing arrangements that typically build additional layers of higher copayments or coinsurance for specifically identified types of drugs, such as lifestyle drugs or biologics.
Specialty drugs Specialty drugs such as biological drugs are high cost drugs that may be used to treat chronic conditions such as blood disorder, arthritis or cancer. Often times they require special handling and may be administered through injection or infusion.