2024 Employer Health Benefits Survey
Section 7: Employee Cost Sharing
In addition to any required premium contributions, most covered workers must pay a share of the cost for the medical services they use. The most common forms of cost-sharing are deductibles (an amount that must be paid before most services are covered by the plan), copayments (fixed dollar amounts), and coinsurance (a percentage of the charge for services). Some plans combine cost-sharing forms, such as requiring coinsurance for a service up to a maximum amount, or assessing either coinsurance or a copayment for a service, whichever is higher. The type and level of cost-sharing may vary with the type of plan in which the worker is enrolled. Cost sharing may also vary by the type of service, with separate classifications for office visits, hospitalizations, or prescription drugs.
The cost-sharing amounts reported here are for covered workers using in-network services. Plan enrollees receiving services from providers that do not participate in plan networks often face higher cost-sharing and may be responsible for charges that exceed the plan’s allowable amounts. The framework of this survey does not allow us to capture all of the complex cost-sharing requirements in modern plans, including ancillary services (such as durable medical equipment or physical therapy) or cost-sharing arrangements that vary across different settings (such as tiered networks). Therefore, we do not collect information on all plan provisions and limits that affect enrollee out-of-pocket liability.
GENERAL ANNUAL DEDUCTIBLES FOR WORKERS IN PLANS WITH DEDUCTIBLES
- We consider a general annual deductible to be an amount that must be paid by enrollees before most services are covered by their health plan. Non-grandfathered health plans are required to cover some services, such as preventive care, without cost-sharing. Some plans require enrollees to meet a specific deductible for certain services, like prescription drugs or hospital admissions, in lieu of or in addition to a general annual deductible. As discussed below, some plans with a general annual deductible for most services exclude specified classes of care from the deductible, such as prescriptions or physician office visits.
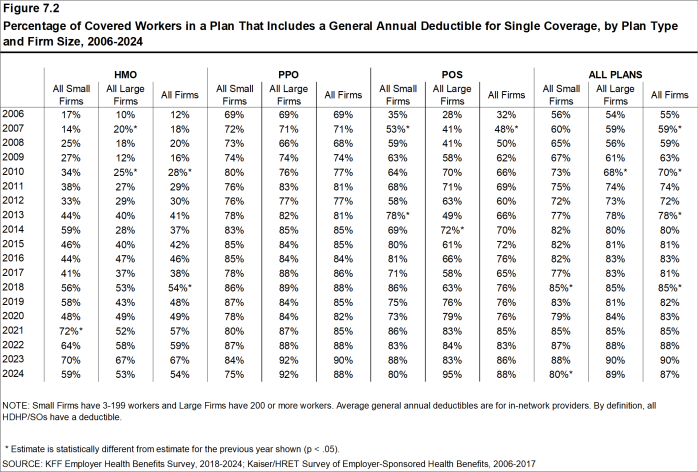
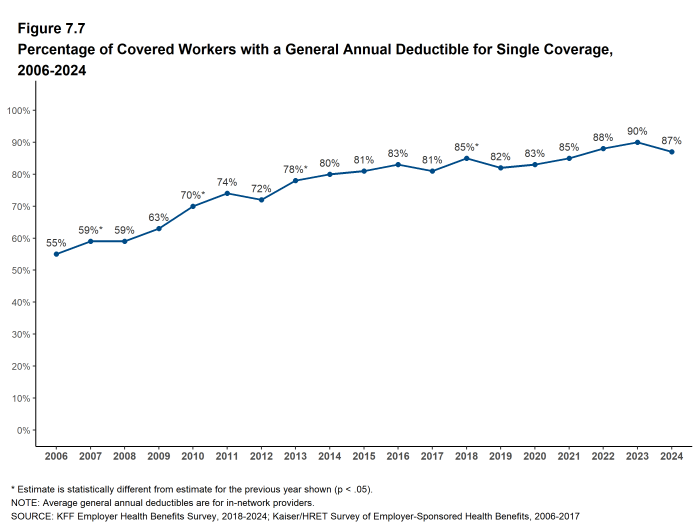
- Eighty-seven percent of covered workers in 2024 are enrolled in a plan with a general annual deductible for single coverage, similar to the percentage last year (90%) but higher than the percentages five years ago (82%) and ten years ago (80%) [Figure 7.2].
- The percent of covered workers enrolled in a plan with a general annual deductible for single coverage is lower for covered workers in small firms (3-199 workers) (80%) than for those in large firms (200 or more workers) (89%) [Figure 7.2].
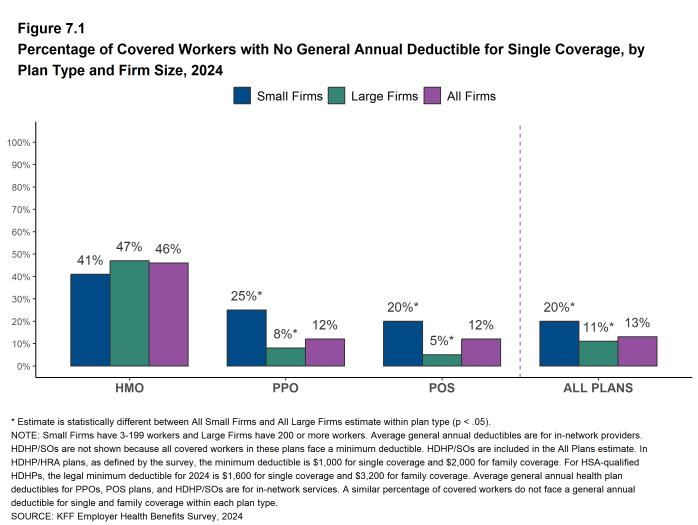
- The likelihood of a plan having a general annual deductible varies by plan type. Forty-six percent of covered workers in HMOs do not have a general annual deductible for single coverage, compared to 12% of workers in POS plans and 12% of workers in PPOs [Figure 7.1].
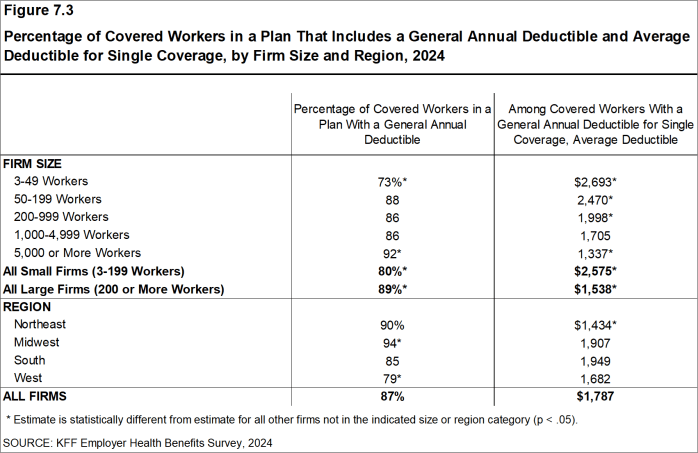
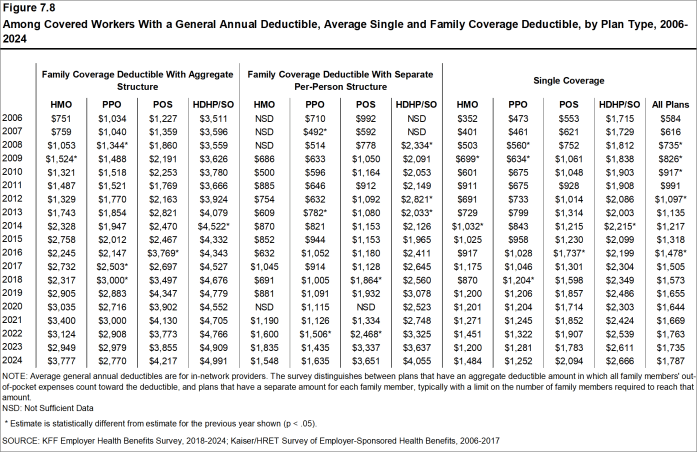
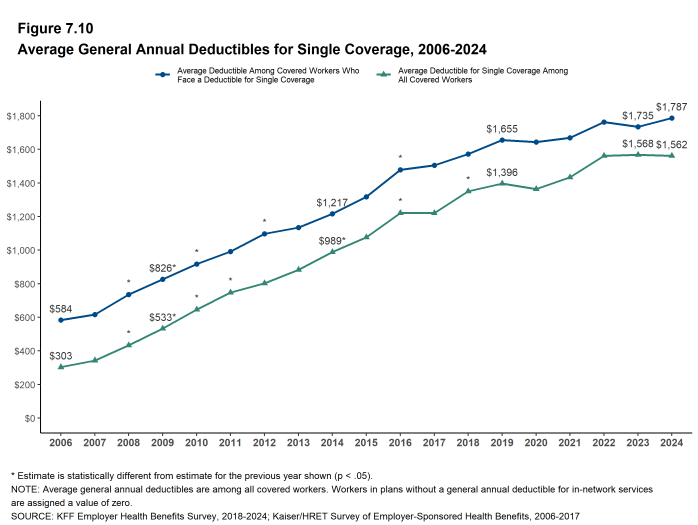
- For workers with single coverage in a plan with a general annual deductible, the average annual deductible is $1,787, similar to the average deductible last year ($1,735) [Figure 7.3] and [Figure 7.8].
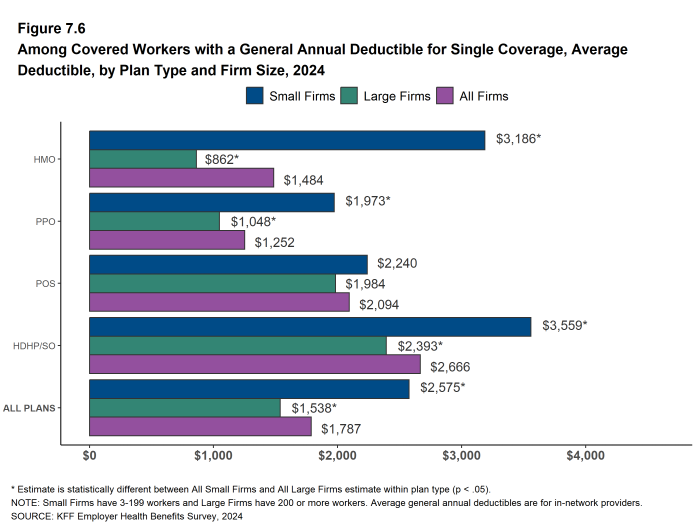
- For covered workers in plans with a general annual deductible, the average deductibles for single coverage are $1,484 in HMOs, $1,252 in PPOs, $2,094 in POS plans, and $2,666 in HDHP/SOs [Figure 7.6].
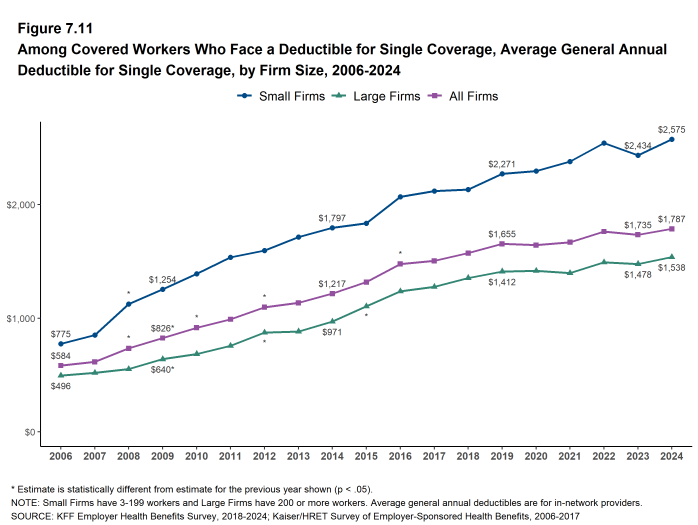
- The average deductibles for single coverage are higher for covered workers at small firms than at large firms in most plan types. For covered workers in PPOs, the most common plan type, the average deductible for single coverage is considerably higher for covered workers in small firms as compared to those in large firms ($1,973 vs. $1,048) [Figure 7.6]. Overall, for covered workers in plans with a general annual deductible, the average deductible for single coverage at small firms ($2,575) is higher than the average deductible at large firms ($1,538) [Figure 7.3].
- The average general annual deductible for single coverage for workers in plans with a deductible is similar to the amount five years ago ($1,787 v. $1,655) but is higher than the amount ten years ago ($1,787) v. $1,217) [Figure 7.8].
Figure 7.1: Percentage of Covered Workers With No General Annual Deductible for Single Coverage, by Plan Type and Firm Size, 2024
Figure 7.2: Percentage of Covered Workers in a Plan That Includes a General Annual Deductible for Single Coverage, by Plan Type and Firm Size, 2006-2024
Figure 7.3: Percentage of Covered Workers in a Plan That Includes a General Annual Deductible and Average Deductible for Single Coverage, by Firm Size and Region, 2024
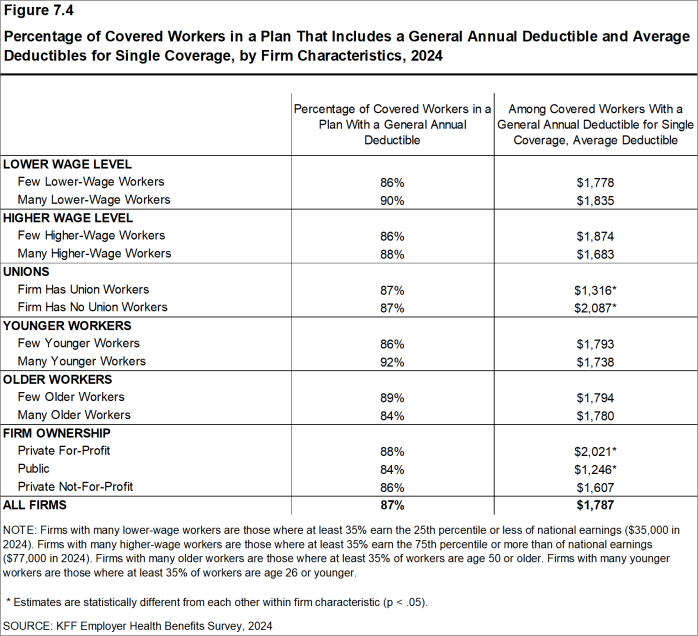
Figure 7.4: Percentage of Covered Workers in a Plan That Includes a General Annual Deductible and Average Deductibles for Single Coverage, by Firm Characteristics, 2024
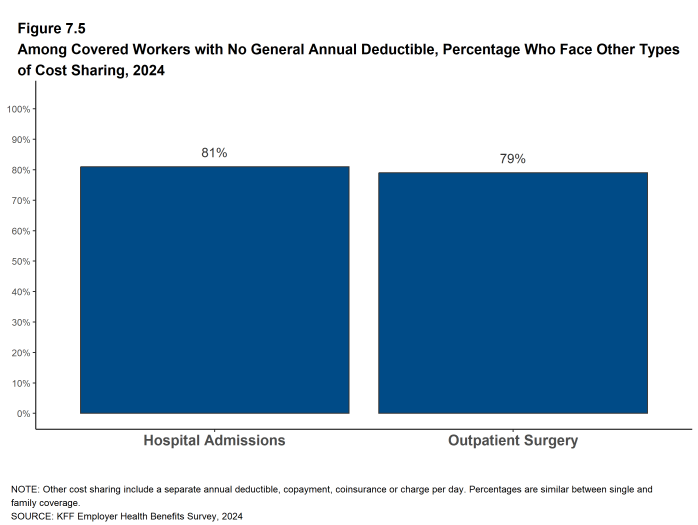
Figure 7.5: Among Covered Workers With No General Annual Deductible, Percentage Who Face Other Types of Cost Sharing, 2024
Figure 7.6: Among Covered Workers With a General Annual Deductible for Single Coverage, Average Deductible, by Plan Type and Firm Size, 2024
Figure 7.7: Percentage of Covered Workers With a General Annual Deductible for Single Coverage, 2006-2024
GENERAL ANNUAL DEDUCTIBLES AMONG ALL COVERED WORKERS
- As discussed above, the share of covered workers in plans with a general annual deductible has increased over time, from 80% in 2014 to 87% in 2024 [Figure 7.7]. The average deductible amount for covered workers in plans with a deductible has also increased over this period, from $1,217 in 2014 to $1,787 in 2024 [Figure 7.10]. Neither trend by itself, however, captures the full impact that changes in deductibles have had on covered workers. We can look at the average impact of both trends together by assigning a zero deductible value to covered workers in plans with no deductible and looking at how the resulting averages change over time. These average deductible amounts are lower in any given year than the averages for only people in plans with deductibles, but the changes over time reflect both workers facing higher monetary deductible amounts and a greater number of workers facing deductibles.
- Using this approach, the average general annual deductible for single coverage for all covered workers (with or without a deductible) in 2024 is $1,562, similar to the amount last year ($1,568) [Figure 7.10].
- The 2024 value is 12% higher than the average general annual deductible in 2019 ($1,396) and 58% higher than in 2014 ($989) [Figure 7.10].
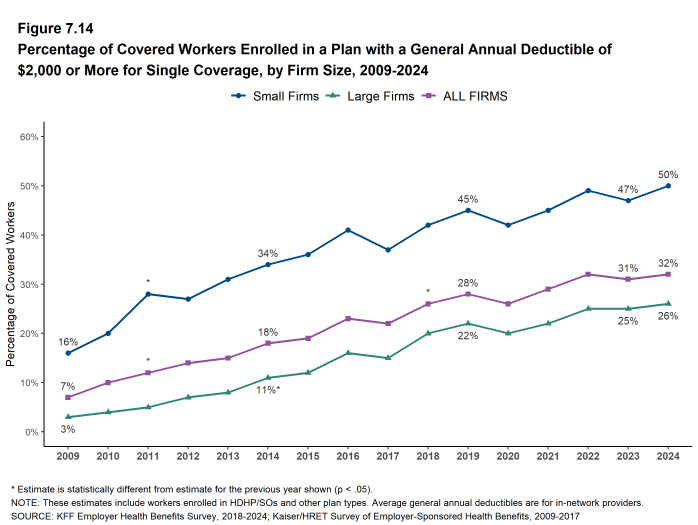
- Another way to examine the impact of deductibles on covered workers is to look at the percent of all covered workers who are in a plan with a deductible that exceeds a certain amount. Thirty-two percent of covered workers are in plans with a general annual deductible of $2,000 or more for single coverage, similar to the percentages last year (31%) and five years ago (28%) [Figure 7.14].
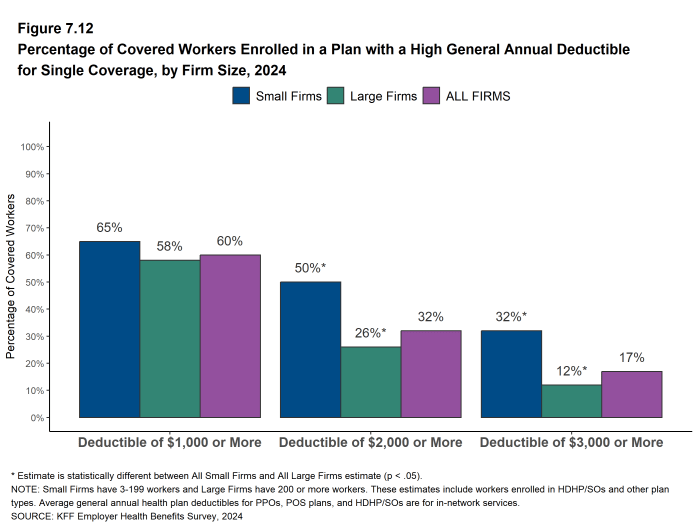
- Workers at small firms are considerably more likely to have a general annual deductible of $2,000 or more for single coverage than workers at large firms (50% vs. 26%) [Figure 7.12].
Figure 7.9: Prevalence and Value of General Annual Deductibles for Single Coverage, by Firm Size, 2006-2024
Figure 7.11: Among Covered Workers Who Face a Deductible for Single Coverage, Average General Annual Deductible for Single Coverage, by Firm Size, 2006-2024
Figure 7.12: Percentage of Covered Workers Enrolled in a Plan With a High General Annual Deductible for Single Coverage, by Firm Size, 2024
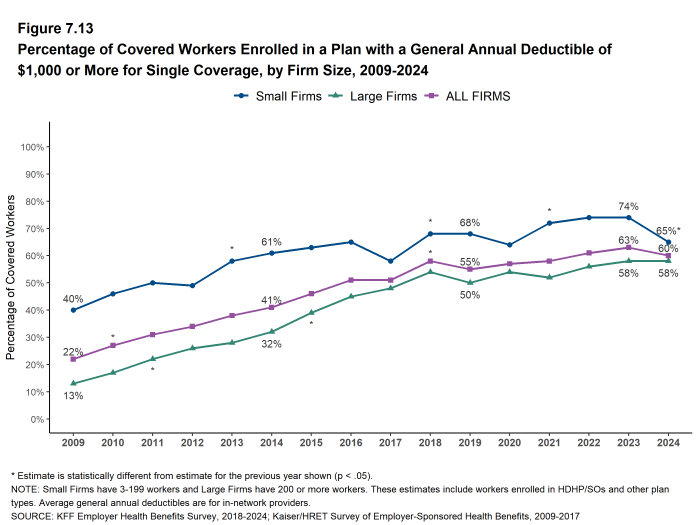
Figure 7.13: Percentage of Covered Workers Enrolled in a Plan With a General Annual Deductible of $1,000 or More for Single Coverage, by Firm Size, 2009-2024
GENERAL ANNUAL DEDUCTIBLES AND ACCOUNT CONTRIBUTIONS
- One of the reasons for the growth in general annual deductibles is the growth in enrollment in HDHP/SOs, which have higher deductibles than other plans. While having a higher deductible in other plan types generally increases enrollee out-of-pocket liability, the shift in enrollment to HDHP/SOs does not necessarily do so, because many HDHP/SO enrollees receive an account contribution from their employers, reducing the higher cost-sharing in these plans.
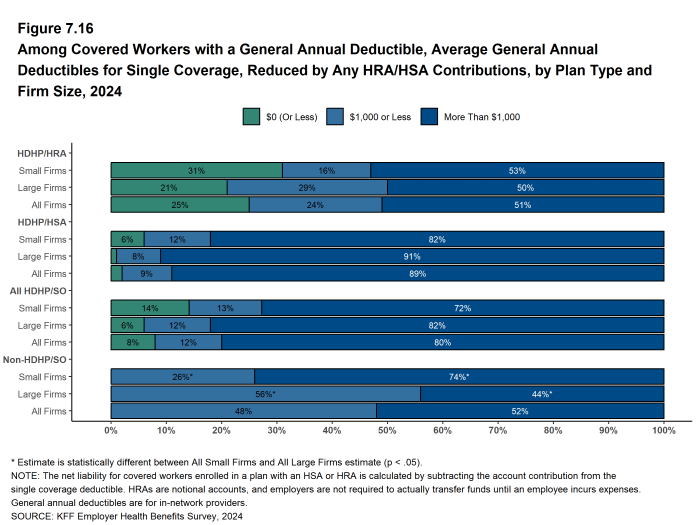
- Twenty-five percent of covered workers in an HDHP with an HRA and 2% of covered workers in an HSA-qualified HDHP receive an account contribution from their employer for single coverage that is at least equal to their deductible. Another 24% of covered workers in an HDHP with an HRA and 9% of covered workers in an HSA-qualified HDHP receive account contributions that, if applied to their deductible, would reduce the deductible to $1,000 or less [Figure 7.16].
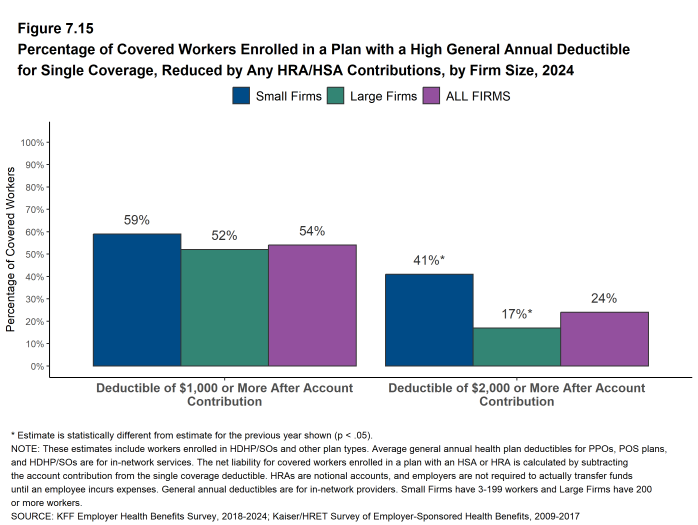
- If we subtract employer account contributions from the general annual deductibles, the percent of covered workers with a deductible of $1,000 or more would be reduced from 60% to 54% [Figure 7.13] and [Figure 7.15].
Figure 7.15: Percentage of Covered Workers Enrolled in a Plan With a High General Annual Deductible for Single Coverage, Reduced by Any HRA/HSA Contributions, by Firm Size, 2024
Figure 7.16: Among Covered Workers With a General Annual Deductible, Average General Annual Deductibles for Single Coverage, Reduced by Any HRA/HSA Contributions, by Plan Type and Firm Size, 2024
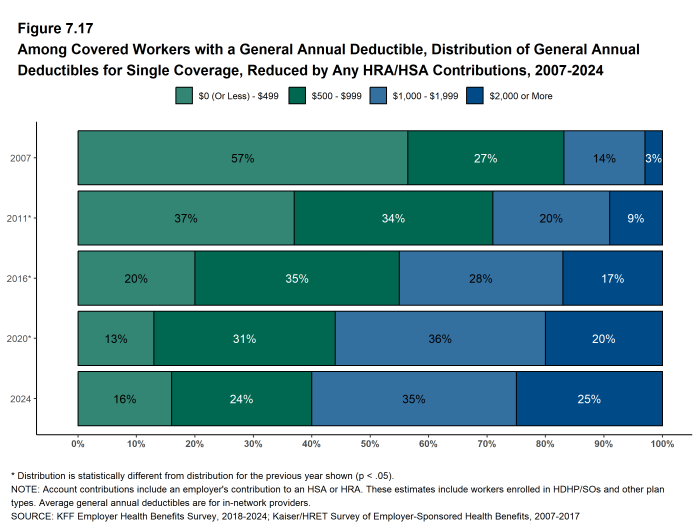
Figure 7.17: Among Covered Workers With a General Annual Deductible, Distribution of General Annual Deductibles for Single Coverage, Reduced by Any HRA/HSA Contributions, 2007-2024
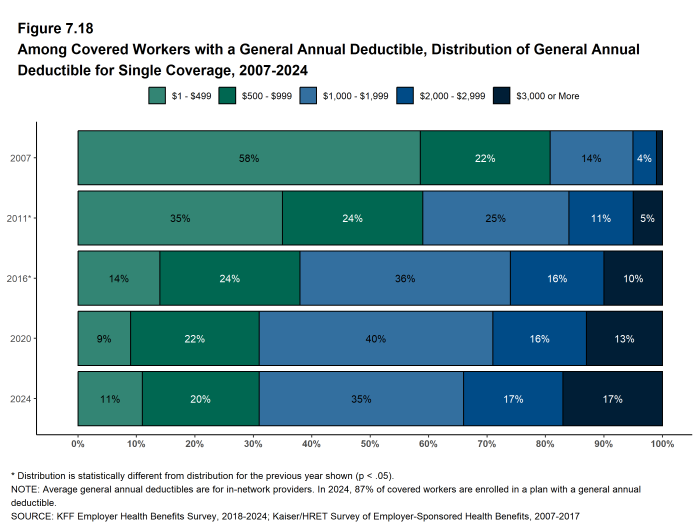
Figure 7.18: Among Covered Workers With a General Annual Deductible, Distribution of General Annual Deductible for Single Coverage, 2007-2024
GENERAL ANNUAL DEDUCTIBLES FOR WORKERS ENROLLED IN FAMILY COVERAGE
General annual deductibles for family coverage are structured in two primary ways: (1) an aggregate family deductible, where the out-of-pocket expenses of all family members count against a specified family deductible amount and where the deductible is considered met when the combined family expenses exceed the deductible amount, or (2) a separate per-person family deductible, where each family member is subject to a specified deductible amount before the plan covers expenses for that member. However, many plans with a per-person deductible consider the deductible for all family members met once a certain number of family members (typically two or three) meet their specified deductible amount.14
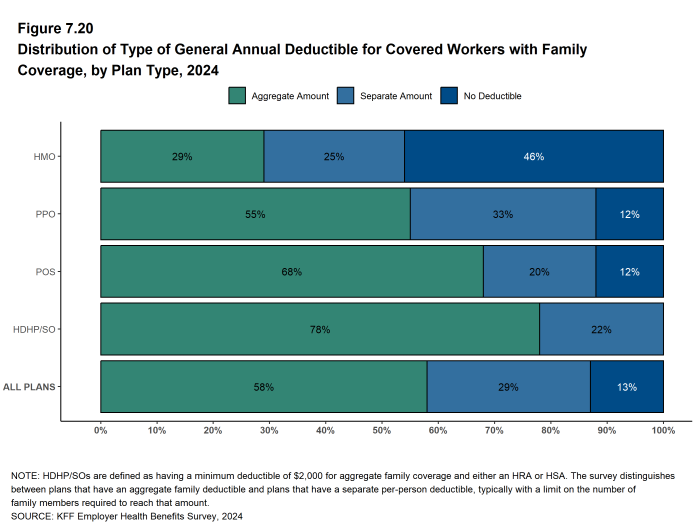
- Forty-six percent of covered workers in HMOs are in plans without a general annual deductible for family coverage. The percent of workers in plans without family deductibles is lower for workers in PPOs (12%) and POS plans (12%). As defined, all covered workers in HDHP/SOs have a general annual deductible for family coverage [Figure 7.20].
- Among covered workers enrolled in family coverage, the percent of covered workers in a plan with an aggregate general annual deductible is 29% for workers in HMOs, 55% for workers in PPOs, 68% for workers in POS plans, and 78% for workers in HDHP/SOs [Figure 7.20].
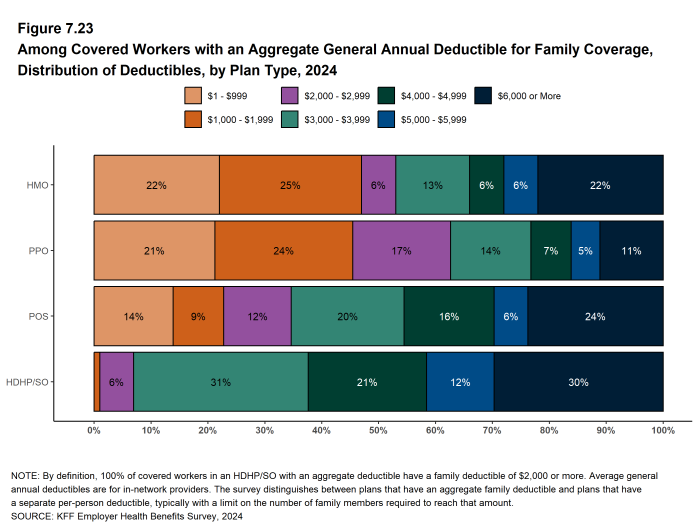
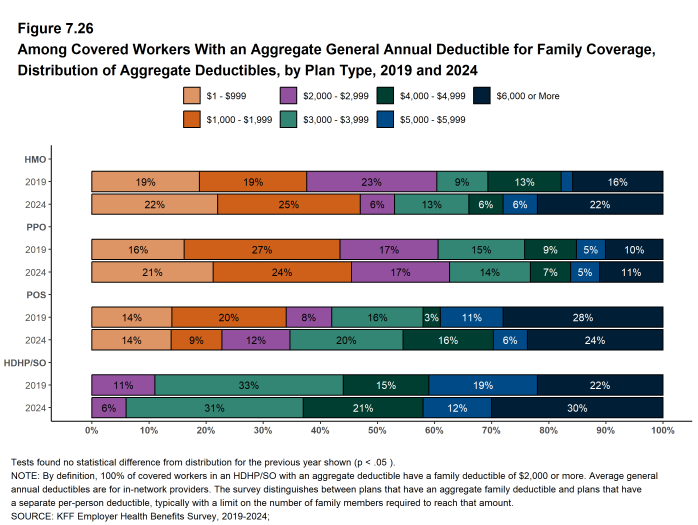
- The average deductible amounts for covered workers in plans with an aggregate annual deductible for family coverage are $3,777 for HMOs, $2,770 for PPOs, $4,217 for POS plans, and $4,991 for HDHP/SOs [Figure 7.21]. The average deductible amounts for aggregate family deductibles are similar to last year for each plan type.
- For covered workers in plans with an aggregate deductible for family coverage, the average annual family deductibles at small firms are higher than at large firms for covered workers in PPOs, HMO plans, and HDHP/SOs [Figure 7.21].
- Among workers enrolled in family coverage, the percent of workers in plans with a separate per-person annual deductible for family coverage is 25% for workers in HMOs, 33% for workers in PPOs, 20% for workers in POS plans, and 22% for workers in HDHP/SOs [Figure 7.20].
- The average deductible amounts for covered workers in plans with separate per-person annual deductibles for family coverage are $1,635 for PPOs, and $4,055 for HDHP/SOs [Figure 7.21].
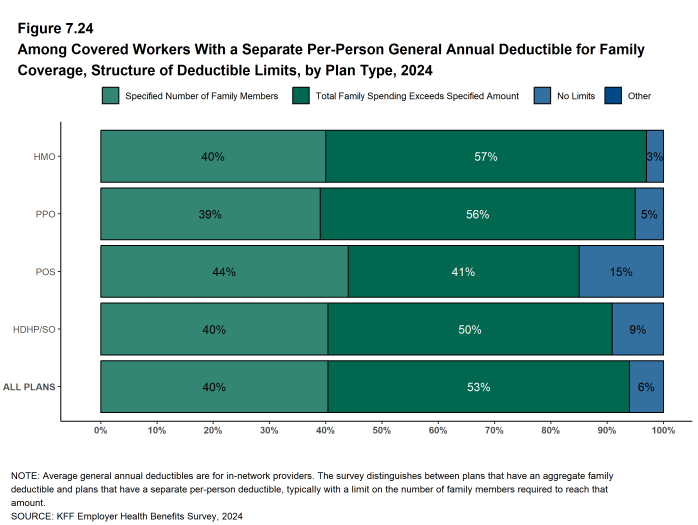
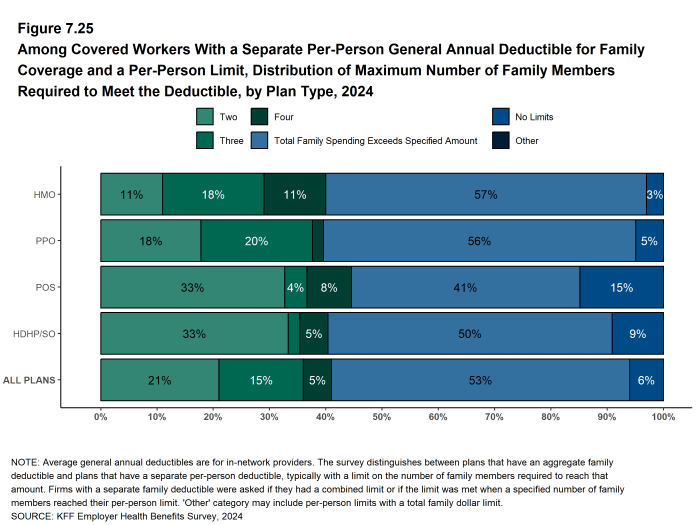
- Forty percent of covered workers in plans with a separate per-person annual deductible for family coverage have a limit for the number of family members required to meet the separate deductible amounts [Figure 7.24]. Among those covered workers, the most frequent number of family members who are required to meet the separate per-person deductible is two [Figure 7.25].
Figure 7.20: Distribution of Type of General Annual Deductible for Covered Workers With Family Coverage, by Plan Type, 2024
Figure 7.21: Among Covered Workers With a General Annual Deductible, Average Deductibles for Family Coverage, by Deductible Type, Plan Type, and Firm Size, 2024
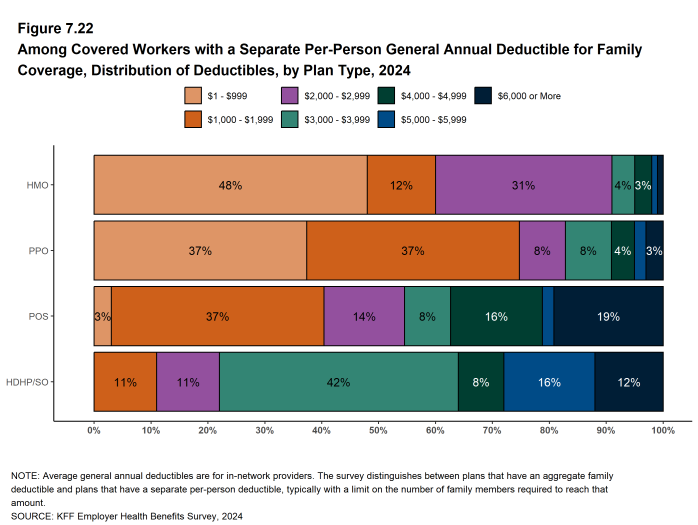
Figure 7.22: Among Covered Workers With a Separate Per-Person General Annual Deductible for Family Coverage, Distribution of Deductibles, by Plan Type, 2024
Figure 7.23: Among Covered Workers With an Aggregate General Annual Deductible for Family Coverage, Distribution of Deductibles, by Plan Type, 2024
Figure 7.24: Among Covered Workers With a Separate Per-Person General Annual Deductible for Family Coverage, Structure of Deductible Limits, by Plan Type, 2024
Figure 7.25: Among Covered Workers With a Separate Per-Person General Annual Deductible for Family Coverage and a Per-Person Limit, Distribution of Maximum Number of Family Members Required to Meet the Deductible, by Plan Type, 2024
COVERAGE OF SERVICES AND PRODUCTS BEFORE MEETING THE GENERAL ANNUAL DEDUCTIBLES
- The majority of covered workers with a general annual deductible are enrolled in plans where the deductible does not have to be met before certain services, such as physician office visits or prescription drugs, are covered. Covered workers in HSA qualified HDHP/SOs are not included in these estimates, because HSA-qualified plans generally only pay for preventive services before the deductible is met.
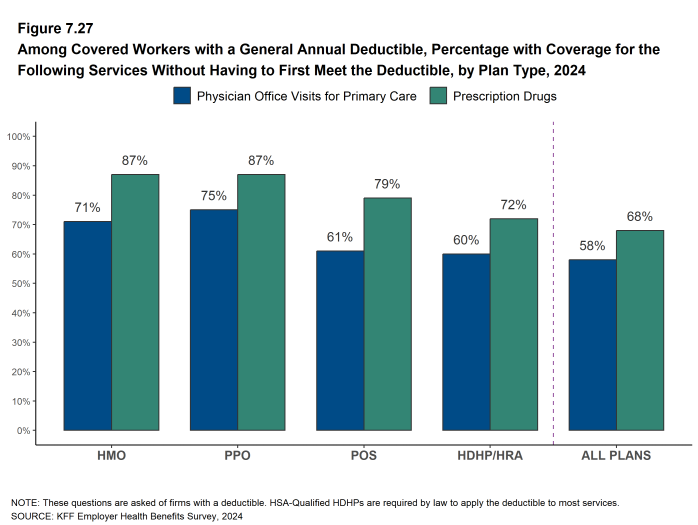
- Among covered workers enrolled in a plan with a general annual deductible, large shares (71% in HMOs, 75% in PPOs, 61% in POS plans, and 60% in HDHP/HRAs) are enrolled in plans where the deductible does not have to be met before physician office visits for primary care are covered [Figure 7.27].
- Similarly, among covered workers enrolled in a plan with a general annual deductible, large shares (87% in HMOs, 87% in PPOs, 79% in POS plans, and 72% in HPHD/HRAs) do not have to meet the general annual deductible before prescription drugs are covered [Figure 7.27].
HOSPITAL ADMISSIONS AND OUTPATIENT SURGERY
- Whether or not a worker has a general annual deductible, most workers face additional types of cost-sharing (such as a copayment, coinsurance, or a per diem charge) when admitted to a hospital or having outpatient surgery. The distribution of workers with cost-sharing for hospital admissions or outpatient surgery does not equal 100%, as workers may face a complex combination of types of cost-sharing. For this reason, the average copayment and coinsurance rates include workers who may have a combination of these cost-sharing methods. Coinsurance, in particular, may include minimums or maximums which affect an enrollee’s liability. We report the distribution of cost-sharing for covered workers enrolled in a plan which covers hospital admissions and outpatient surgery, respectively. A small share of respondents indicate that they have an “other” type of cost-sharing arrangement.
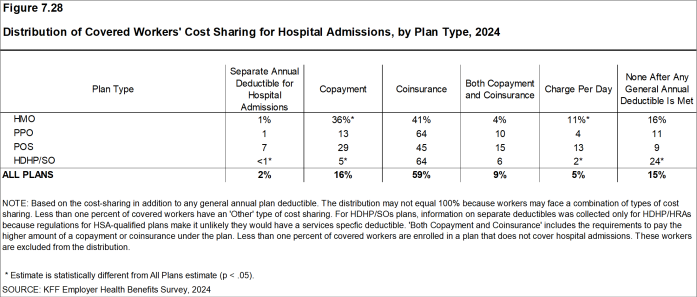
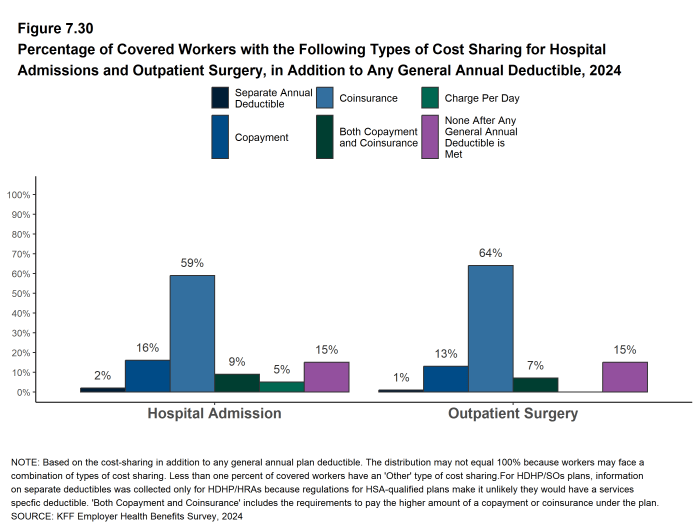
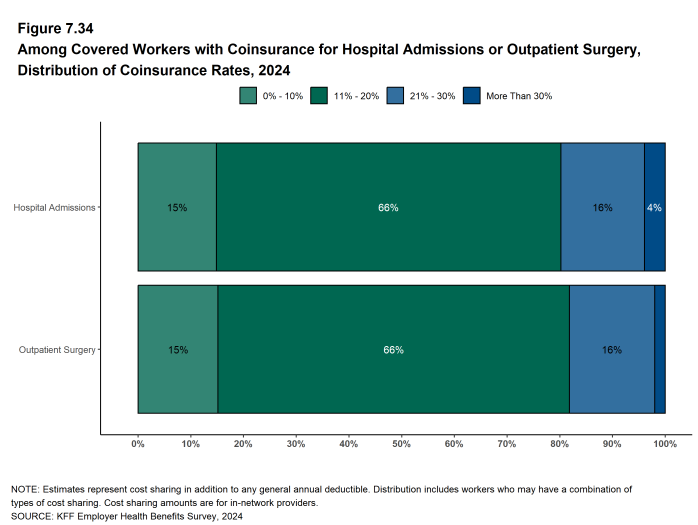
- In addition to any general annual deductible that may apply, 59% of covered workers have coinsurance and 16% have a copayment that applies to inpatient hospital admissions. A lower percentage of covered workers have per-day (per diem) payments (5%), a separate hospital deductible (2%), or both a copayment and coinsurance (9%). Fifteen percent of covered workers have no additional cost-sharing for hospital admissions after any general annual deductible has been met [Figure 7.28]. Covered workers with both a copay and coinsurance may be required to pay both or whichever is greater.
- On average, covered workers in HMO plans are more likely than workers in other plan types to have a copayment for hospital admissions, while workers in HDHP/SOs are less likely [Figure 7.28].
- The average coinsurance rate for a hospital admission is 21%, the average copayment is $343 per hospital admission, and the average per diem charge is $369 [Figure 7.31]. Seventy-two percent of workers enrolled in a plan with a per diem for hospital admissions have a limit on the number of days for which a worker must pay the cost-sharing amount [Figure 7.32].
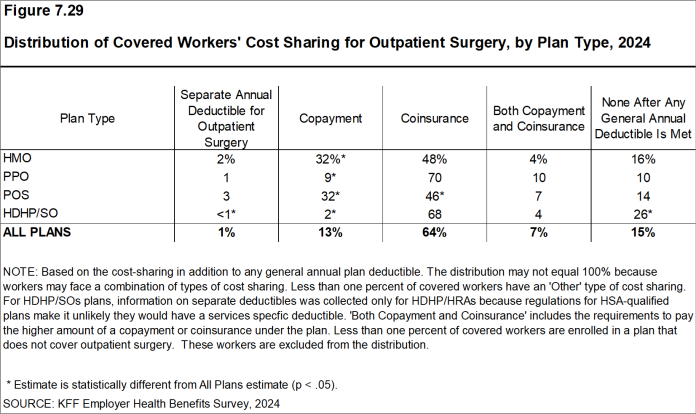
- The cost-sharing provisions for outpatient surgery are similar to those for hospital admissions, as most workers have coinsurance or copayments. In 2024, 13% of covered workers have a copayment and 64% have a coinsurance rate for outpatient surgery. In addition, 7% have both a copayment and a coinsurance rate, while 15% have no additional cost-sharing after any general annual deductible has been met [Figure 7.29] and [Figure 7.30].
- For covered workers with cost-sharing for outpatient surgery, the average coinsurance rate is 20% and the average copayment is $216 [Figure 7.31].
Figure 7.28: Distribution of Covered Workers’ Cost Sharing for Hospital Admissions, by Plan Type, 2024
Figure 7.29: Distribution of Covered Workers’ Cost Sharing for Outpatient Surgery, by Plan Type, 2024
Figure 7.30: Percentage of Covered Workers With the Following Types of Cost Sharing for Hospital Admissions and Outpatient Surgery, in Addition to Any General Annual Deductible, 2024
Figure 7.31: Among Covered Workers With Separate Cost Sharing for Hospital Admissions or Outpatient Surgery, Average Cost Sharing, by Type, 2024
Figure 7.32: Among Covered Workers With a Charge Per Day for Hospital Admissions, Average Cost Sharing Features, 2024
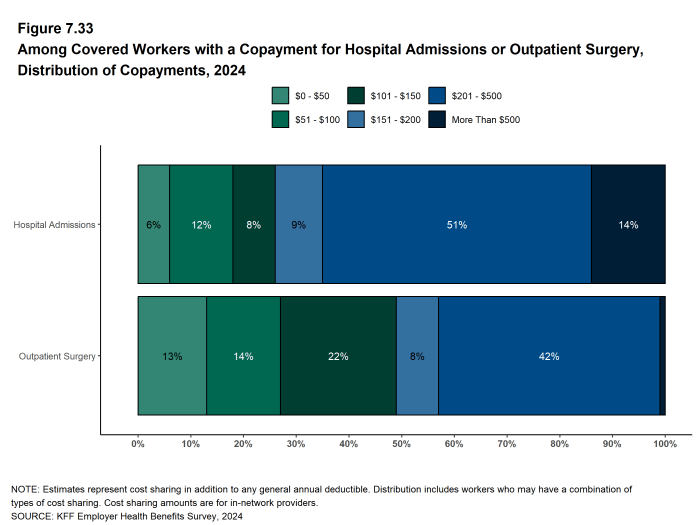
Figure 7.33: Among Covered Workers With a Copayment for Hospital Admissions or Outpatient Surgery, Distribution of Copayments, 2024
COST-SHARING FOR PHYSICIAN OFFICE VISITS
- The majority of covered workers are enrolled in health plans that require cost-sharing for an in-network physician office visit, in addition to any general annual deductible.15
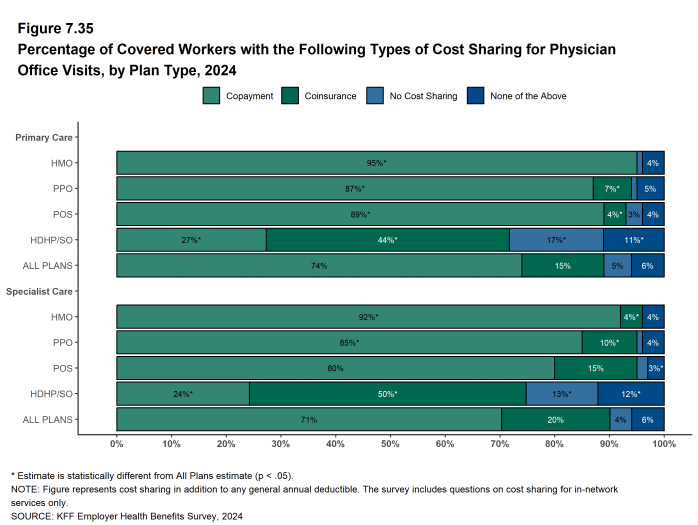
- The most common form of cost-sharing for an in-network physician office visit is a copayment. Seventy-four percent of covered workers have a copayment for a primary care physician office visit and 15% have coinsurance. For office visits with a specialty physician, 71% of covered workers have a copayment and 20% have coinsurance [Figure 7.35].
- The share of covered workers with coinsurance for office visits with a specialty physician in 2024 is lower than the percentage five years ago (20% vs. 26%).
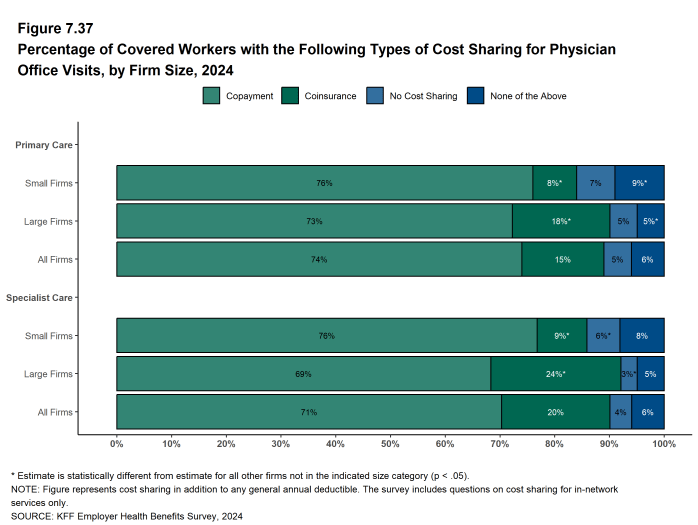
- The form of cost-sharing for physician office visits varies by firm size. Covered workers at small firms are less likely to have coinsurance than workers at large firms for in-network primary care office visits (8% vs. 18%), and for in-network office visits with specialists (9% vs. 24%) [Figure 7.37].
- Covered workers in HMOs, PPOs, and POS plans are much more likely to have copayments for both primary care and specialty care physician office visits than workers in HDHP/SOs. For primary care physician office visits, 27% of covered workers in HDHP/SOs have a copayment, 44% have coinsurance, and 17% have no cost-sharing after the general annual plan deductible is met [Figure 7.35].
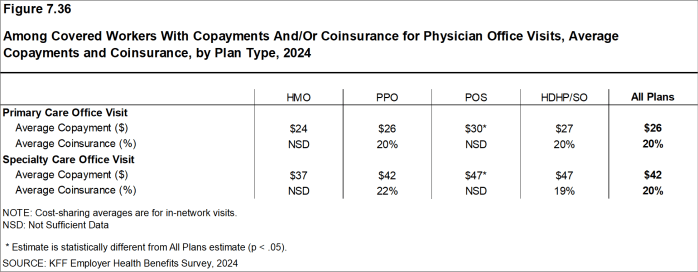
- Among covered workers with a copayment for in-network physician office visits, the average copayment for primary care physician office visits is $26, the same as average copayment last year ($26) [Figure 7.36].
- Among covered workers with a copayment for in-network physician office visits, the average copayment for specialty physician office visits is $42, similar to the amount last year ($44) [Figure 7.36].
- For covered workers with a copayment for physician office visits, average copayment amounts are higher for workers at small firms than those at large firms for both primary care physician office visits ($28 vs. $25) and specialty physician office visits ($48 vs. $40).
- Among covered workers with coinsurance for in-network physician office visits, the average coinsurance rates are 20% for a visit with a primary care physician and 20% for a visit with a specialist, similar to the rates last year [Figure 7.36].
Figure 7.35: Percentage of Covered Workers With the Following Types of Cost Sharing for Physician Office Visits, by Plan Type, 2024
Figure 7.36: Among Covered Workers With Copayments And/Or Coinsurance for Physician Office Visits, Average Copayments and Coinsurance, by Plan Type, 2024
Figure 7.37: Percentage of Covered Workers With the Following Types of Cost Sharing for Physician Office Visits, by Firm Size, 2024
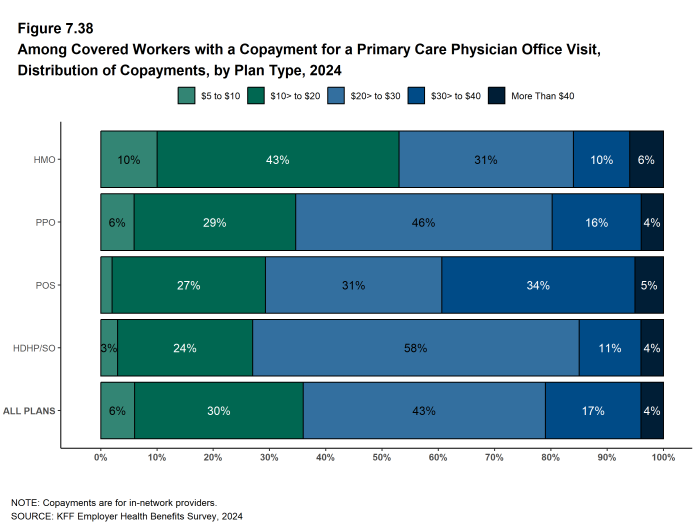
Figure 7.38: Among Covered Workers With a Copayment for a Primary Care Physician Office Visit, Distribution of Copayments, by Plan Type, 2024
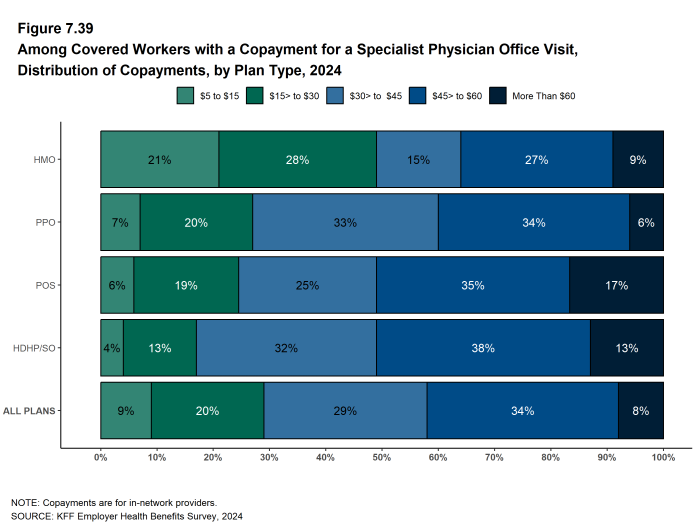
Figure 7.39: Among Covered Workers With a Copayment for a Specialist Physician Office Visit, Distribution of Copayments, by Plan Type, 2024
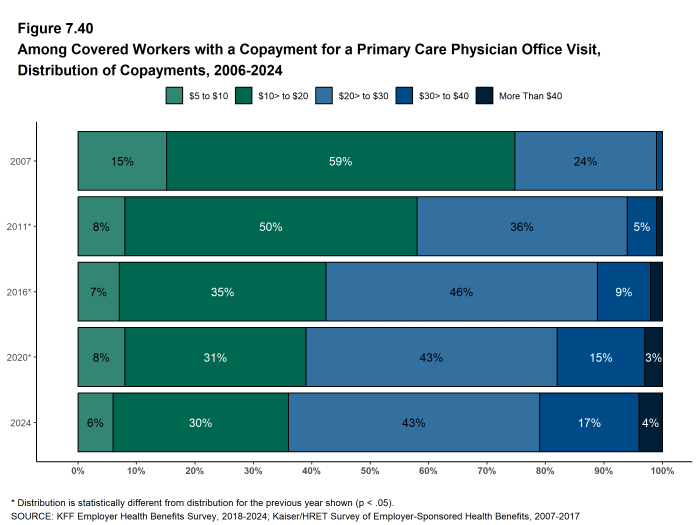
Figure 7.40: Among Covered Workers With a Copayment for a Primary Care Physician Office Visit, Distribution of Copayments, 2006-2024
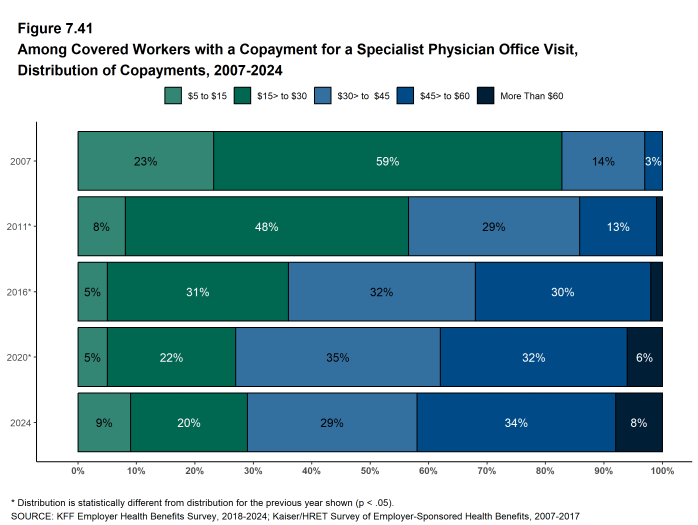
Figure 7.41: Among Covered Workers With a Copayment for a Specialist Physician Office Visit, Distribution of Copayments, 2007-2024
OUT-OF-POCKET MAXIMUMS
- Virtually all covered workers are in a plan that either partially or totally limits the cost-sharing that enrollees must pay in a year. This limit is generally referred to as an out-of-pocket maximum. The Affordable Care Act (ACA) requires that non-grandfathered health plans have an annual out-of-pocket maximum of no more than $9,450 for single coverage and $18,900 for family coverage in 2024. Out-of-pocket limits in HSA qualified HDHP/SOs are required to be somewhat lower.16 Many plans have complex out-of-pocket structures, which makes it difficult to accurately collect information on this element of plan design.
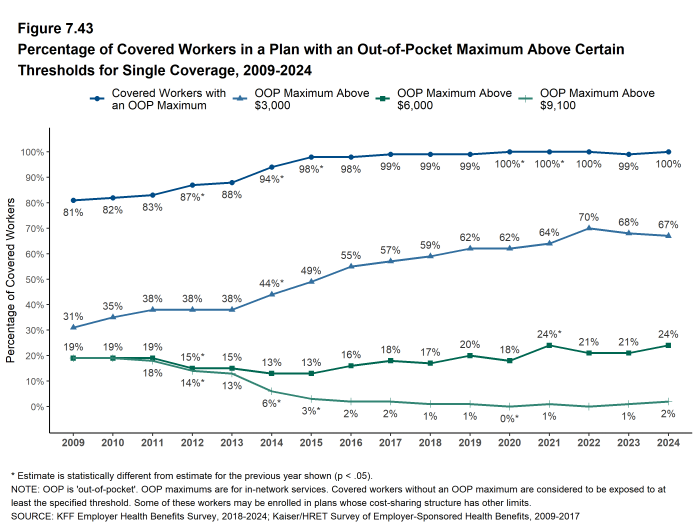
- In 2024, more than 99% of covered workers are in a plan that has an out-of-pocket maximum for single coverage [Figure 7.43].
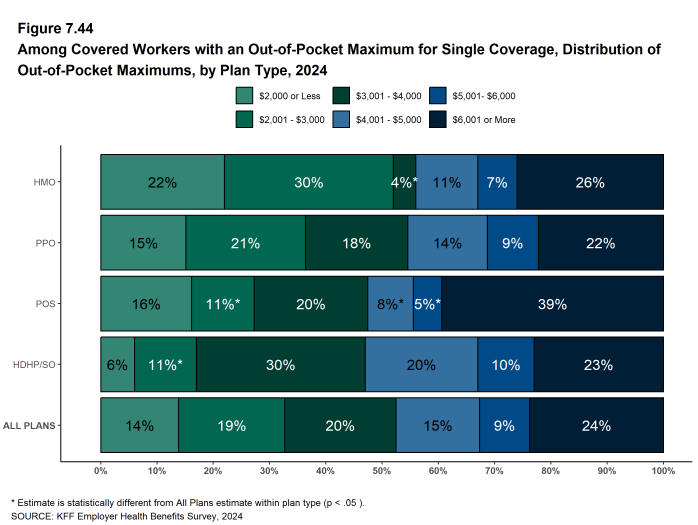
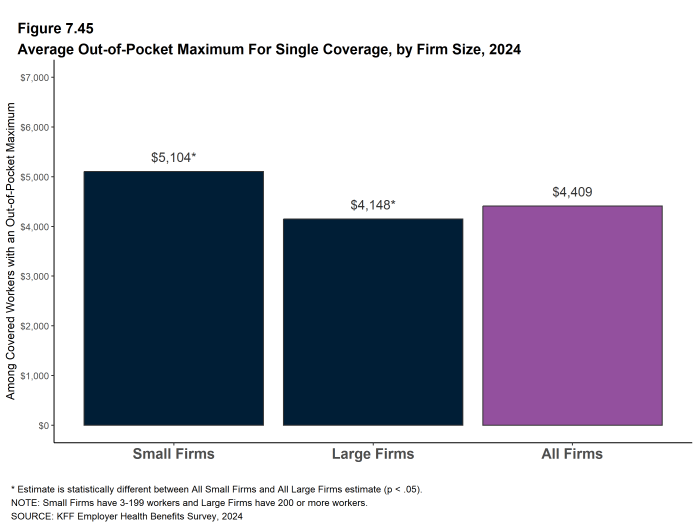
- For covered workers in plans with an out-of-pocket maximum for single coverage, there is wide variation in spending limits [Figure 7.44].
- Fourteen percent of covered workers in plans with an out-of-pocket maximum have an out-of-pocket maximum of $2,000 or less for single coverage, while 24% of these workers have an out-of-pocket maximum above $6,000 [Figure 7.44].
Figure 7.43: Percentage of Covered Workers in a Plan With an Out-Of-Pocket Maximum Above Certain Thresholds for Single Coverage, 2009-2024
Figure 7.44: Among Covered Workers With an Out-Of-Pocket Maximum for Single Coverage, Distribution of Out-Of-Pocket Maximums, by Plan Type, 2024
- Some workers with separate per-person deductibles or out-of-pocket maximums for family coverage do not have a specific number of family members that are required to meet the deductible amount and instead have another type of limit, such as a per-person amount with a total dollar amount limit. These responses are included in the averages and distributions for separate family deductibles and out-of-pocket maximums.↩︎
- Starting in 2010, the survey asked about the prevalence and cost of physician office visits separately for primary care and specialty care. Prior to the 2010 survey, if the respondent indicated the plan had a copayment for office visits, we assumed the plan had a copayment for both primary and specialty care visits. The survey did not allow for a respondent to report that a plan had a copayment for primary care visits and coinsurance for visits with a specialist physician. The changes made in 2010 allow for variations in the type of cost-sharing for primary care and specialty care visits. The survey includes cost-sharing for in-network services only.↩︎
- For those enrolled in an HDHP/HSA, the out-of-pocket maximum may be no more than $8,050 for an individual plan and $16,100 for a family plan in 2024.↩︎

