2023 Employer Health Benefits Survey
Employer-sponsored insurance covers almost 153 million nonelderly people1. To provide a current snapshot of employer-sponsored health benefits, KFF conducts an annual survey of private and non-federal public employers with three or more workers. This is the 25th Employer Health Benefits Survey (EHBS) and reflects employer-sponsored health benefits in 2023. The survey was fielded from January to July of 2023.
PLAN ENROLLMENT
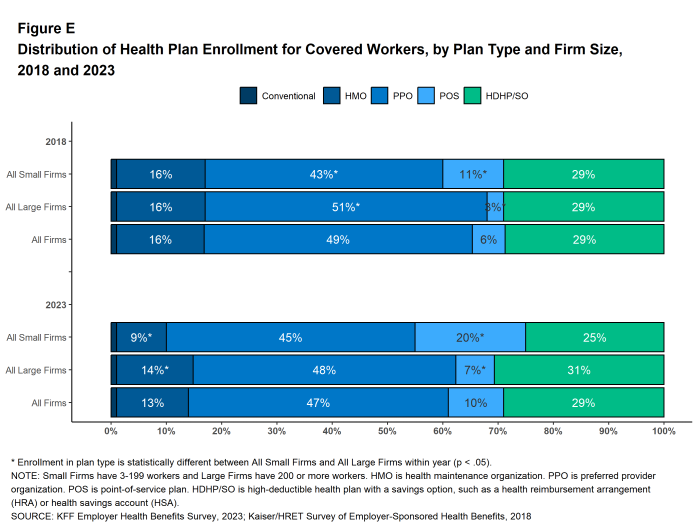
PPOs remain the most common plan type. In 2023, 47% of covered workers are enrolled in a PPO, 29% in a high-deductible plan with a savings option (HDHP/SO), 13% in an HMO, 10% in a POS plan, and 1% in a conventional (also known as an indemnity) plan [Figure E]. This distribution of covered workers across plan types is similar to the distributions of covered workers by plan type in recent years.
SELF FUNDING
Many firms – particularly larger firms – self-fund, which means that they pay for the health services for their workers directly from their own funds rather than through the purchase of health insurance. Sixty-five percent of covered workers, including 18% of covered workers at small firms and 83% at large firms are enrolled in plans that are self-funded. The percentage of covered workers in self-funded plans in 2023 is similar to last year.
Thirty-four percent of small firms offering health benefits report that they have a level-funded plan, similar to the percentage in 2022. Level-funded arrangements combine a relatively small self-funded component with stop-loss insurance, which limits the employer’s liability and transfers a substantial share of the risk to insurers. These plans have the potential to meaningfully affect competition in the small group market because, unlike insured plans, they use health status as a factor in rating and underwriting and are not required to provide all of the essential health benefits that are mandatory for other plans.
.
EMPLOYEE COST SHARING
Ninety percent of workers with single coverage have a general annual deductible that must be met before most services are paid for by the plan, similar to the percentage last year (88%).
The average deductible amount in 2023 for workers with single coverage and a general annual deductible is $1,735, similar to last year. The average deductible for covered workers is much higher at small firms than large firms ($2,434 vs. $1,478). Among workers with single coverage and any deductible, the average deductible amount has increased 10% over the last five years and 53% over the last ten years.
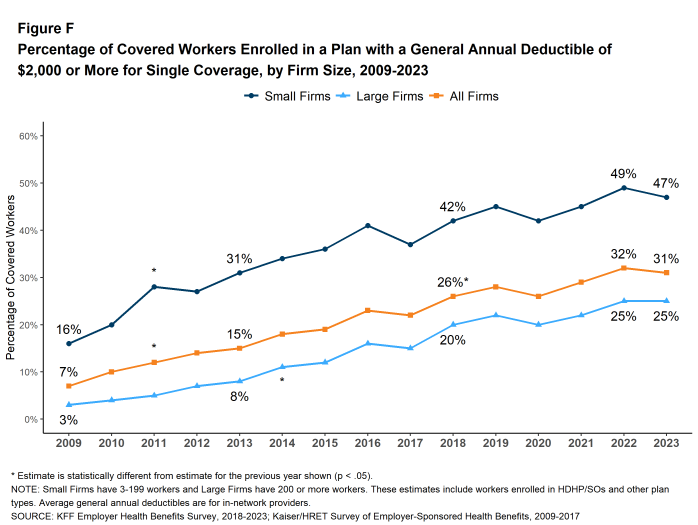
In 2023, among workers with single coverage, 47% of workers at small firms and 25% of workers at large firms have a general annual deductible of $2,000 or more. Over the last five years, the percentage of covered workers with a general annual deductible of $2,000 or more for single coverage has grown from 26% to 31% [Figure F].
Some workers in health plans with high deductibles also receive contributions to savings accounts from their employers. These contributions can be used to reduce cost sharing amounts. Seven percent of covered workers in an HDHP with a Health Reimbursement Arrangement (HRA), and 4% of covered workers in a Health Savings Account (HSA)-qualified HDHP receive an account contribution for single coverage that is greater than or equal to their deductible amount. Additionally, 34% of covered workers in an HDHP with an HRA and 12% of covered workers in an HSA-qualified HDHP receive account contributions that, if applied to their deductible, would reduce their personal annual liability to less than $1,000.
Regardless of their plan deductible, most covered workers also pay a portion of the cost for a physician office visit. Many covered workers face a copayment (a fixed dollar amount) when they visit a doctor, but some workers have coinsurance requirements (a percentage of the covered amount) instead. The average copayments are $26 for primary care and $44 for specialty care physician appointments, and average coinsurance rates are 19% for primary care and 20% for specialty care. These amounts are similar to 2022.
Most workers also face additional cost sharing for a hospital admission or outpatient surgery. Sixty-three percent of covered workers have coinsurance requirements, 10% have a copayment and 8% have both a copayment and coinsurance for hospital admissions. The average coinsurance rate for a hospital admission is 20% and the average copayment amount is $404. The cost sharing requirements for outpatient surgery follow a similar pattern to those for hospital admissions. However, the average copayment amount for outpatient surgery is lower, at $208.
Over nine in ten (93%) covered workers face cost sharing for emergency room visits in addition to any general annual deductible in 2023. Among these covered workers, 47% have a copay for an ER visit, 26% have a coinsurance requirement and 20% have both a copay and coinsurance requirement or whichever is greater. The average copayment amount for an emergency room visit is $217 and the average coinsurance amount is 21%. The average copayment and coinsurance amounts are both higher for small firms than for large firms.
Virtually all covered workers are in plans with an annual limit on in-network cost sharing (called an out-of-pocket maximum) for single coverage, though these limits vary significantly. Among covered workers in plans with an out-of-pocket maximum for single coverage, 13% are in a plan with an out-of-pocket limit of $2,000 or less, while 21% are in a plan with a limit of $6,001 or more.
AVAILABILITY OF EMPLOYER-SPONSORED COVERAGE
While nearly all large firms (firms with 200 or more workers) offer health benefits to at least some workers, small firms (3-199 workers) are significantly less likely to do so. In 2023, 53% of all firms offered some health benefits, similar to the percentage last year (51%).
Most firms are very small, leading to fluctuations in the overall offer rate, as the offer rates of small firms can vary widely from year to year. Most workers, however, work for larger firms, where the offer rates are high and much more stable. Over ninety percent (94%) of firms with 50 or more workers offer health benefits in 2023. This percentage has remained consistent over the last 10 years. Overall, 91% of workers employed at firms with 3 or more workers are employed at a firm that offers health benefits to at least some of its workers.
Although the vast majority of workers are employed by firms that offer health benefits, many workers are not covered by their employers. Some are not eligible to enroll (due to factors such as waiting periods or part-time or temporary work status), while others who are eligible choose not to enroll (they may feel the coverage is too expensive, or they may be covered through another source). Overall, at firms that offer coverage, an average of 79% of workers are eligible. Among eligible workers, 75% take up the firm’s offer. Ultimately, 59% of workers at firms that offer health benefits are enrolled in coverage. All of these percentages are similar to those in 2022.
Among workers at firms offering health benefits, those at firms with a relatively large share of lower-wage workers are less likely to be covered by their own firm than workers at firms with a smaller share of lower-wage workers (42% vs. 61%)3. Similarly, workers at firms with a relatively large share of higher-wage workers are more likely to be covered by their employer’s health benefits than those at firms with a smaller share of higher-wage workers (67% vs. 53%). The share of workers employed at public organizations covered by their own employer (72%) is higher than the shares of workers employed at private for-profit firms (57%) or private non-for-profit firms (57%) covered at their work.
Across firms that offer health benefits and firms that do not, 53% of all workers are covered by health plans offered by their employer. This is similar to the percentage last year.
.
HEALTH PROMOTION AND WELLNESS PROGRAMS
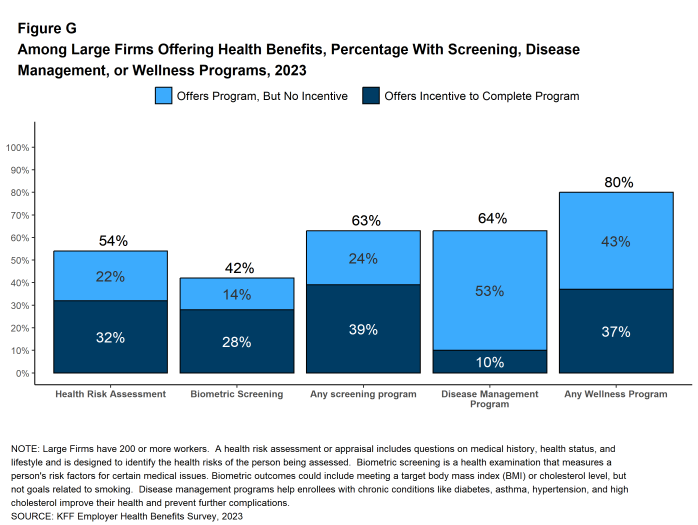
Many firms have programs that help workers identify health issues and manage chronic conditions. These programs include health risk assessments, biometric screenings, and health promotion programs [Figure G].
Health Risk Assessments. Among firms offering health benefits, 36% of small firms and 54% of large firms provide workers the opportunity to complete a health risk assessment, similar to the percentages last year. Among large firms that offer a health risk assessment, 59% use incentives or penalties to encourage workers to complete the assessment, higher than the percentage (50%) in 2022.
Biometric Screenings. Among firms offering health benefits, 15% of small firms and 42% of large firms provide workers the opportunity to complete a biometric screening, similar to the percentages last year. Among large firms with a biometric screening program, 67% use incentives or penalties to encourage workers to complete the assessment. Although this is a larger share than last year (57%), it is not significantly different.
Figure G: Among Large Firms Offering Health Benefits, Percentage With Screening, Disease Management, or Wellness Programs, 2023
Health and Wellness Promotion Programs. Most firms offering health benefits offer programs to help workers identify and address health risks and unhealthy behaviors. Sixty-two percent of small firms and 80% of large firms offer a program in at least one of these areas: smoking cessation, weight management, and behavioral or lifestyle coaching. The percentage of both small firms and large firms offering one of these programs are similar to the percentages last year (54% and 85% respectively).
Disease Management Programs. Among firms that offer health benefits, 36% of small firms and 64% of large firms offer disease management programs. These programs aim to improve health and reduce costs for enrollees with certain chronic illnesses by educating them about their disease and suggesting treatment options.
.
EMPLOYER PERCEPTIONS OF ENROLLEE SATISFACTION
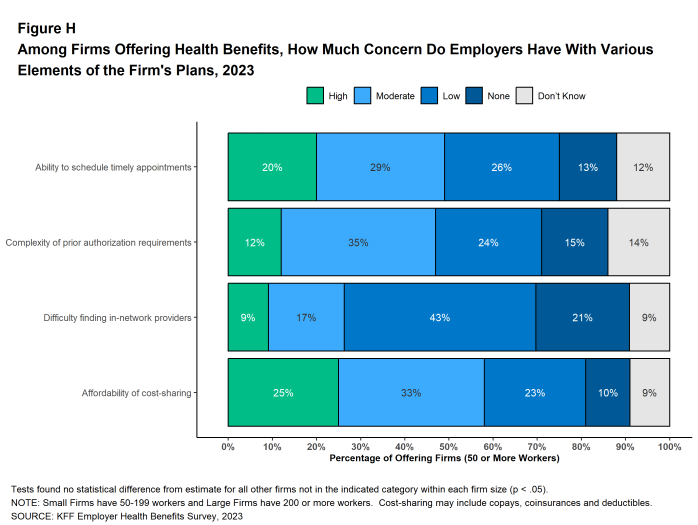
Employers use health benefits to attract and keep workers, making them an important part of the overall compensation that employers provide. Employers therefore have strong interest in assuring that their health benefit plans perform well and are viewed favorably by their workers. At the same time, health benefits are expensive. Therefore, employers manage plan costs within the broader context of the overall compensation they offer to their employees. Employers with 50 or more employees offering health benefits were asked about their views regarding the level of concern their employees had over certain aspects of their health benefit plans:
- Appointments – Twenty percent of these employers believe that their employees have a “high” level of concern about their ability to schedule timely appointments for care, and another 29% believe that their employees have a “moderate” level of concern.
- Prior Authorization – Twelve percent of these employers believe that their employees have a “high” level of concern about the complexity of prior authorization requirements in their health plan, and another 35% believe that their employees have a “moderate” level of concern.
- Finding In-Network Providers – Nine percent of these employers believe that their employees have a “high” level of concern about the difficulty of finding in-network providers, and another 17% believe that their employees have a “moderate” level of concern.
- Affordability of Cost Sharing – Twenty-five percent of these employers believe that their employees have a “high” level of concern about the affordability of cost sharing, and another 33% believe that their employees have a “moderate” level of concern.
HEALTH PLAN PROVIDER NETWORKS
Firms and health plans structure their networks of providers to ensure access to care, as well as to encourage enrollees to use providers who are lower cost or who provide better care. The breadth and composition of plan networks are key components in assuring timely access to necessary medical care for plan enrollees.
Narrow Networks Some employers offer a health plan with a relatively small, or narrow, network of providers. Narrow network plans reduce costs by limiting the number of providers that can participate, and generally are more restrictive than standard HMO networks. Nine percent of firms offering health benefits in 2023 report that they offer at least one plan that they considered to be a narrow network plan, the same as the percentage reported last year (9%). Firms with 1,000 to 4,999 workers and firms with 5,000 or more workers are more likely than smaller firms to offer at least one plan with a narrow network (14% and 18% respectively).
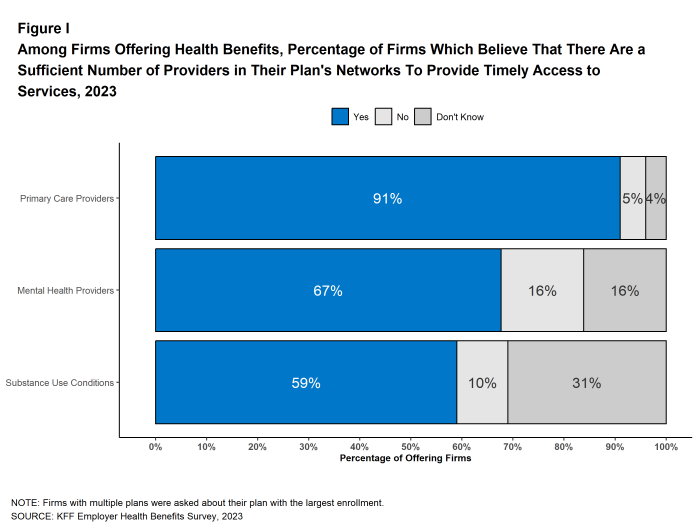
Timely Access to Care Over nine in ten (91%) firms offering health benefits say that there are a sufficient number primary care providers in the plan’s networks to provide timely access to services for workers and their family members. However, only 67% of firms that say there are a sufficient number of behavioral health providers and in the plan’s network to do this. Large firms are less likely than small firms to say that there are a sufficient number of providers to provide timely access to behavioral health services. Similarly, only 59% of firms offering health benefits say there are a sufficient number of providers who treat substance use conditions in the plan network to provide enrollees with timely access to substance use services.
In the past 12 months, 30% of firms with 1,000 to 4,999 workers and 44% of firms with 5,000 or more workers took steps to increase the number of mental health providers in their plan networks.
Provider Directories Firms with 50 or more workers offering health benefits generally are satisfied with the accuracy of plan provider directories, with 31% stating they are “very satisfied” and an additional 58% reporting being “satisfied” with their accuracy.
Centers of Excellence Some plans limit their coverage of designated services to care received from a group of providers participating in a “Center of Excellence” program, or provide preferential cost sharing for enrollees who do so. These programs select providers based on the cost and quality of the services they provide, and may limit in-network coverage for theses services to a smaller group of providers than participate in the provider network overall. Among large firms offering health benefits, 19% said that they offered a center of excellence program, including 45% of firms with 5,000 or more workers. Among these firms, 22% have introduced a new center of excellence program within the last two years.
Forty-five percent of large employers with a center of excellence program indicated they had program for joint replacement, followed by 42% for back or spine surgery, 31% for bariatric surgery, 30% for mental health conditions and 28% for substance use disorders.
TELEMEDICINE
Among firms with 50 or more workers offering health benefits, 91% cover the provision of some health care services through telemedicine in their largest health plan, similar to the previous year (90%). Large firms are more likely than small firms (50-199 workers) to cover telemedicine services (97% vs. 89%).
Among these firms, 20% use a specialized telemedicine service provider, such as Teledoc, Doctor on Demand, or MDLIVE, while 59% offer services through their health plan, 19% offer services through both a specialized telemedicine provider and their health plan, and 2% provide services through some other arrangement. Small firms are more likely than large firms to provide telemedicine services only through their health plan while large firms are more likely than small firms to provide telemedicine services through a specialized telemedicine provider, or through both their health plan and a specialized telemedicine provider.
With the effects of the pandemic waning, medical services are generally available on an in-person basis and many employees have partially or fully returned to their workplaces. With this context, we asked employers how important they felt telemedicine would be in providing care to employees going forward, both overall and for several specific types of services. Among firms with 50 or more enrollees offering health benefits:
- Overall – Twenty-eight percent of firms say that telemedicine will be “very important” in providing access to enrollees in the future, and another 32% of firms say that it will be “important.”
- Behavioral Health Services – Forty-one percent say that telemedicine will be “very important” in providing access to behavioral health services in the future, and another 30% say that it will be “important”. Larger firms (1,000 or more workers) are more likely than smaller firms to say that telemedicine will be “very important” to providing access to behavioral health services. (57% vs. 40%).
- Primary Care – Twenty-seven percent say that telemedicine will be “very important” in providing access to primary care in the future, and another 34% say that it will be “important” to providing access primary care.
- Specialty Care – Sixteen percent say that telemedicine will be “very important” in providing access to specialty care in the future, and another 30% say that it will be “important” to providing access to specialty care.
ABORTION SERVICES
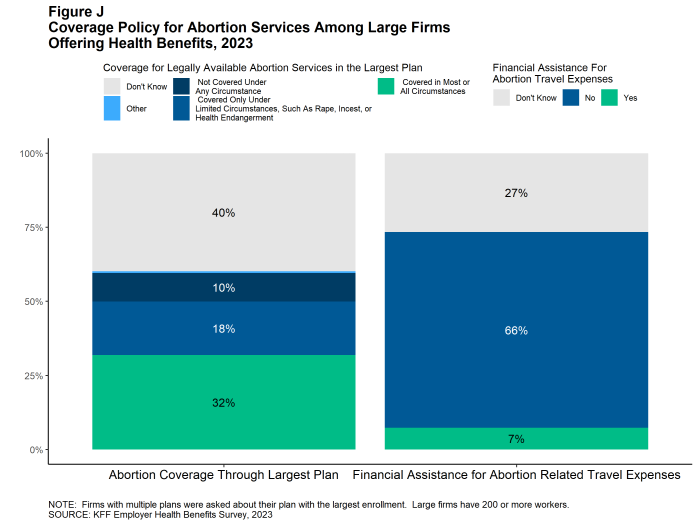
The United States Supreme Court decision in Dobbs vs. Jackson, overturning Roe v Wade, and subsequent state activity to regulate abortion has increased interest in coverage for abortion services in employer plans. We asked large employers (those with 200 or more workers) offering health benefits which of several statements best described the coverage of abortion services in their largest health plan.
- Thirty-two percent of these firms said that legally provided abortions are covered in most or all circumstances (sometimes referred to as elective or voluntary abortion). Firms with 5,000 or more workers were more likely than smaller firms to give this response (43%).
- Eighteen percent of these firms said that legally provided abortions are covered only under limited circumstances, such as rape, incest, or health or life endangerment of the pregnant enrollee. Firms with 5,000 or more workers were more likely than smaller firms to give this reply (30%).
- Ten percent of these firms said that legally provided abortions are not covered under any circumstance.
- Forty percent of responding firms answered “Don’t know” to this question. Respondents with 200 to 999 workers were more likely than other respondents to answer “Don’t know,” while respondents with 1,000 to 4,999 workers and 5,000 or more workers were less likely to do so.
Large firms also were asked if they or their health plan had taken certain actions related to coverage of abortion following the Supreme Court decision.
- Among firms that said they did not cover legally provided abortion services, or covered them only in limited circumstances, 3% reduced or eliminated coverage for abortion services in circumstances where they could be legally provided. Firms with 1,000 to 4,999 workers were more likely than larger or smaller firms to make this change (8%).
- Among firms that said legally provided abortion services were generally covered, 12% of these firms had added or significantly expanded coverage for abortion services in circumstances where they could be legally provided.
Seven percent of large firms offering health benefits currently provide or plan to provide financial assistance for travel expenses for enrollees who travel out of state to obtain an abortion if they do not have access near their home. Firms with 5,000 or more workers are more likely than other firms to say they provide or plan to provide travel benefits (19% vs. 7%).
DISCUSSION
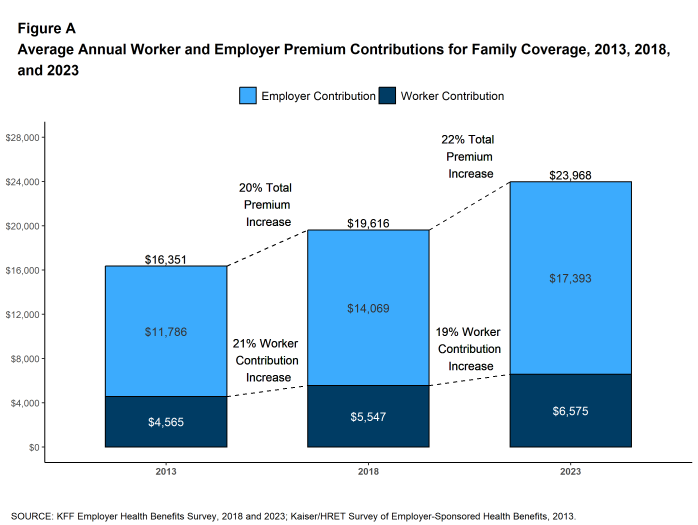
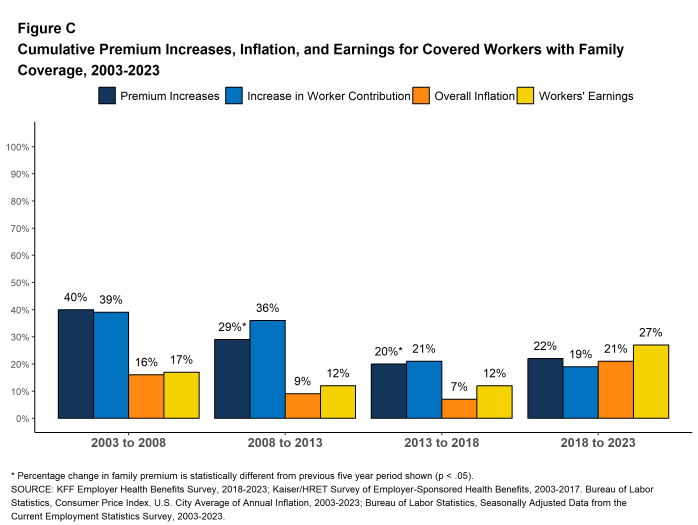
The average annual premiums for both single and family coverage increased 7% in 2023. This is a big change compared to last year, when there was not a statistically significant increase from the prior year, and suggests that the higher overall prices we have seen since 2022 in the rest of the economy have begun to affect premiums. Looking forward, both inflation and employer costs for labor are projected to moderate over the next two years4, although premiums may not reflect these underlying changes right away. Over the last five years, family premiums have grown 22%, roughly comparable to the rate of inflation (21%) and the change in wages (27%) over the period.
Compared to premiums, deductible amounts have been growing relatively slowly. The average deductible in 2023 for single coverage among those with a deductible ($1,735) is similar to the amount last year ($1,763) and only 10% higher than the amount five years ago. This relatively low growth may reflect employer concerns about the ability of workers to afford higher out-of-pocket costs, particularly for workers with lower wages. As noted above, 25% of employers with 50 or more employees believe that their employees have a high level of concern about the affordability of cost sharing, with another 33% believing that their employees have a moderate level of concern. Employers also may be reluctant to reduce the value and attractiveness of their coverage offerings during this long period of low unemployment and intense competition for labor.
Whether and how to cover abortion services have become pressing issues for employers. The U.S. Supreme Court’s decision in Dobbs v. Jackson, and subsequent state initiatives to restrict access to abortion services as well as coverage for those services, have created a complicated legal environment for employers, with potential civil or even criminal liability for providing coverage in some states or situations. Amid this backdrop, 32% of large firms (200 or more workers) said that they cover legally provided abortions in most or all circumstances, 18% said that legally provided abortions are covered only under limited circumstances, such as rape, incest, or health or life endangerment, and 10% said that legally provided abortions are not covered under any circumstance. A large share of respondents did not know the answer to this question or did not respond, perhaps reflecting the complexity of the issue and changing landscape of state laws.
The sufficiency of mental health providers in plan networks remains a concern for employers in 2023, with only 59% of large employers offering health benefits believing that there are a sufficient number of behavioral health providers in their plan’s network to provide timely access to services for workers and their family members. Among larger firms offering health benefits, 30% of firms with 1,000 to 4,999 workers and 44% of firms with 5,000 or more workers took steps within the past 12 months to increase the number of mental health providers in their plan networks.
.
METHODOLOGY
The KFF 2023 Employer Health Benefits Survey reports findings from a survey of 2,133 randomly selected non-federal public and private employers with three or more workers. Davis Research, LLC conducted the field work between January and July 2023. The overall response rate is 15%, which includes firms that offer and do not offer health benefits. Unless otherwise noted, differences referred to in the text and figures use the 0.05 confidence level as the threshold for significance. Small firms have 3-199 workers unless otherwise noted. Values below 3% are not shown on graphs to improve readability. Some distributions may not sum due to rounding. For more information survey methodology, see the Survey Design and Methods section at ehbs.kff.org.
KFF is the independent source for health policy research, polling, and journalism. Our mission is to serve as a nonpartisan source of information for policymakers, the media, the health policy community, and the public.
- Estimate from the KFF’s analysis of the 2021 American Community Survey. KFF. Health insurance coverage of the nonelderly 0–64 [Internet]. San Francisco (CA): KFF; 2021 [cited 2023 Aug 29]. Available from: https://www.kff.org/other/state-indicator/nonelderly-0-64↩︎
- Bureau of Labor Statistics. Consumer Price Index, U.S. City Average of Annual Inflation, 2013-2023 [Internet]. Washington (DC): BLS; [cited 2023 May 26]. Available from: https://data.bls.gov/timeseries/CUUR0000SA0
Seasonally adjusted data from the Current Employment Statistics Survey. Bureau of Labor Statistics. Employment, Hours, and Earnings from the Current Employment Statistics survey (National), 2013-2023 [Internet]. Washington (DC): BLS; [cited 2023 June 13]. Available from: https://data.bls.gov/timeseries/CES0500000008↩︎ - This threshold is based on the twenty-fifth percentile of workers’ earnings ($31,000 in 2023). Seasonally adjusted data from the Current Employment Statistics Survey. Bureau of Labor Statistics. Current Employment Statistics—CES (national) [Internet]. Washington (DC): BLS; [cited 2023 Oct 4]. Available from: https://www.bls.gov/ces/publications/highlights/highlights-archive.htm↩︎
- An Update to the Economic Outlook: 2023-2025. [Internet] Washington (DC): Congressional Budget Office; [cited 2023 July]. Available from: https://www.cbo.gov/publication/59431#_idTextAnchor010.↩︎

