2022 Employer Health Benefits Survey
Published:
Section 6: Worker and Employer Contributions for Premiums
The vast majority of covered workers make contributions towards the cost of thier coverage.
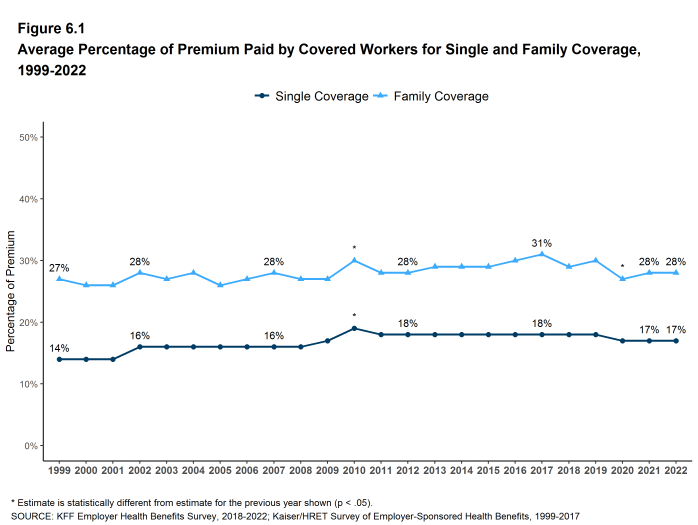
- In 2022, covered workers contribute, on average, 17% of the premium for single coverage and 28% of the premium for family coverage.
- The average percentages contributed for single and family coverage have remained stable in recent years [Figure 6.1].15
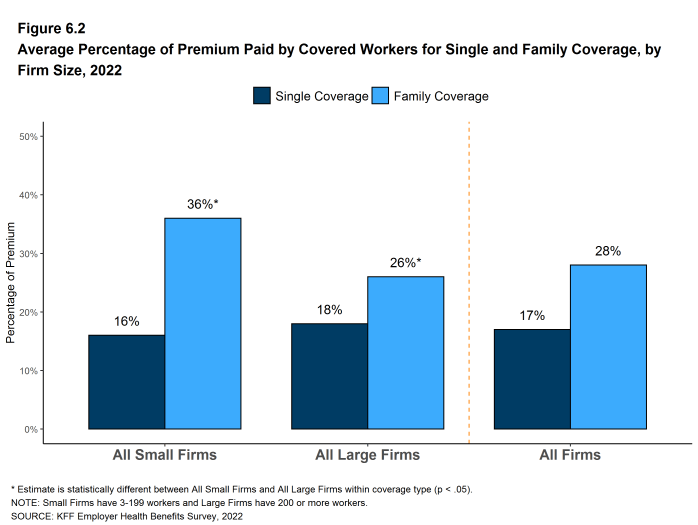
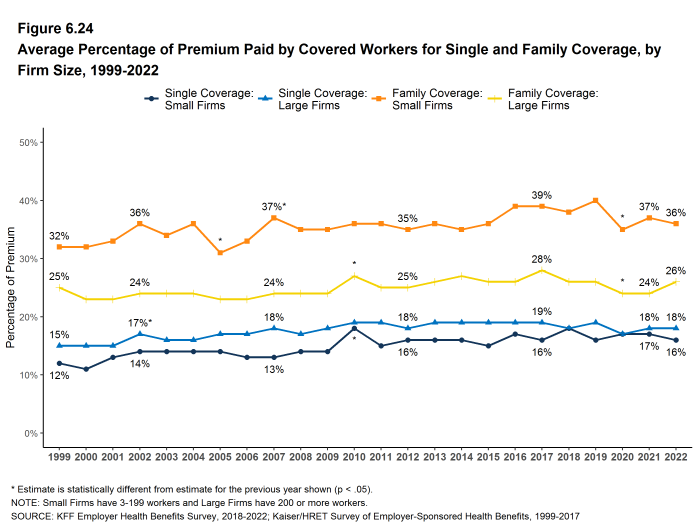
- Covered workers in small firms contribute, on average, a much higher percentage of the premium for family coverage than covered workers in large firms (36% vs. 26%) [Figure 6.2].
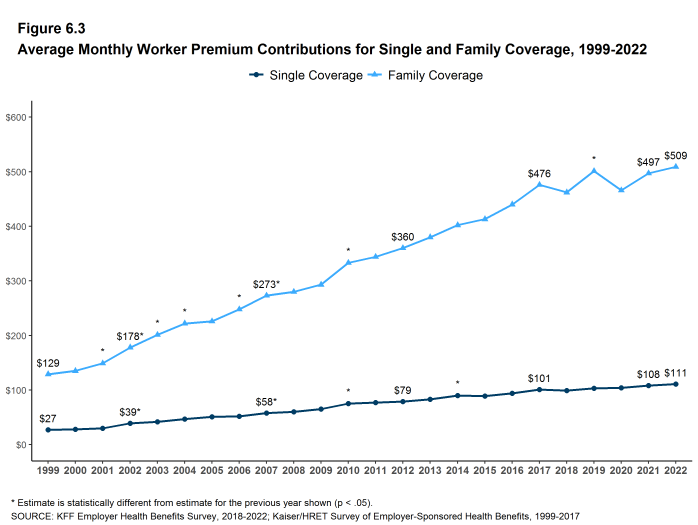
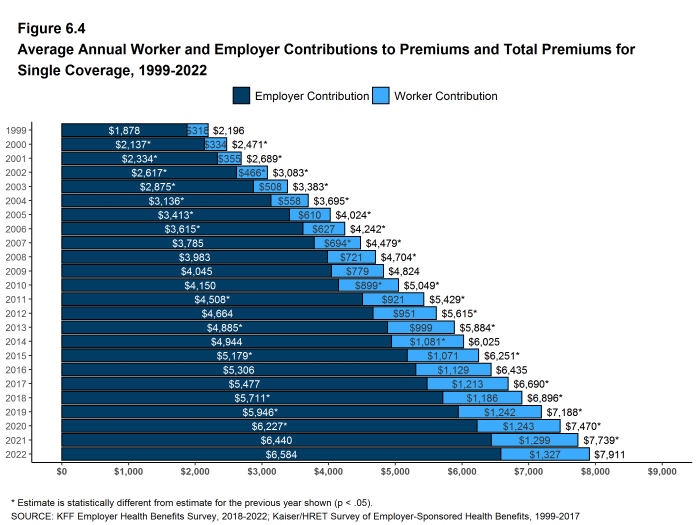
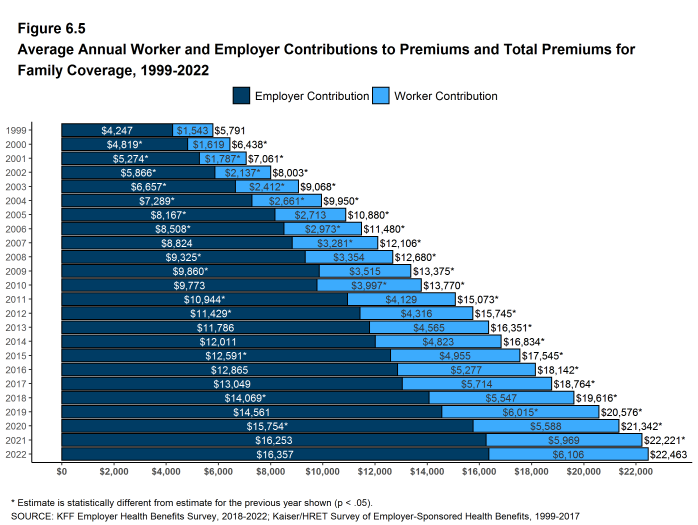
- Covered workers with single coverage have an average contribution of $111 per month ($1,327 annually), and covered workers with family coverage have an average contribution of $509 per month ($6,106 annually) toward their health insurance premiums [Figure 6.3], [Figure 6.4], and [Figure 6.5].
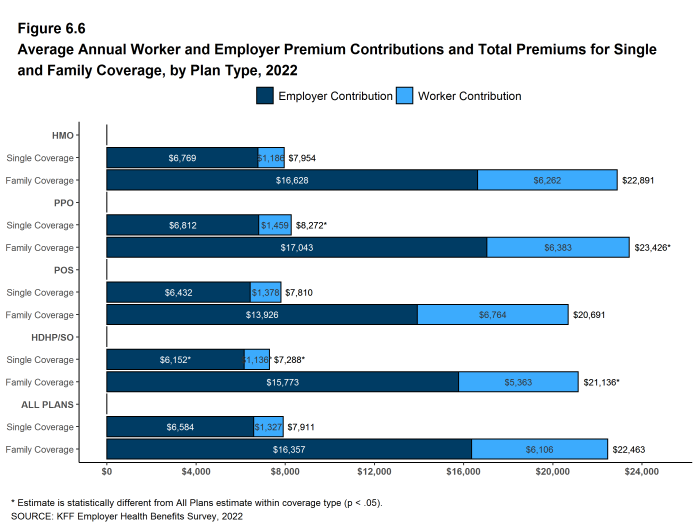
- The average contribution for workers enrolled in HDHP/SOs for single coverage is lower than the overall average worker contribution for single coverage ($1,136 vs. $1,327) [Figure 6.6].
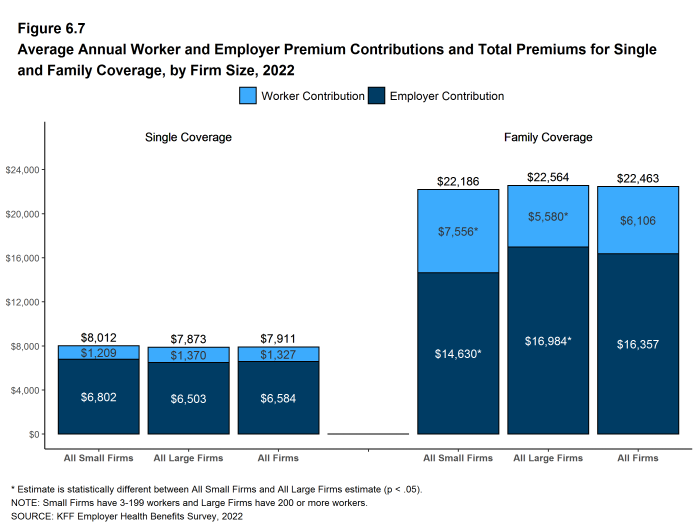
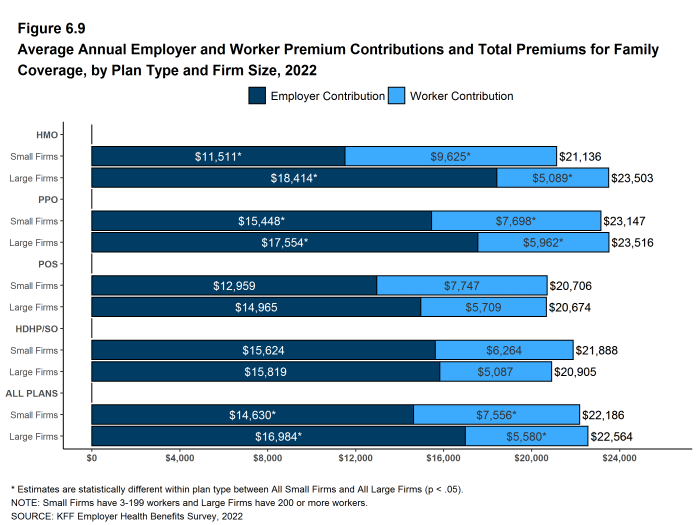
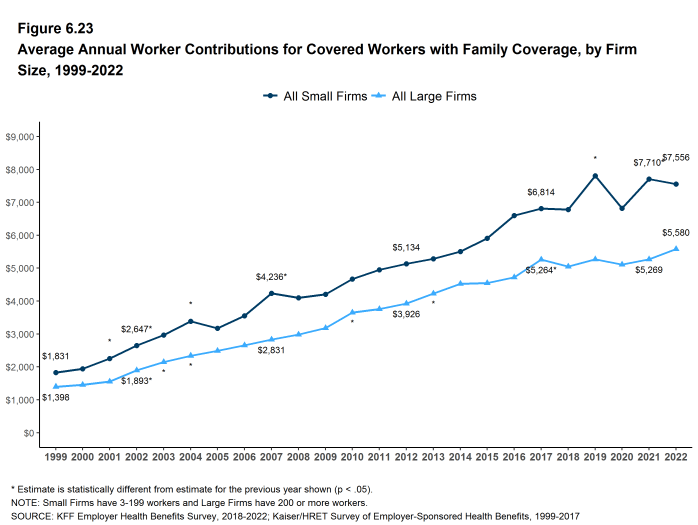
- Covered workers in small firms contribute, on average, significantly more annually for family coverage than covered workers in large firms ($7,556 vs. $5,580). The average contributions amounts for covered workers in small and large firms are similar for single coverage [Figure 6.7].
Figure 6.1: Average Percentage of Premium Paid by Covered Workers for Single and Family Coverage, 1999-2022
Figure 6.2: Average Percentage of Premium Paid by Covered Workers for Single and Family Coverage, by Firm Size, 2022
Figure 6.4: Average Annual Worker and Employer Contributions to Premiums and Total Premiums for Single Coverage, 1999-2022
Figure 6.5: Average Annual Worker and Employer Contributions to Premiums and Total Premiums for Family Coverage, 1999-2022
Figure 6.6: Average Annual Worker and Employer Premium Contributions and Total Premiums for Single and Family Coverage, by Plan Type, 2022
Figure 6.7: Average Annual Worker and Employer Premium Contributions and Total Premiums for Single and Family Coverage, by Firm Size, 2022
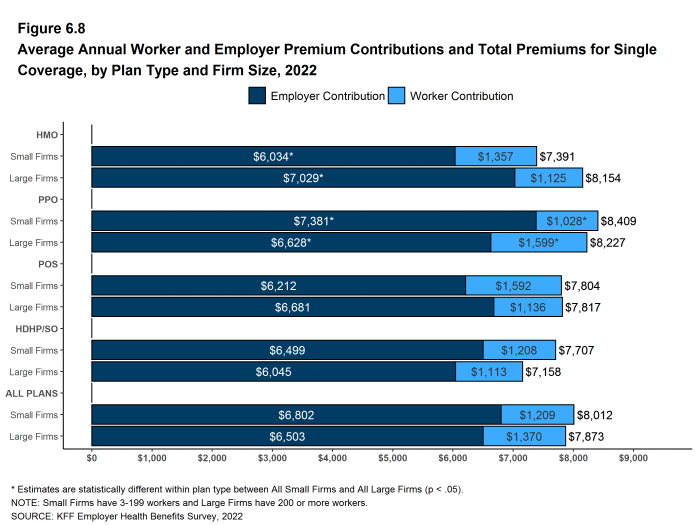
Figure 6.8: Average Annual Worker and Employer Premium Contributions and Total Premiums for Single Coverage, by Plan Type and Firm Size, 2022
Figure 6.9: Average Annual Employer and Worker Premium Contributions and Total Premiums for Family Coverage, by Plan Type and Firm Size, 2022
DISTRIBUTIONS OF WORKER CONTRIBUTIONS TO THE PREMIUM
- About nine-tenths of covered workers are in a plan where the employer contributes at least half of the premium for both single and family coverage.
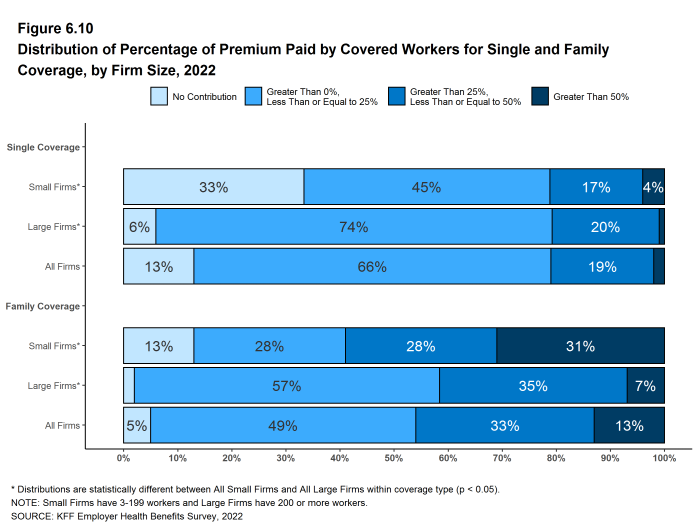
- Thirteen percent of covered workers are in a plan where the employer pays the entire premium for single coverage, while only 5% of covered workers are in a plan where the employer pays the entire premium for family coverage [Figure 6.10].
- Covered workers in small firms are much more likely than covered workers in large firms to be in a plan where the employer pays the entire premium.
- Thirty-three percent of covered workers in small firms have an employer that pays the full premium for single coverage, compared to 6% of covered workers in large firms [Figure 6.10].
- For family coverage, 13% of covered workers in small firms have an employer that pays the full premium, compared to 2% of covered workers in large firms [Figure 6.10].
- Thirteen percent of covered workers are in a plan where the worker contributes more than half of the premium for family coverage [Figure 6.10].
- This percentage differs significantly with firm size. Thirty-one percent of covered workers in small firms work in a firm where the worker contribution for family coverage is more than 50% of the premium, a much higher percentage than the 7% of covered workers in large firms [Figure 6.10].
- Small shares of covered workers in small firms (4%) and large firms (1%) must pay more than 50% of the premium for single coverage [Figure 6.10].
- There is substantial variation between small and large firms in the dollar amounts that covered workers must contribute.
- Among covered workers in small firms, 37% have a contribution for single coverage of less than $500, while 19% have a contribution of $2,000 or more [Figure 6.13]. For family coverage, 15% have a contribution of less than $1,500, while 26% have a contribution of $10,500 or more [Figure 6.14].
- Among covered workers in large firms, 14% contribute less than $500 for single coverage, while 18% have a contribution of $2,000 or more [Figure 6.13]. For family coverage, only 5% contribute less than $1,500, while 6% have a contribution of $10,500 or more [Figure 6.14].
Figure 6.10: Distribution of Percentage of Premium Paid by Covered Workers for Single and Family Coverage, by Firm Size, 2022
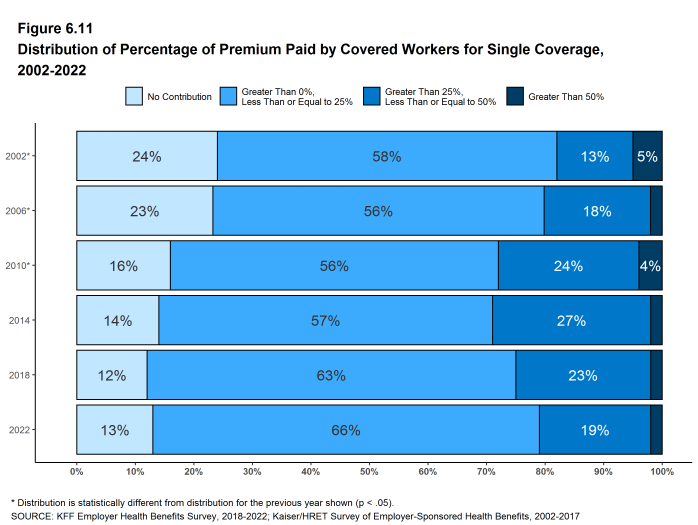
Figure 6.11: Distribution of Percentage of Premium Paid by Covered Workers for Single Coverage, 2002-2022
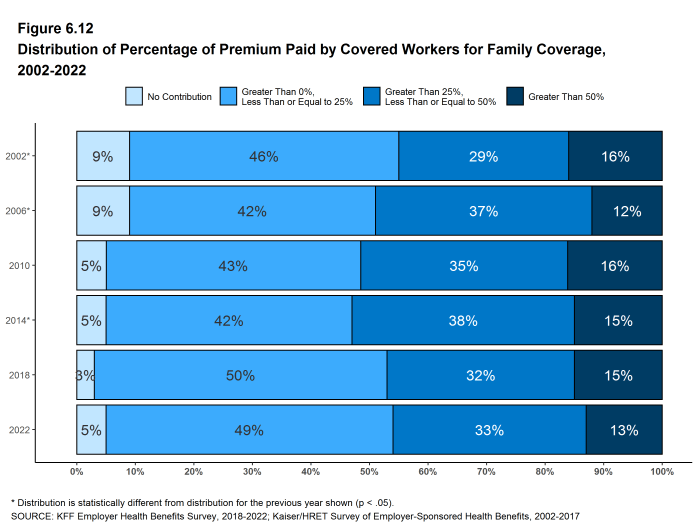
Figure 6.12: Distribution of Percentage of Premium Paid by Covered Workers for Family Coverage, 2002-2022
DIFFERENCES BY FIRM CHARACTERISTICS
- The percentage of the premium paid by covered workers varies with firm characteristics.
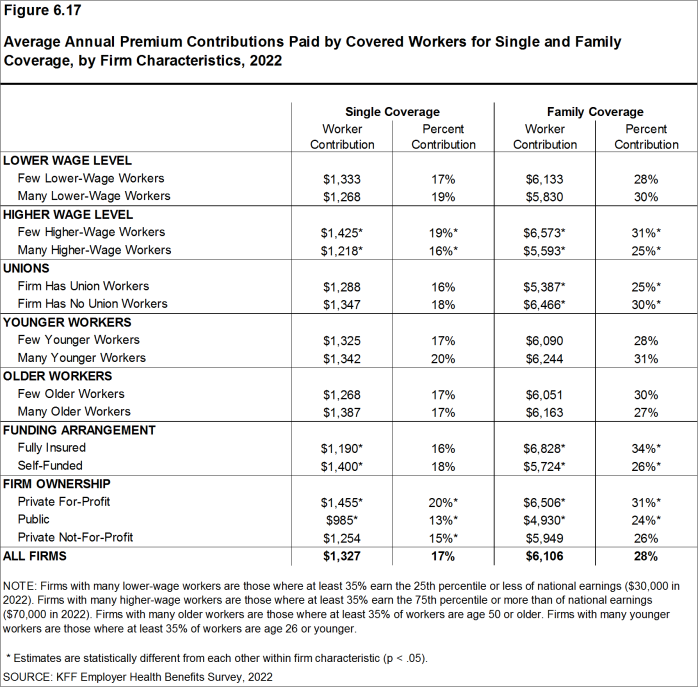
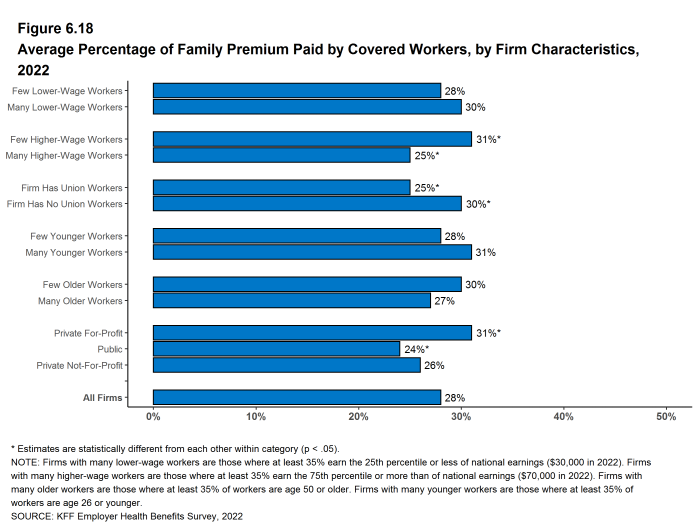
- Covered workers in private, for-profit firms have relatively high premium contribution rates for single (20%) and family (31%) coverage. On the other hand, covered workers in public firms have relatively low premium contributions for single (13%) and family (24%) coverage. The average single coverage contribution rate for covered workers in private not-for-profit firms (15%) is also relatively low [Figure 6.17].
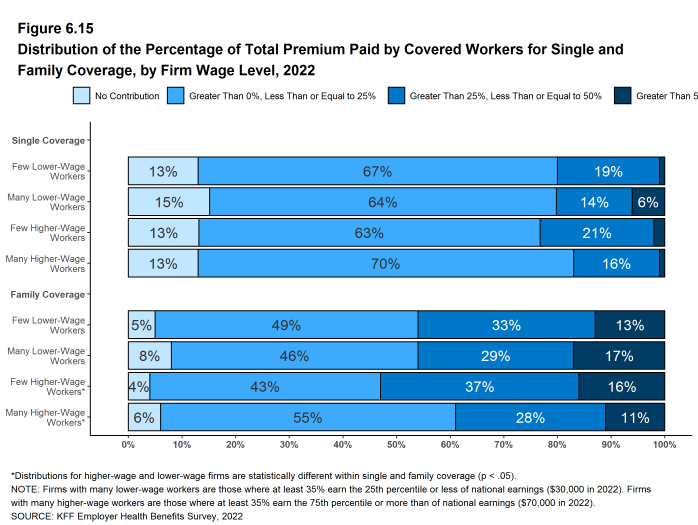
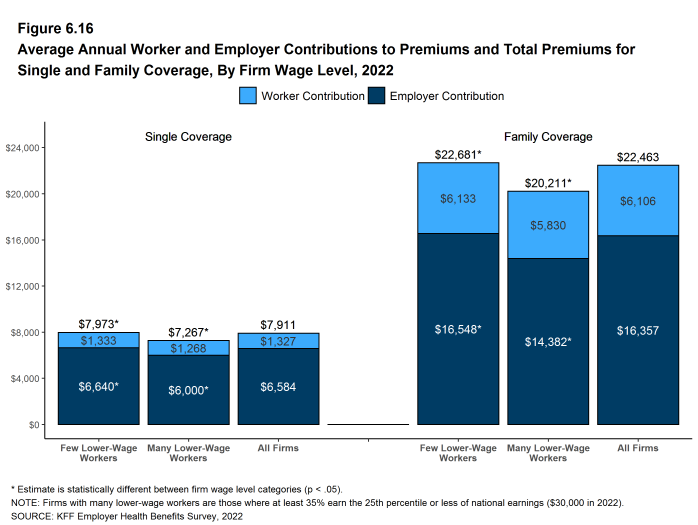
- Covered workers in firms with a relatively large share of higher-wage workers (where at least 35% earn $70,000 or more annually) have lower average contributions than those in firms with a smaller share of higher-wage workers for single coverage (16% vs. 19%) and for family coverage (25% vs. 31%) [Figure 6.16].
- Covered workers in firms that have at least some union workers have a lower average contribution for family coverage (25% vs. 30%) than those in firms without any union workers [Figure 6.17].
Figure 6.15: Distribution of the Percentage of Total Premium Paid by Covered Workers for Single and Family Coverage, by Firm Wage Level, 2022
Figure 6.16: Average Annual Worker and Employer Contributions to Premiums and Total Premiums for Single and Family Coverage, by Firm Wage Level, 2022
Figure 6.17: Average Annual Premium Contributions Paid by Covered Workers for Single and Family Coverage, by Firm Characteristics, 2022
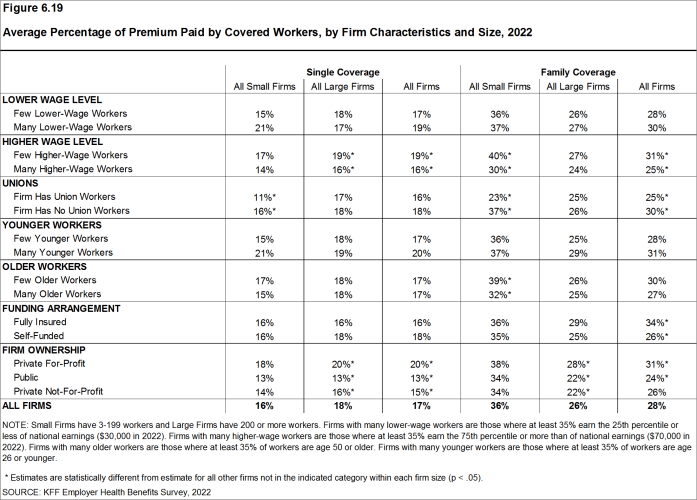
Figure 6.18: Average Percentage of Family Premium Paid by Covered Workers, by Firm Characteristics, 2022
DIFFERENCES BY REGION AND INDUSTRY
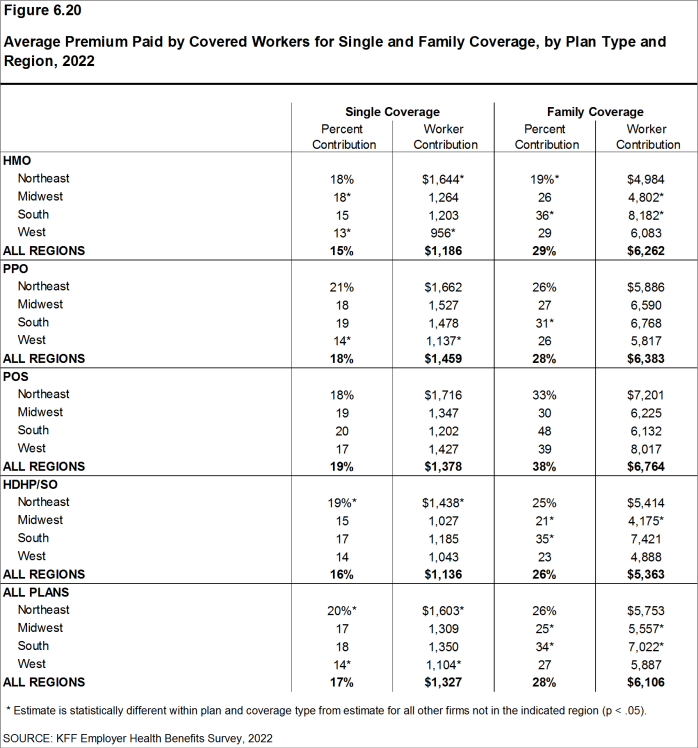
- The average worker contribution for single coverage is relatively high in Northeast (20%) and relatively low in the West (14%) [Figure 6.20].
- The average worker contribution for family coverage is relatively low in Midwest (25%) and relatively high in the South (34%) [Figure 6.20].
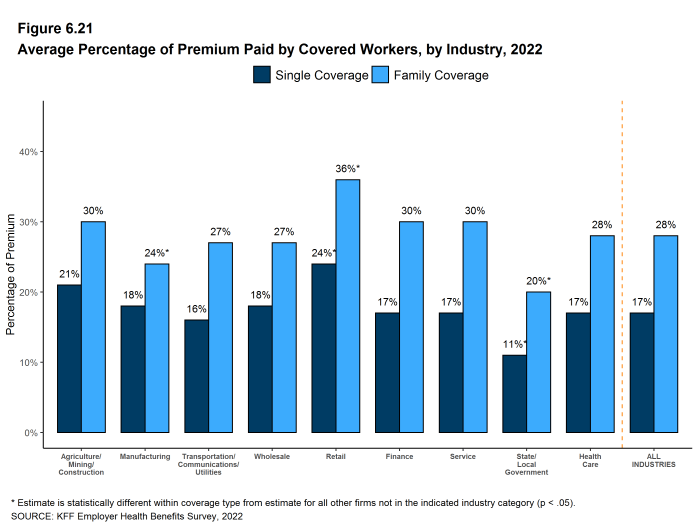
- Average worker contributions vary across industries for single and family coverage [Figure 6.21].
Figure 6.20: Average Premium Paid by Covered Workers for Single and Family Coverage, by Plan Type and Region, 2022
CHANGES OVER TIME
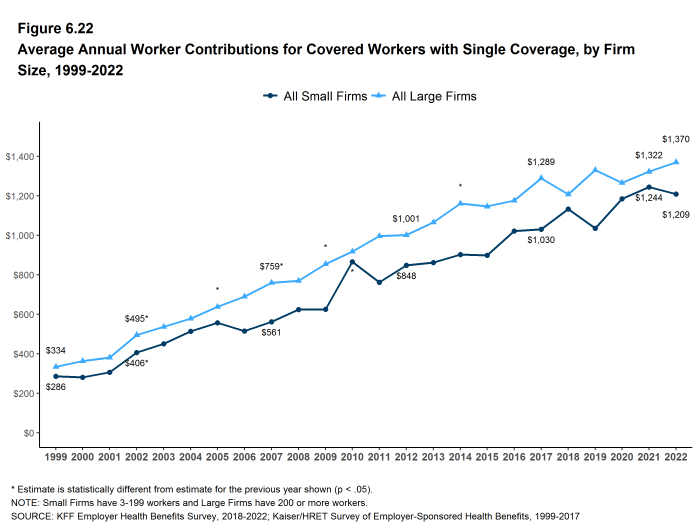
- The average worker contributions in 2022 for single coverage ($1,327) and for family coverage ($6,106) are similar to the average contribution levels last year [Figures 6.22 and 6.23].
- The average worker contribution for single coverage has increased 9% over the last five years. The average worker contributions for single and family coverage over the last 10 years have increased 39% and 41%, respectively [Figures 6.4 and 6.5].
Figure 6.22: Average Annual Worker Contributions for Covered Workers With Single Coverage, by Firm Size, 1999-2022
Figure 6.23: Average Annual Worker Contributions for Covered Workers With Family Coverage, by Firm Size, 1999-2022
Figure 6.24: Average Percentage of Premium Paid by Covered Workers for Single and Family Coverage, by Firm Size, 1999-2022
- The average percentage contribution is calculated as a weighted average of all a firm’s plan types and may not necessarily equal the average worker contribution divided by the average premium.↩︎
Sections
- Section 1: Cost of Health Insurance
- Section 2: Health Benefits Offer Rates
- Section 3: Employee Coverage, Eligibility, and Participation
- Section 4: Types of Plans Offered
- Section 5: Market Shares of Health Plans
- Section 6: Worker and Employer Contributions for Premiums
- Section 7: Employee Cost Sharing
- Section 8: High-Deductible Health Plans with Savings Option
- Section 9: Prescription Drug Benefits
- Section 10: Plan Funding
- Section 11: Retiree Health Benefits
- Section 12: Health Screening and Health Promotion and Wellness Programs
- Section 13: Employer Practices, Telehealth, Provider Networks and Coverage for Mental Health Services

