2022 Employer Health Benefits Survey
Section 3: Employee Coverage, Eligibility, and Participation
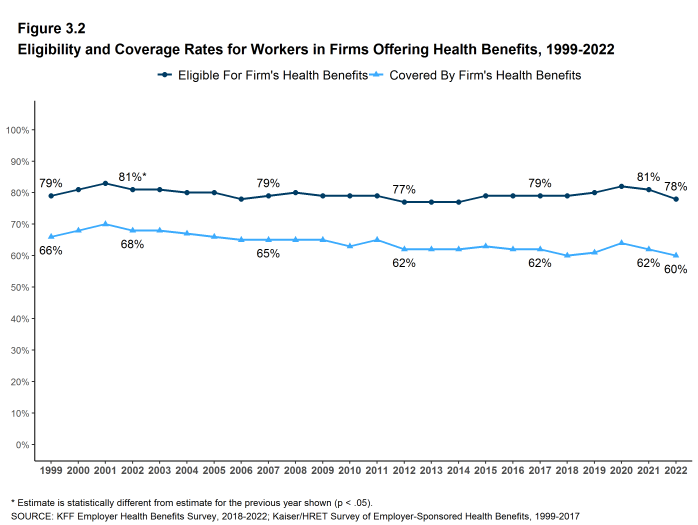
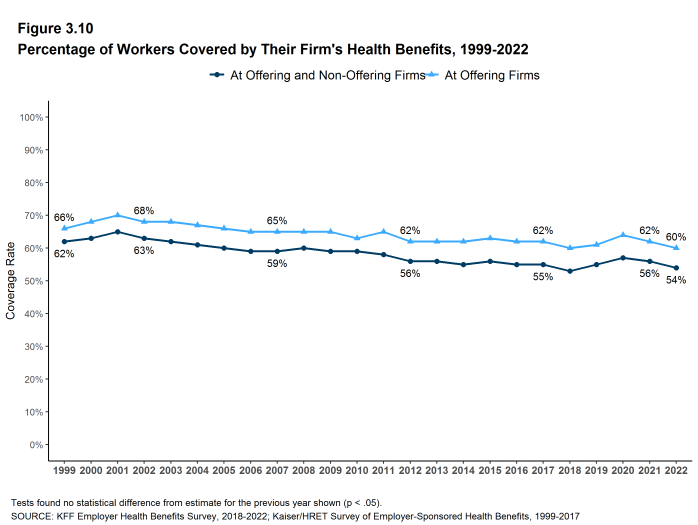
Employers are the principal source of health insurance in the United States, providing health benefits for almost 159 million nonelderly people.12 Most workers are offered health coverage at work, and most of the workers who are offered coverage take it. Workers may not be covered by their own employer for several reasons: their employer may not offer coverage, they may not be eligible for the benefits offered by their firm, they may elect to receive coverage from another source (such as through their spouse’s employer), or they may just refuse the offer of coverage from their firm. In 2022, 60% of workers in firms offering health benefits are covered by their own firm, similar to the percentages last year, five years ago and ten years ago.
ELIGIBILITY
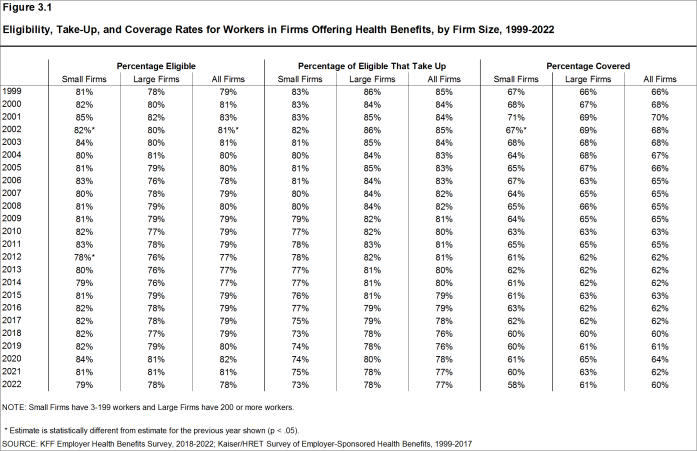
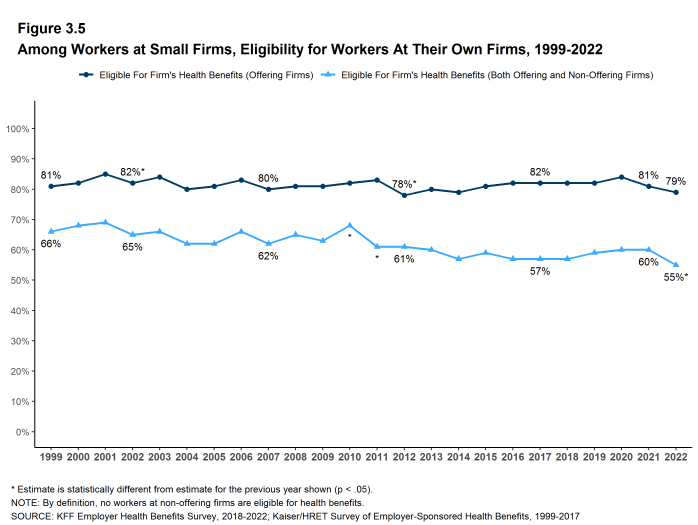
- Even in firms that offer health benefits, some workers may not be eligible to participate.13 Many firms, for example, do not offer coverage to part-time or temporary workers. Among workers in firms offering health benefits in 2022, 78% are eligible to enroll in the benefits offered by their firm, similar to the percentages last year, five years ago, and 10 years ago, for both small and large firms [Figures 3.1 and 3.2].
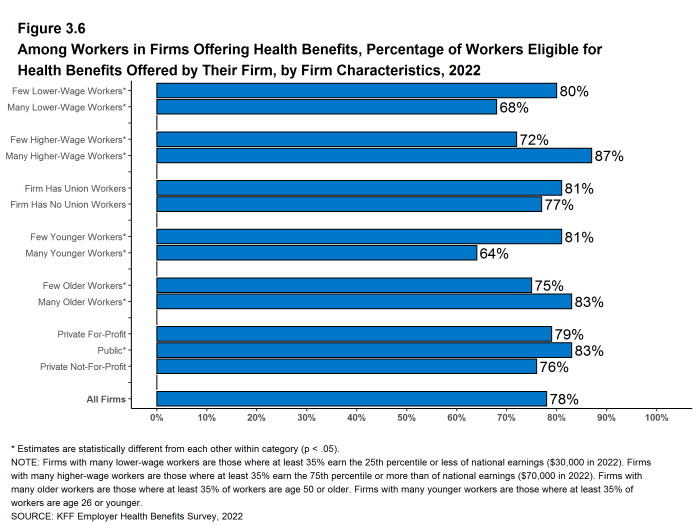
- Eligibility varies considerably by firm wage level. Workers in firms with a relatively large share of lower-wage workers (where at least 35% of workers earn $30,000 a year or less) have a lower average eligibility rate than workers in firms with a smaller share of lower-wage workers (68% vs. 80%) [Figure 3.6].
- Workers in firms with a relatively large share of higher-wage workers (where at least 35% earn $70,000 or more annually) have a higher average eligibility rate than workers in firms with a smaller share of higher-wage workers (87% vs. 72%) [Figure 3.6].
- Eligibility also varies by the age of the workforce. Those in firms with a relatively small share of younger workers (where fewer than 35% of the workers are age 26 or younger) have a higher average eligibility rate than those in firms with a larger share of younger workers (81% vs. 64%). Those in firms with a relatively large share of older workers (where more than 35% of the workers are age 50 or older) have a higher average eligibility rate than those in firms with a smaller share of older workers (83% vs. 75%) [Figure 3.6].
- Workers in public firms have a higher average eligibility rate (83%) than workers in private for-profit firms (79%) and private not-forprofit firms (76%) [Figure 3.6].
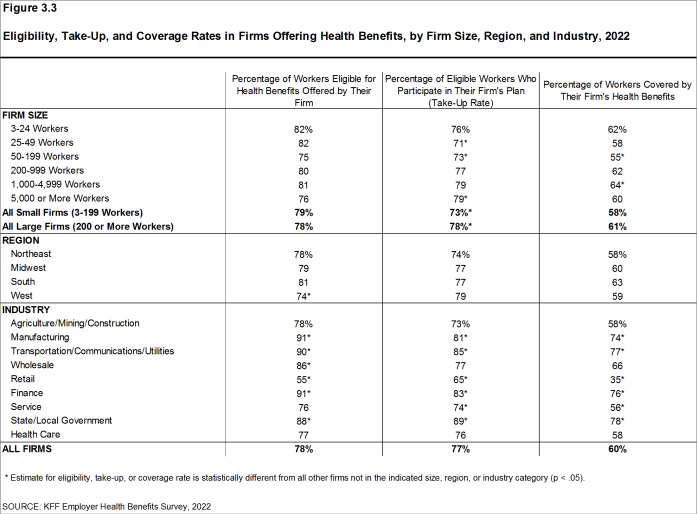
- Eligibility rates vary considerably for workers in different industries. The average eligibility rate remains particularly low for workers in retail firms (55%) [Figure 3.3].
Figure 3.1: Eligibility, Take-Up, and Coverage Rates for Workers in Firms Offering Health Benefits, by Firm Size, 1999-2022
Figure 3.3: Eligibility, Take-Up, and Coverage Rates in Firms Offering Health Benefits, by Firm Size, Region, and Industry, 2022
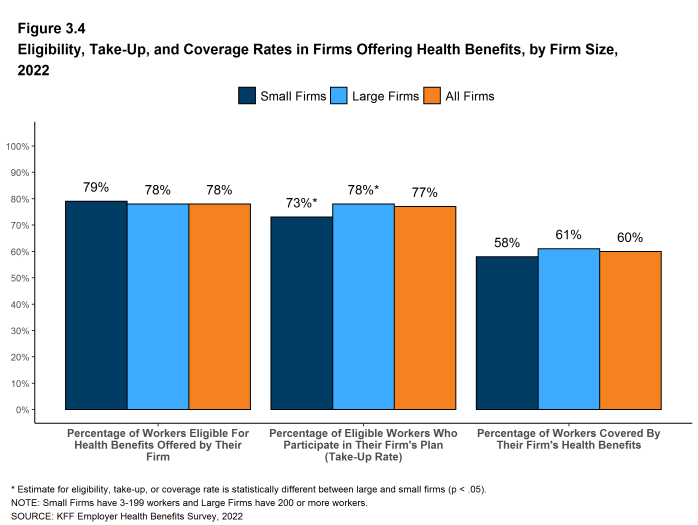
Figure 3.4: Eligibility, Take-Up, and Coverage Rates in Firms Offering Health Benefits, by Firm Size, 2022
TAKE-UP RATE
- Seventy-seven percent of eligible workers take up coverage when it is offered to them, similar to the percentage last year [Figure 3.1].14
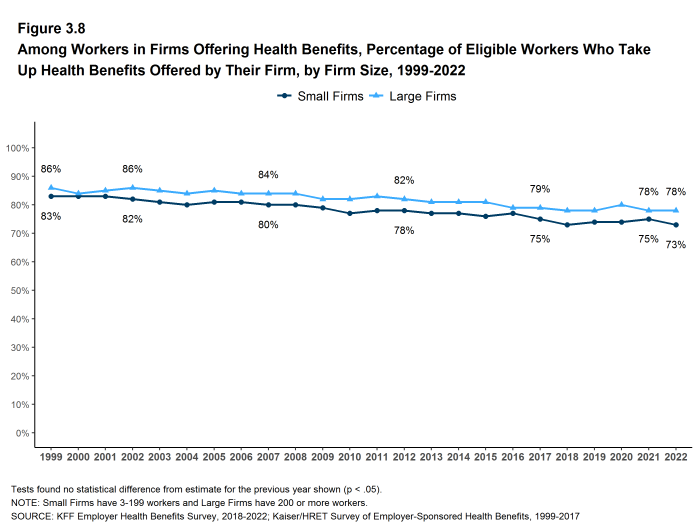
- Eligible workers in small firms have a lower average take up rate than those in larger firms (73% vs. 78%) [Figure 3.8].
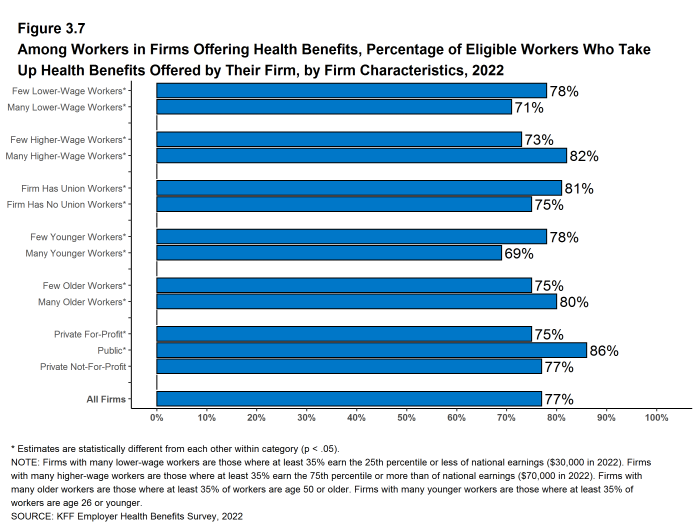
- The likelihood of a worker accepting a firm’s offer of coverage varies by firm wage level. Eligible workers in firms with a relatively large share of lower-wage workers have a lower average take up rate than eligible workers in firms with a smaller share of lower-wage workers (71% vs. 78%) [Figure 3.7].
- Eligible workers in firms with a relatively large share of higher-wage workers have a higher average take up rate than those in firms with a smaller share of higher-wage workers (82% vs. 73%) [Figure 3.7].
- The likelihood of a worker accepting a firm’s offer of coverage also varies with the age distribution of the workforce. Eligible workers in firms with a relatively large share of younger workers have a lower average take up rate than those in firms with a smaller share of younger workers (69% vs. 78%) [Figure 3.7].
- Eligible workers in private, for-profit firms have a lower average take up rate (75%) and eligible workers in public firms have a higher average take up rate (86%) than workers in other firm types [Figure 3.7].
- Eligible workers in firms with some union workers have a higher average take up rate (81%) than eligible workers in firms with no union workers (75%) [Figure 3.7].
- The average percentages of eligible workers taking up benefits in offering firms also varies across industries [Figure 3.3].
- The share of eligible workers taking up benefits in offering firms (77%) is similar to the share in 2017 (78%) but lower than the share in 2012 (81%) [Figure 3.1].
Figure 3.7: Among Workers in Firms Offering Health Benefits, Percentage of Eligible Workers Who Take Up Health Benefits Offered by Their Firm, by Firm Characteristics, 2022
COVERAGE
- In 2022, the percentage of workers at firms offering health benefits covered by their firm’s health plan is 60%, similar to the percentage last year [Figure 3.1] and [Figure 3.2].
- The coverage rate at firms offering health benefits is similar for small firms and large firms in 2022. These rates are similar to the rates last year for both small firms and large firms [Figure 3.1] and [Figure 3.3].
- There is significant variation by industry in the coverage rate among workers in firms offering health benefits. The average coverage rate is particularly low in the retail industry (35%) [Figure 3.3].
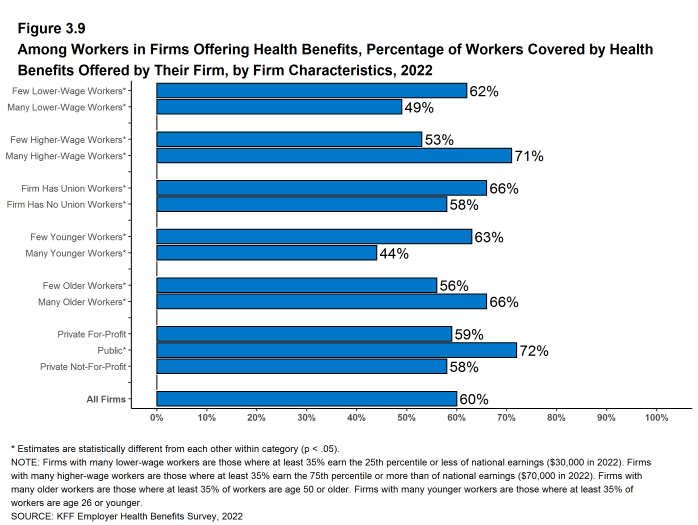
- There also is variation by firm wage levels. Among workers in firms offering health benefits, those in firms with a relatively large share of lower-wage workers are less likely to be covered by their own firm than workers in firms with a smaller share of lower-wage workers (49% vs. 62%). A similar pattern exists in firms with a relatively large share of higher-wage workers, with workers in these firms being more likely to be covered by their employer’s health benefits than those in firms with a smaller share of higher-wage workers (71% vs. 53%) [Figure 3.9].
- The age distribution of workers is also related to variation in coverage rates. Among workers in firms offering health benefits, those in firms with a relatively small share of younger workers are more likely to be covered by their own firm than those in firms with a larger share of younger workers (63% vs. 44%). Similarly, workers in offering firms with a relatively large share of older workers are more likely to be covered by their own firm than those in firms with a smaller share of older workers (66% vs. 56%) [Figure 3.9].
- Among workers in firms offering health benefits, those working in public firms are more likely than workers in other firm types to be covered by their own firm [Figure 3.9].
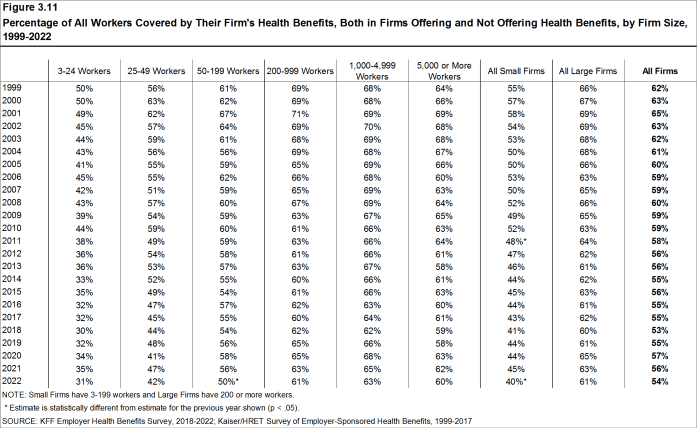
- Among workers in all firms, including those that offer and those that do not offer health benefits, 54% are covered by health benefits offered by their employer, similar to the percentages last year (56%) and five years ago (55%) [Figure 3.10].
Figure 3.9: Among Workers in Firms Offering Health Benefits, Percentage of Workers Covered by Health Benefits Offered by Their Firm, by Firm Characteristics, 2022
- Estimate from KFF’s analysis of American Community Survey. Health insurance coverage of the nonelderly 0–64 [Internet]. San Francisco (CA): KFF; 2019 [cited 2022 Sep 12]. Available from: https://www.kff.org/other/state-indicator/nonelderly-0-64/↩︎
- See Section 2 for part-time and temporary worker offer rates.↩︎
- In 2009, we began weighting the percentage of workers that take up coverage by the number of workers eligible for coverage. The historical take-up estimates have also been updated. See the Survey Design and Methods section for more information.↩︎

