2015 Employer Health Benefits Survey
Section Fourteen: Employer Opinions and Health Plan Practices
Employers play a significant role in health insurance coverage – so their opinions and experiences are important factors in health policy discussions. Employer practices continue to evolve, partially in response to Affordable Care Act provisions, including the employer shared responsibility provisions, which require large employers offer coverage or pay a fee, and the impending excise tax on high-cost plans. Thirteen percent of large firms (200 or more workers) offering health benefits have already made changes to their plans’ coverage or cost sharing in response to high-cost plan tax provisions.
Employers continue to innovate as to how they offer, structure, and deliver their benefits. A considerable number of employers have developed strategies to reduce costs or improve quality through changes to their plan’s provider networks. Seven percent of employers offering health benefits offer a plan with a narrow network. Although relatively few employers offering health benefits with more than 50 workers offer coverage through a private or corporate exchange (3%), employers continue to show interest in these arrangements. Five percent of firms with 3 to 499 workers offering health benefits provide for benefits through a co-employment arrangement with a Professional Employer Organization (PEO).
Shopping for Health Coverage
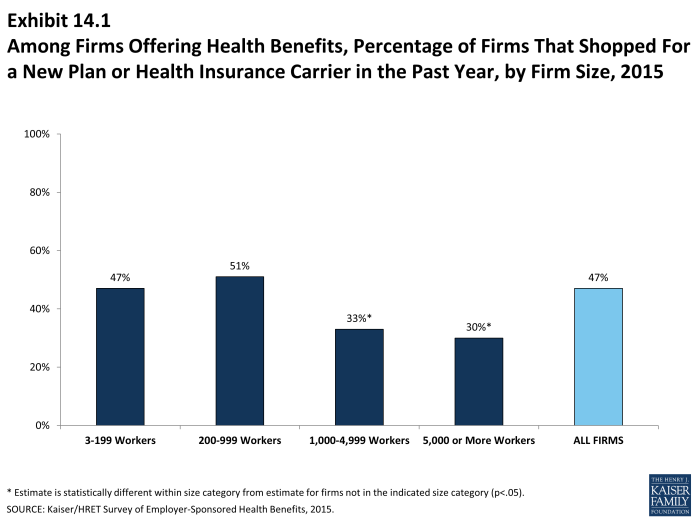
Nearly one-half (47%) of firms offering health benefits reported shopping for a new health plan or a new insurance carrier in the past year, suggesting that the market is quite dynamic. The largest firms, those with 1,000 or more employees, were less likely to shop for a new plan or carrier than small firms (Exhibit 14.1). The percentage of firms offering health benefits that reported shopping for a new plan or carrier has remained stable over the last couple of years.
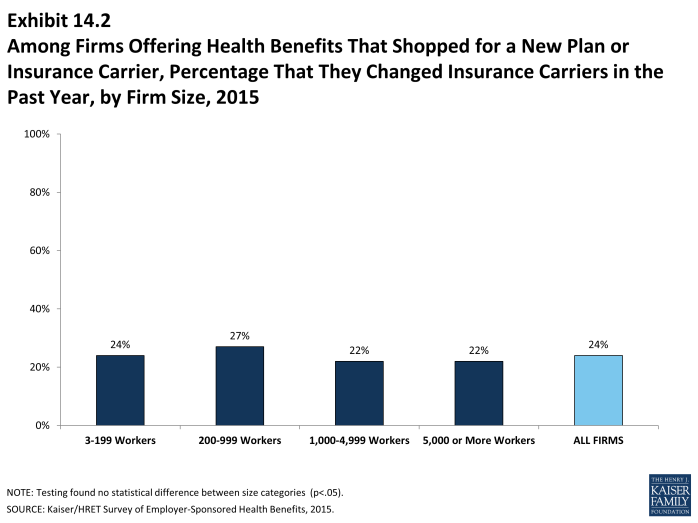
- Among firms that offer health benefits and who shopped for a new plan or carrier, 24% changed insurance carriers (Exhibit 14.2).
Tiered Networks and Narrow Network Plans
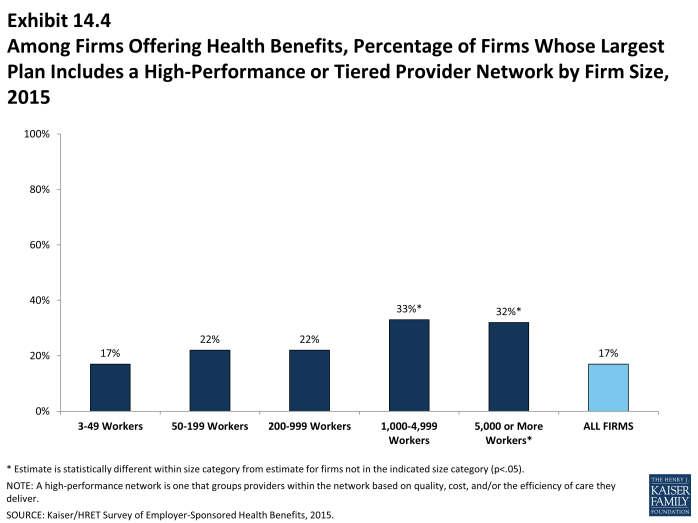
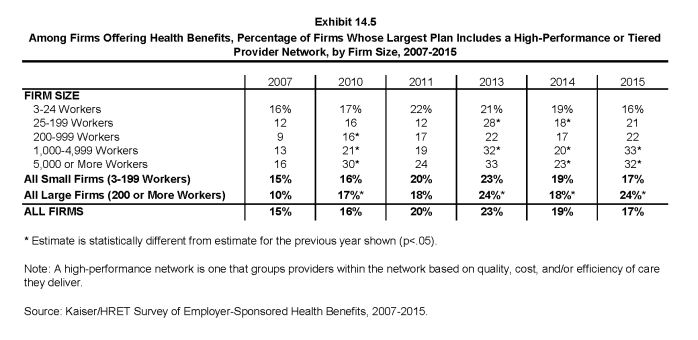
A tiered or high-performance network groups providers in the network together based on quality, cost, and/or the efficiency of the care they deliver. These networks encourage patients to visit preferred doctors by either restricting networks to efficient providers, or by having different cost sharing requirements based on the provider’s tier.
- Seventeen percent of firms that offer health benefits include a high-performance or tiered provider network in their health plan with the largest enrollment. The largest firms (those with 1,000 or more employees) are more likely to incorporate a high-performance or tiered network into their largest plan (Exhibit 14.4).
- The percentage of large firms (200 or more workers) offering health benefits whose largest plan includes a high-performance or tiered network increased from 17% in 2010 to 24% in 2015. The percentage of all firms offering health benefits whose largest plan includes a tiered network (17%) is similar to the 19% reported in 2014 (Exhibit 14.5).
Firms offering health benefits were asked whether they offered a plan that they considered to be a narrow network. Narrow networks are plans that limit the number of providers who can participate in order to reduce costs. Narrow network plans are generally more restrictive than standard HMO networks.
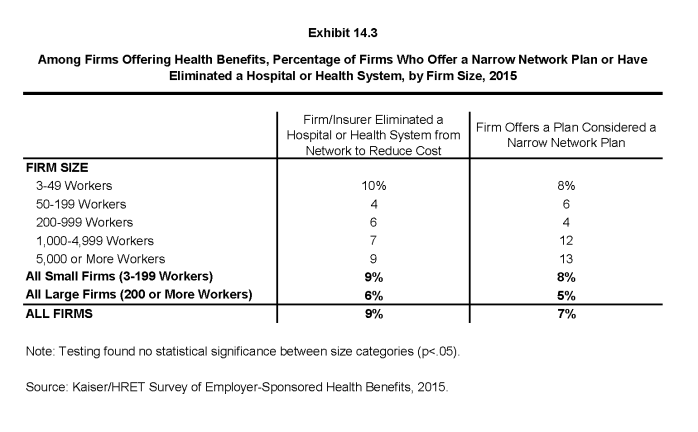
- Seven percent of offering firms indicated that they offered a plan they considered to be a narrow network plan (Exhibit 14.3), similar to 8% in 2014.
- Nine percent of firms offering health benefits said that either they or their insurer eliminated a hospital or health system from a provider network in order to reduce the plan’s cost (Exhibit 14.3).
Private exchanges and Professional Employer Organizations
There has been considerable interest in private exchanges recently. An exchange is a marketplace for health insurance. Private exchanges allow employees to choose from several health benefit options offered on the exchange. Private exchanges generally are created by consulting firms, insurers, or brokers, and are different than the public exchanges that have been created by states or the federal government. There is considerable variation in the types of exchanges currently offered; some exchanges allow workers to choose between multiple plans offered by the same carrier while in other cases multiple carriers participate. The exchange operator may establish strict standards for the plans offered or allow the insurers more flexibility in determining their plan offerings.
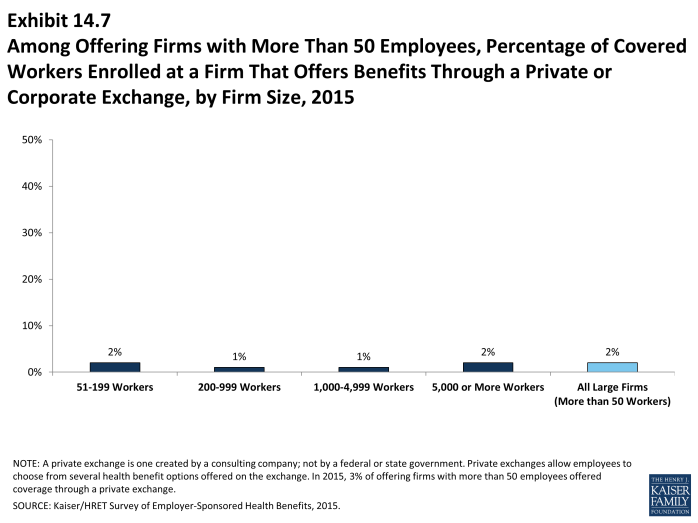
- In 2015, 3% of firms offering health benefits with more than 50 employees offer coverage through a private exchange. Looking at worker enrollment, private exchanges cover 2% of covered workers at firms with more than 50 employees (Exhibit 14.7).
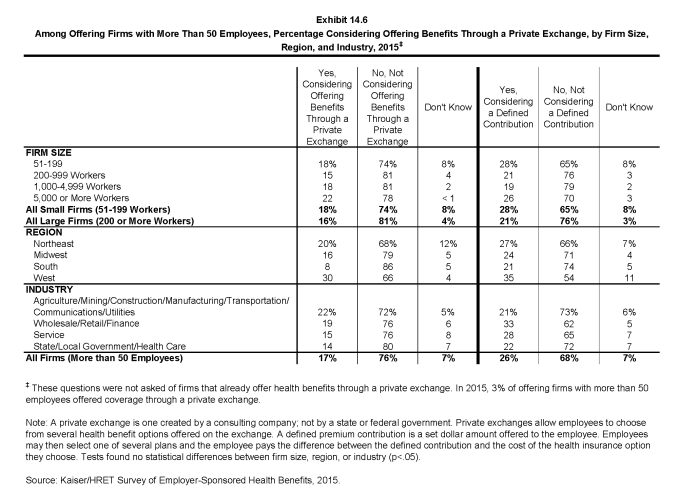
- Firms offering health benefits with more than 50 workers and who do not already offer health benefits through a private exchange were asked whether they were considering private exchanges. Seventeen percent of these firms are considering offering benefits through a private exchange (Exhibit 14.6).
- Private exchanges may or may not include a defined contribution for premiums. A defined contribution is a set dollar amount offered to the employee by the employer. Employees may then select one of several plans, paying the difference between the defined contribution and the cost of their chosen health insurance plan. This permits an employer to offer a larger variety of health plans to employees and to structure contributions or other rules to encourage employees to choose more efficient plans.
- Firms offering health benefits with more than 50 workers and who do not already offer health benefits through a private exchange were asked whether they were considering a defined contribution approach. Twenty-six percent of these firms were considering such an approach (Exhibit 14.6).
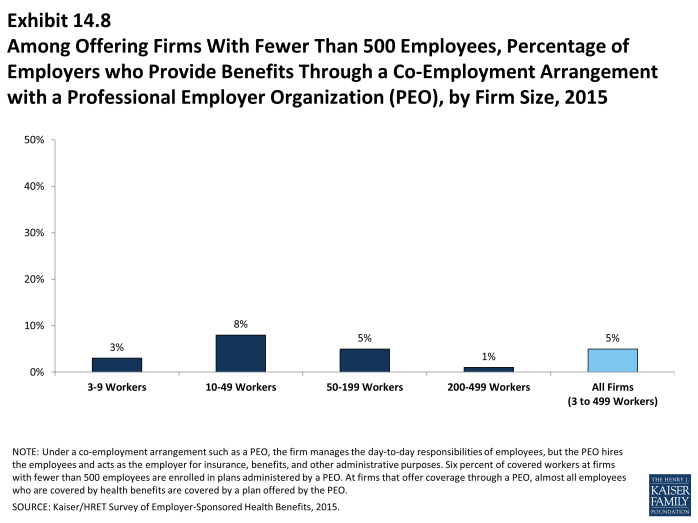
Some firms provide for health and other benefits by entering into a co-employment relationship with a Professional Employer Organization (PEO). Under this arrangement, the firm manages the day-to-day responsibilities of employees but the PEO also hires the employees and acts as the employer for insurance, benefits, and other administrative purposes.
- Five percent of firms with 3 to 499 workers offering health benefits offer coverage in conjunction with a PEO (Exhibit 14.8).
- Six percent of covered workers enrolled in health benefits at firms with 3 to 499 workers are enrolled in a plan offered through a PEO.
Enrollment incentives
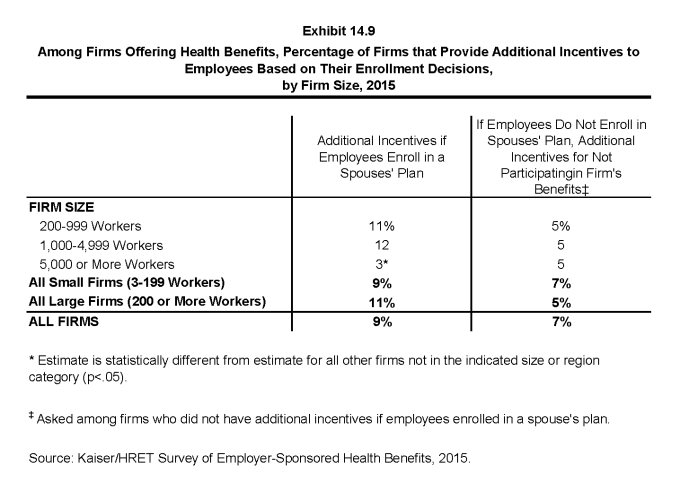
Some firms provide additional incentives to influence employees’ enrollment decisions.
- Nine percent of firms offering health benefits provide additional incentives if an employee enrolls in a spouse’s plan (Exhibit 14.9).
- Among firms offering benefits who do not offer additional incentives to employees who enroll in a spouse’s plan, 7% provide additional compensation or benefits to employees if they choose not to enroll in the firm’s health benefits (Exhibit 14.9).
Pre-Tax employee premium contributions and flexible spending accounts
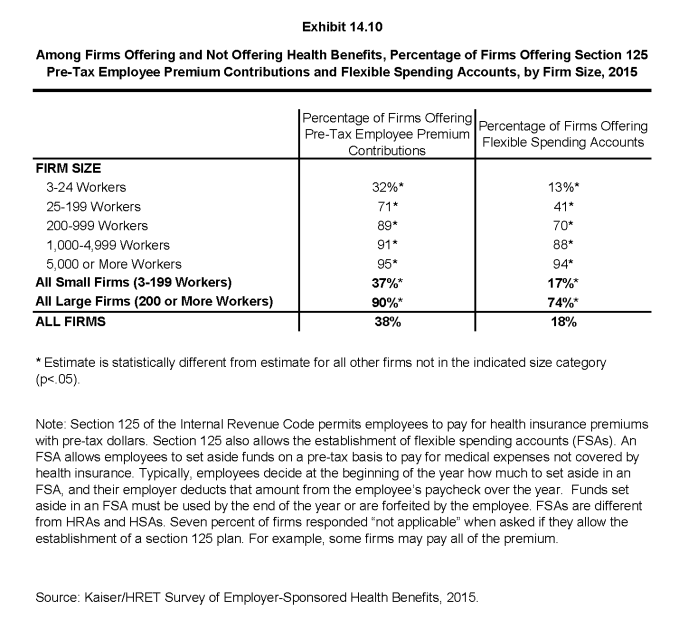
Section 125 of the Internal Revenue Code permits employees to pay for health insurance premiums with pre-tax dollars. Firms do not have to offer health insurance in order to establish these accounts. Flexible spending accounts (FSAs) allow employees to set aside funds on a pre-tax basis to pay for medical expenses not covered by health insurance. In 2015, employees may place up to $2,550 in an FSA.
- Among firms offering and not offering health benefits, 38% offer pre-tax employee premium contributions. Large firms (200 or more workers) are significantly more likely than small firms (3-199 workers) to offer these contributions (90% vs. 37%, respectively) (Exhibit 14.10). Seven percent of firms responded “not applicable” when asked if they allow the establishment of a section 125 plan. For example, some firms offering coverage may pay all of the premium.
- Among firms offering and not offering health benefits, 18% offer FSAs. Large firms are significantly more likely than small firms to offer an FSA (74% vs. 17%, respectively) (Exhibit 14.10).
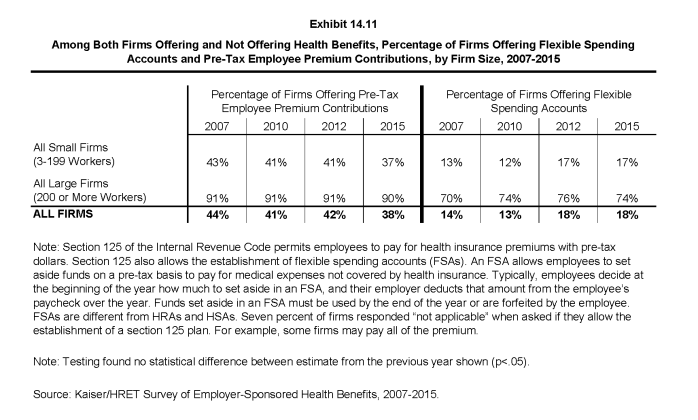
- The percentage of firms offering pre-tax employee premium contributions and FSAs in 2015 is similar to 2012 (42% and 18%, respectively) (Exhibit 14.11).
- Firms offering health benefits are more likely to have a section 125 account (54% vs. 21%) and allow workers to make FSA contributions (31% vs. 3%) than firms that do not offer health benefits.
Telemedicine
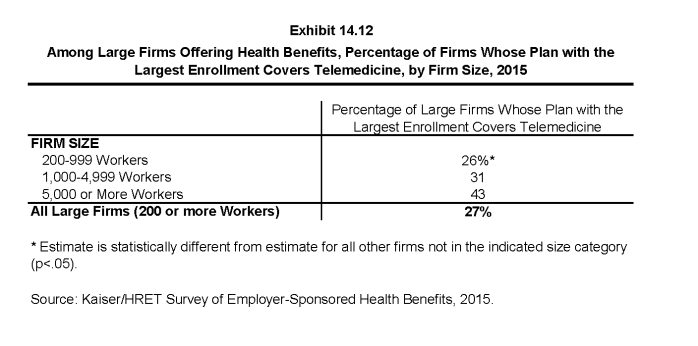
Telemedicine involves exchanging medical information electronically, such as through video, email, or smart phones. This survey does not consider information provided online as telemedicine unless a health professional provides information specific to the enrollee’s condition.
- The largest health plan at 27% of large firms (200 or more employees) offering health benefits includes coverage for telemedicine (Exhibit 14.12).
Excise tax on high cost health plans
Beginning in 2018, employer plans will be assessed a 40% excise tax on the value of the total cost of their plans above specified thresholds ($10,200 for single coverage and $27,000 for family coverage in 2018). The total cost of the plan is calculated based on several factors including any FSA contributions, premium costs, and any employer HRA contributions. In anticipation of the high-cost plan tax (sometimes referred to as the “Cadillac plan tax”), some employers have begun making changes to their health benefits.
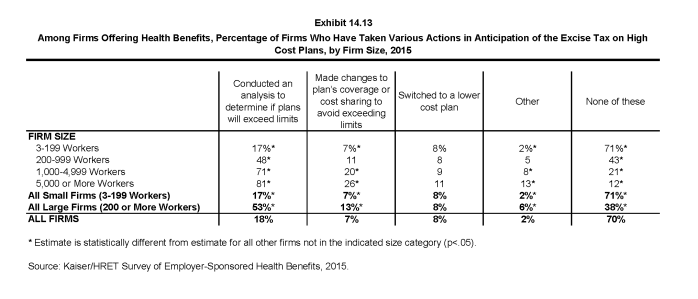
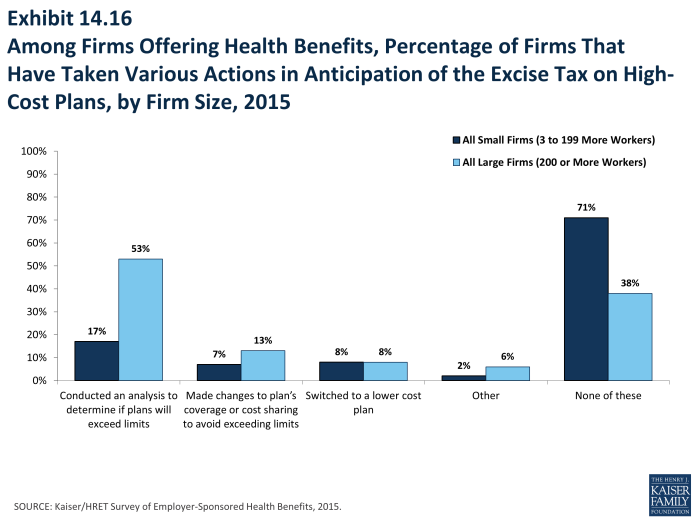
- Among firms offering health benefits, 53% of large firms (200 or more workers) and 17% of small firms have conducted an analysis to determine if one of their plans will be subject to the tax when it takes effect (Exhibit 14.13).
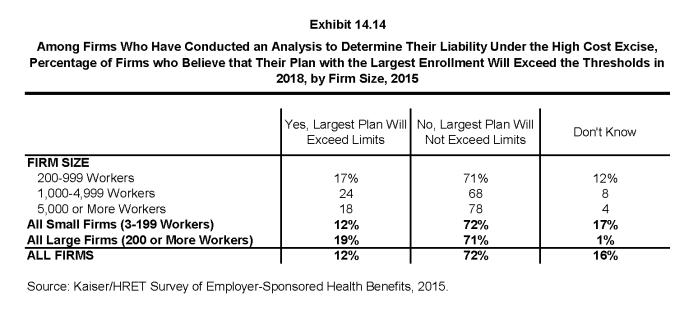
- Among firms who have conducted an analysis to determine their liability under the high-cost plan tax, 12% believe their plan with the largest enrollment will exceed the thresholds in 2018 (Exhibit 14.14).
- Some employers have already taken action to mitigate the anticipated impacts of the high-plan excise tax; 13% of large firms (200 or more employers) and 7% of small firms have made changes to their plans’ coverage or cost sharing to avoid exceeding the limits. Eight percent of both large and small firms have switched to a lower cost plan. Looking at firms that took one of these two actions, 11% of small firms (3-199 workers) and 16% of large firms reported either changing their plan or switching carriers to reduce the cost of their plan in anticipation of the assessment.
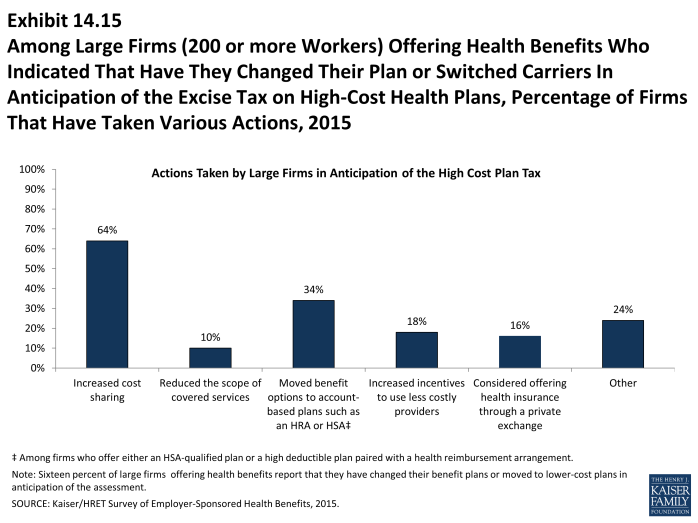
- Among large firms (200 or more workers) who indicated changing their plan or switching carriers to reduce the cost of their plan, 64% have increased cost sharing, 10% have reduced the scope of covered services, 34% have moved benefit options to account-based plans such as an HRA or HSA, 18% have increased incentives to use less costly providers, and 16% have considered offering health insurance through a private exchange in anticipation of the excise tax (Exhibit 14.15).
Employer shared responsibility
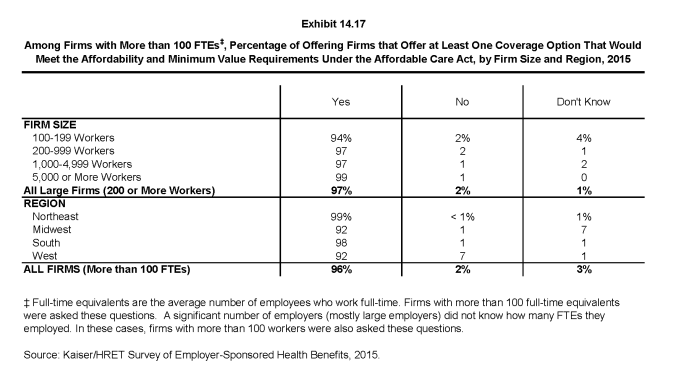
Beginning in 2015, employers with at least 100 full-time equivalent employees (FTEs) are required to offer health benefits to at least 70% of their full-time employees and their dependent children or potentially pay a fee. There is a separate provision that sets minimum standards for minimum value and affordability for the coverage that is offered in order to avoid a potential fee. Beginning in 2016, employers with at least 50 FTEs will also be subject to the employer shared responsibility provisions.
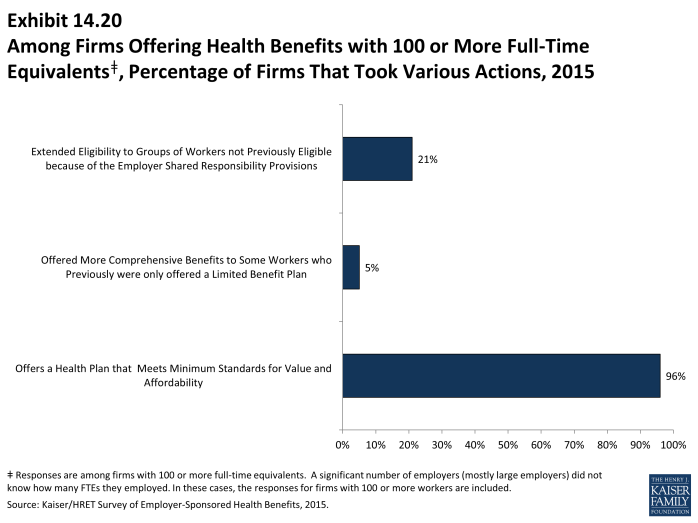
- Among firms reporting at least 100 FTEs (or, if they did not know FTEs, of firms with at least 100 employees), 96% report that they offer a health plan that would meet these requirements, 2% said they did not, and 3% reported “Don’t know” (Exhibit 14.17).
- Five percent of these firms reported that this year they offered more comprehensive benefits to some workers who previously were only offered a limited benefit plan (Exhibit 14.20).
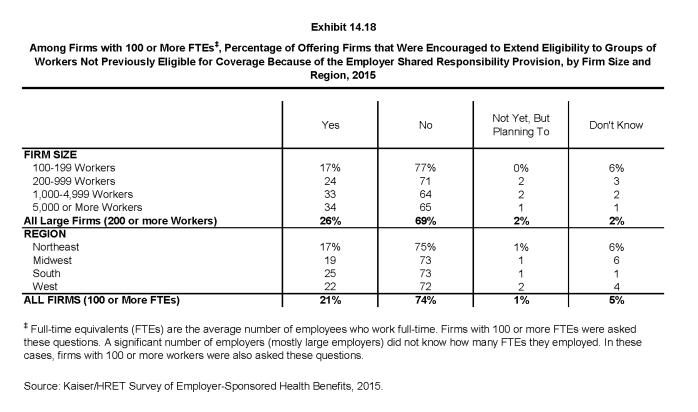
- Twenty-one percent of offering firms with 100 or more FTEs (or, if they did not know FTEs, firms with at least 100 employees) reported that the employer shared responsibility provisions encouraged them to extend eligibility for health benefits to workers or groups of workers that were not previously eligible for benefits (Exhibit 14.18).
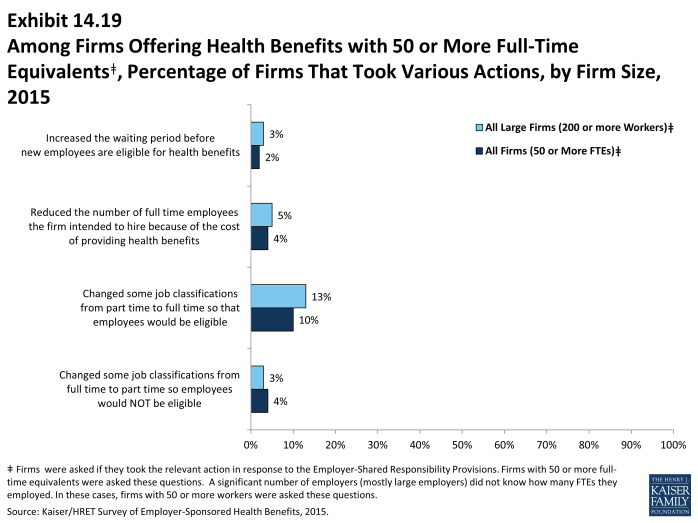
Firms with 50 or more FTEs (or, if they did not know how many FTEs, firms with at least 50 employees) were asked about changes to their workforce in response to the employer requirement.
- Four percent of these firms reported changing some job classifications from full-time to part-time so employees in those jobs would not be eligible for health benefits, and 10% of firms reported doing just the opposite and converting part-time jobs to full-time jobs (Exhibit 14.19).
- Four percent of these firms reported that they reduced the number of employees they intended to hire because of the cost of providing health benefits (Exhibit 14.19).

