Economic and Fiscal Trends in Expansion and Non-Expansion States: What We Know Leading Up to 2014
How Do Expansion And Non-Expansion States Compare? - Demographics
Introduction
This brief, prepared with the Rockefeller Institute of Government, is designed to provide insight into the underlying economic and fiscal conditions in expansion and non-expansion states leading up to 2014, providing a framework against which to measure the impact of expansion decisions going forward. Each section of this paper presents a series of charts illustrating the key findings between expansion and non-expansion states followed by a summary of the key findings. The sections focus on: demographics, tax capacity and revenue, state budgets and employment. Additional details on the methodology and the variables are included in Appendix A; also included is a summary of the findings is located in the Appendix summary table.
Key Findings
How do Expansion and Non-expansion States Compare? – Demographics
The demographic make-up of a state is a reflection of state fiscal conditions and affects state spending priorities. Several key factors include age, poverty and particularly for looking at expansion vs. non-expansion states, insurance coverage.
Age
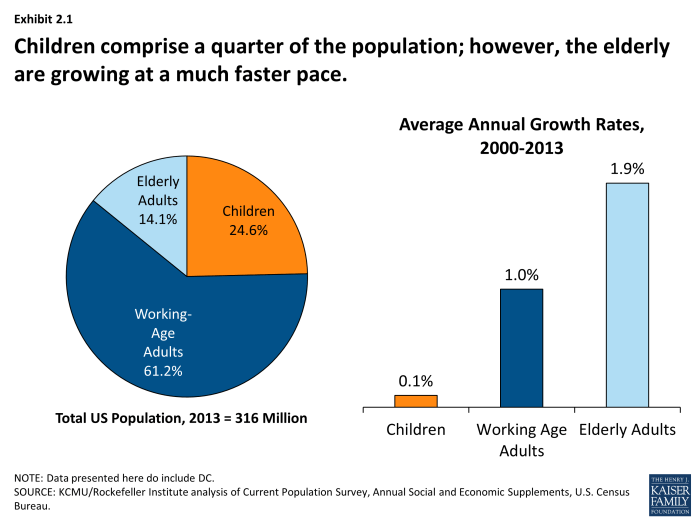
- Nationally, children make up nearly a quarter of the population, while the elderly represent almost one-seventh of the population. Since 2000, the growth among children has been relatively flat while growth among the elderly has been increasing at a faster pace. (Exhibit 2.1)
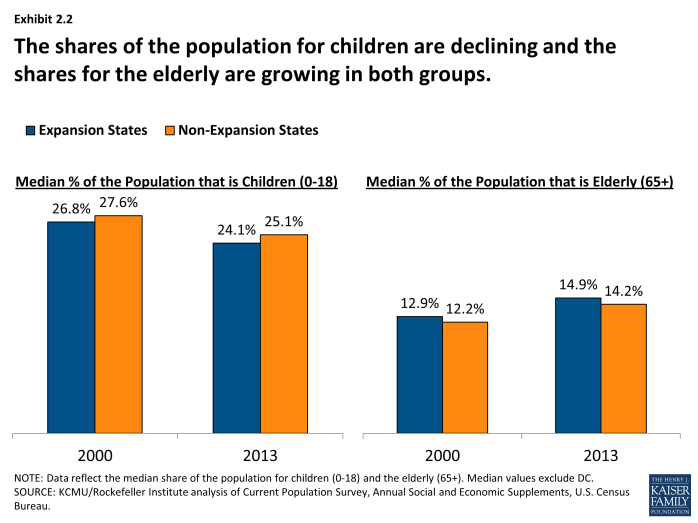
- The typical non-expansion state has a relatively higher share of the population that are children while the typical expansion state has a relatively higher share of the population that are elderly adults. Children as share of the total population is about 4% higher in a typical non-expansion state (25.1% vs. 24.1%) and people over age 65 as share of the total population is about 5% higher in a typical expansion state (14.9% vs. 14.2%). (Exhibit 2.2)
- From 2000 through 2013, both expansion states and non-expansion states have seen declines in the share of the population that are children and increases in the share that are elderly adults. (Exhibit 2.2)
Median Household Income
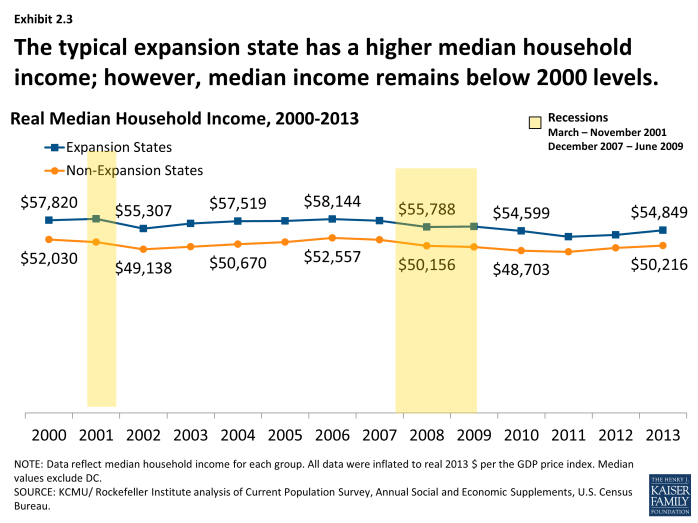
- Nationally, the real median household income had fallen from its pre-recession peak of over $56,000 to under $52,000 in 2012. Median household income in 2013 was still below pre-recession levels (as well as 2000 levels), but had started to increase slightly since 2012.
- The typical expansion state has historically had a higher real median household income than the typical non-expansion state. (Exhibit 2.3)
- Median household income in 2013 for the typical expansion and non-expansion states was below both pre-recession peaks and 2000 levels. (Exhibit 2.3)
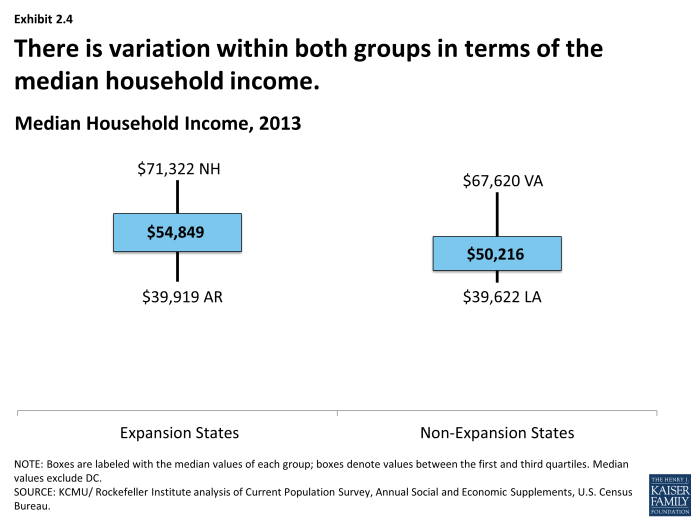
- There is also variation within each group; some non-expansion states (e.g. Virginia and Utah) had some of the highest median household incomes in 2013 while some expansion states (e.g. Arkansas and West Virginia) had some of the lowest median household incomes in 2013. (Exhibit 2.4)
Poverty Rate
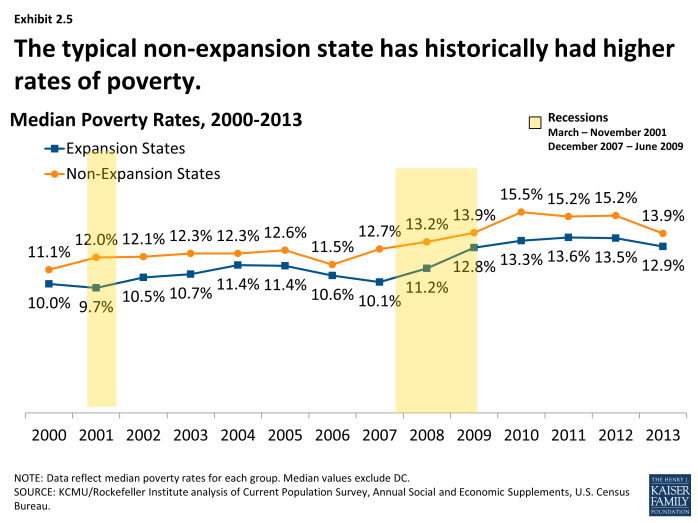
- Over the 2000-2013 period, the national poverty rate peaked in 2010 and has since slowly fallen to 14.5% in 2013.
- The typical non-expansion state has historically had a higher poverty rate than the typical expansion state. (Exhibit 2.5)
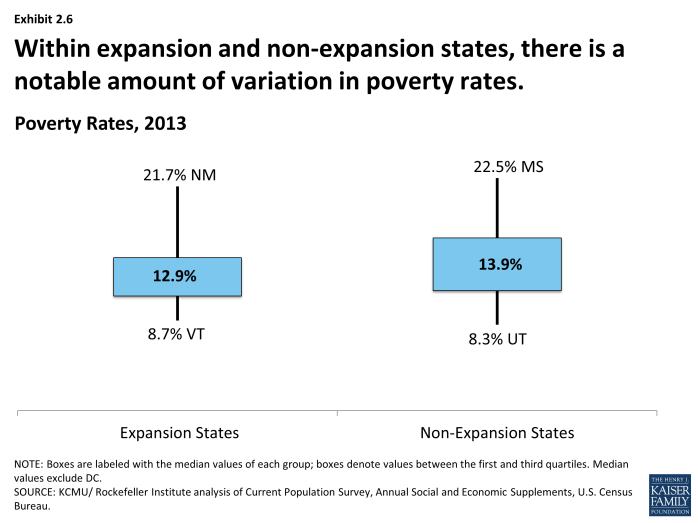
- There is also variation within each group; three of the highest-poverty states in 2013 were expansion states (Arizona, Kentucky, and New Mexico), while several non-expansion states had very low poverty rates, including South Dakota, Utah, and Virginia. (Exhibit 2.6)
Uninsured Rate
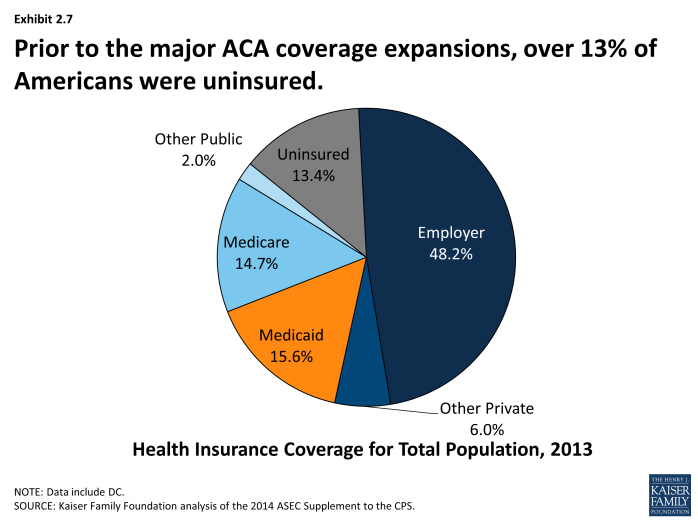
- Prior to the ACA’s major coverage expansions in 2014, over half of all Americans were enrolled in private health insurance (employer and other private coverage), 15.6% were enrolled in Medicaid, 14.7% were enrolled in Medicare and 13.4% were uninsured. (Exhibit 2.7)
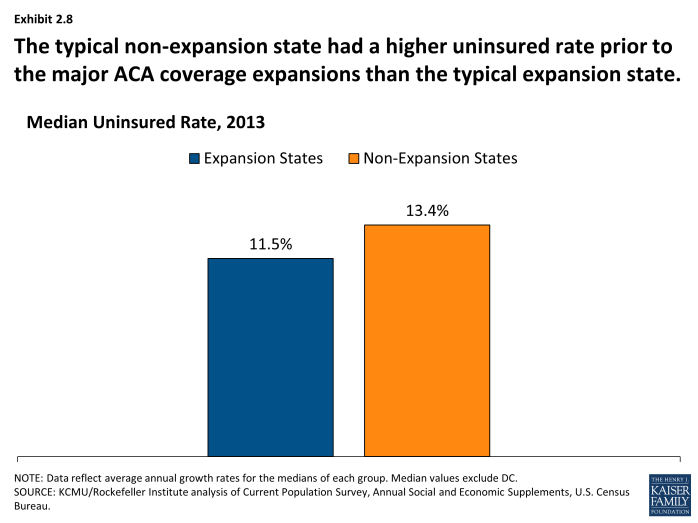
- The typical non-expansion state had a higher share of uninsured people prior to the ACA major coverage expansions than the typical expansion state. The number of uninsured people as share of total population was 13.4% in the typical non-expansion state, which is about 17% higher (13.4% vs. 11.5%) compared to the typical expansion state. (Exhibit 2.8)


