Coloradans’ Perspectives on Health, Quality of Life, and Midterm Elections
Appendix A: Survey Methodology
Survey Methodology
The Kaiser Family Foundation and Colorado Health Foundation Coloradans’ Perspectives on Health, Quality of Life and Midterm Elections was conducted by telephone August 15 – September 19, 2018 among a random representative sample of 1,803 adults age 18 and older living in the state of Colorado (note: persons without a telephone could not be included in the random selection process). Interviews were administered in English and Spanish, combining random samples of both landline (584) and cellular telephones (1,219, including 825 who had no landline telephone). Sampling, data collection, weighting and tabulation were managed by SSRS in close collaboration with Kaiser Family Foundation researchers. Colorado Health Foundation paid for the costs of the survey fieldwork, and Kaiser Family Foundation contributed the time of its research staff. KFF researchers led the survey design and analysis with frequent consultation with the CHF team.
The sampling and screening procedures included Registration-Based Sampling (RBS) and re-contact components, both designed to increase the number of registered voters and to specifically increase the number of Hispanic and Black registered voters. The sample included 464 respondents from the Registration-Based Sampling component, using an updated Colorado voter-registration database obtained through Aristotle. It also included 77 respondents who were reached by calling back respondents in Colorado who had previously completed an interview on either the SSRS Omnibus poll or the Kaiser Health Tracking Polls and indicated they fit one of the oversample criteria (either Black respondents or Hispanic registered voters living in Colorado).
The dual frame cellular and landline phone sample was generated by Marketing Systems Group (MSG) using random digit dial (RDD) procedures. All respondents were screened to verify that they resided in Colorado. For the landline sample, respondents were selected by asking for the youngest adult male or female currently at home based on a random rotation. If no one of that gender was available, interviewers asked to speak with the youngest adult of the opposite gender. For the cell phone sample, interviews were conducted with the qualifying adult who answered the phone.
A multi-stage weighting design was applied to ensure an accurate representation of the Colorado adult population. The first stage of weighting involved corrections for sample design, including accounting for the oversampling of registered voters and non-response within the RBS frame, a correction for the oversampling of telephone exchanges known to have higher incidences of Blacks and Hispanics, the likelihood of non-response for the re-contacted sample, and an adjustment to account for the fact that respondents with both a landline and cell phone have a higher probability of selection. In the second weighting stage, demographic adjustments were applied to the RDD sample to account for systematic non-response along known population parameters. Population parameters included gender, age, race, Hispanicity (broken down by nativity), educational attainment, phone status (cell phone only or reachable by landline), and state region. Based on this second stage of weighting, estimates were derived for registration status by race (Black, Hispanic, else) in the Colorado population. The last stage of weighting included RBS and re-contact respondents and included registration status by race based on the previous stage’s outcomes. Weighting parameters were based on estimates from the U.S. Census Bureau’s March 2016 American Community Survey (ACS), and telephone use (cell phone-only, landline-only, dual-user) was based on data for Colorado from the 2016 National Health Interview Survey. A final post-hoc adjustment was included in the weighting procedure to maintain consistency with existing health coverage estimates, based on Kaiser Family Foundation 2016 estimates for adults under 65.
The margin of sampling error including the design effect for the full sample is plus or minus 3 percentage points. For results based on subgroups, the margin of sampling error may be higher. Sample sizes and margins of sampling error for subgroups are available by request. Note that sampling error is only one of many potential sources of error in this or any other public opinion poll. Kaiser Family Foundation public opinion and survey research is a charter member of the Transparency Initiative of the American Association for Public Opinion Research.
| Group | N (unweighted) | M.O.S.E. |
| Total | 1803 | +/- 3 percentage points |
| Democrats | 571 | +/- 5 percentage points |
| Independents | 630 | +/- 5 percentage points |
| Republicans | 434 | +/- 6 percentage points |
| Total voters | 1585 | +/- 3 percentage points |
| Democratic voters | 528 | +/- 5 percentage points |
| Independent voters | 534 | +/- 5 percentage points |
| Republican voters | 404 | +/- 6 percentage points |
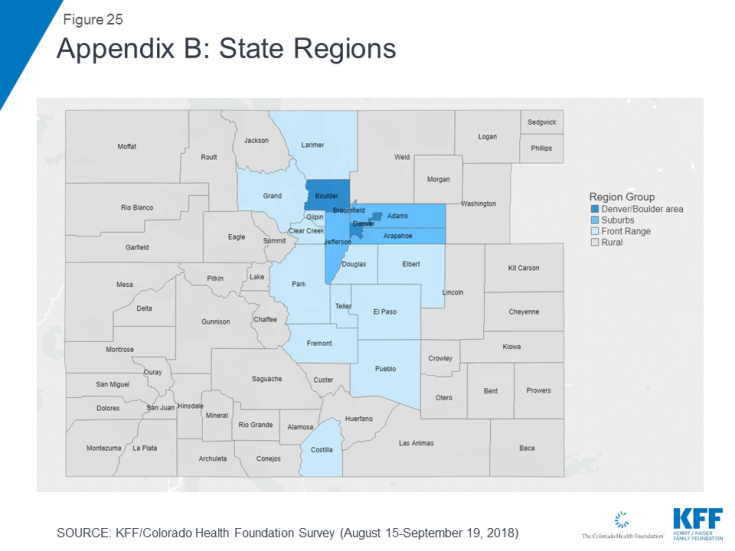
Appendix B: Regions of the State
In order to compare responses from different regions of the state, counties were categorized into four different regions: Denver/Boulder, Suburbs, Front Range, Rural. Some counties included in the Front Range category are categorized by the U.S. Census Bureau as “rural,” but for the purpose of this analysis in order to provide a more nuanced breakdown of the geographic area of the state, they were included in the Front Range category.
| Group | N (unweighted) | M.O.S.E. |
| Region | ||
| Denver/Boulder | 346 | +/- 7 percentage points |
| Suburbs | 532 | +/- 5 percentage points |
| Front Range | 625 | +/- 5 percentage points |
| Rural | 300 | +/- 7 percentage points |

