Assessing PEPFAR’s Impact: Analysis of Economic and Educational Spillover Effects in PEPFAR Countries

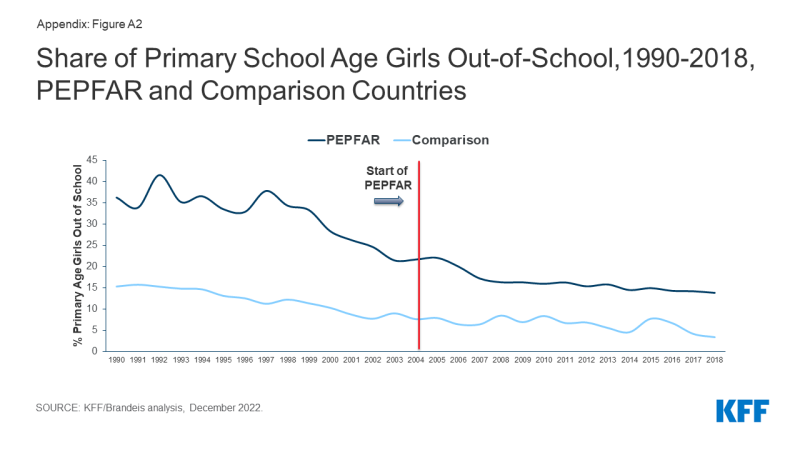
Figure A2: Share of Primary School Age Girls Out-of-School,1990-2018, PEPFAR and Comparison Countries

The independent source for health policy research, polling, and news.
William Crown, Jennifer Kates, Allyala Nandakumar, Gary Gaumer, and Dhwani Hariharan
Published:

Figure A2: Share of Primary School Age Girls Out-of-School,1990-2018, PEPFAR and Comparison Countries