A Primer on Medicare: Key Facts About the Medicare Program and the People it Covers
How much does Medicare spend, and how does current spending compare to past trends and the future outlook?
Spending on Medicare accounted for 14 percent of total federal spending in 2014.
Federal spending for fiscal year 2014 totaled $3.5 trillion, with net spending on Medicare (that is, Medicare spending minus income from premiums and other offsetting receipts) comprising 14 percent of the total (Figure 23). Of the three main entitlement programs—Social Security, Medicare, and Medicaid—Medicare is second largest in terms of the share of federal spending on each program. Social Security is largest, at 24 percent of federal spending in 2014. Spending on Medicaid (along with spending on the Children’s Health Insurance Program and Exchange subsidies) represented 9 percent of federal spending in 2014.
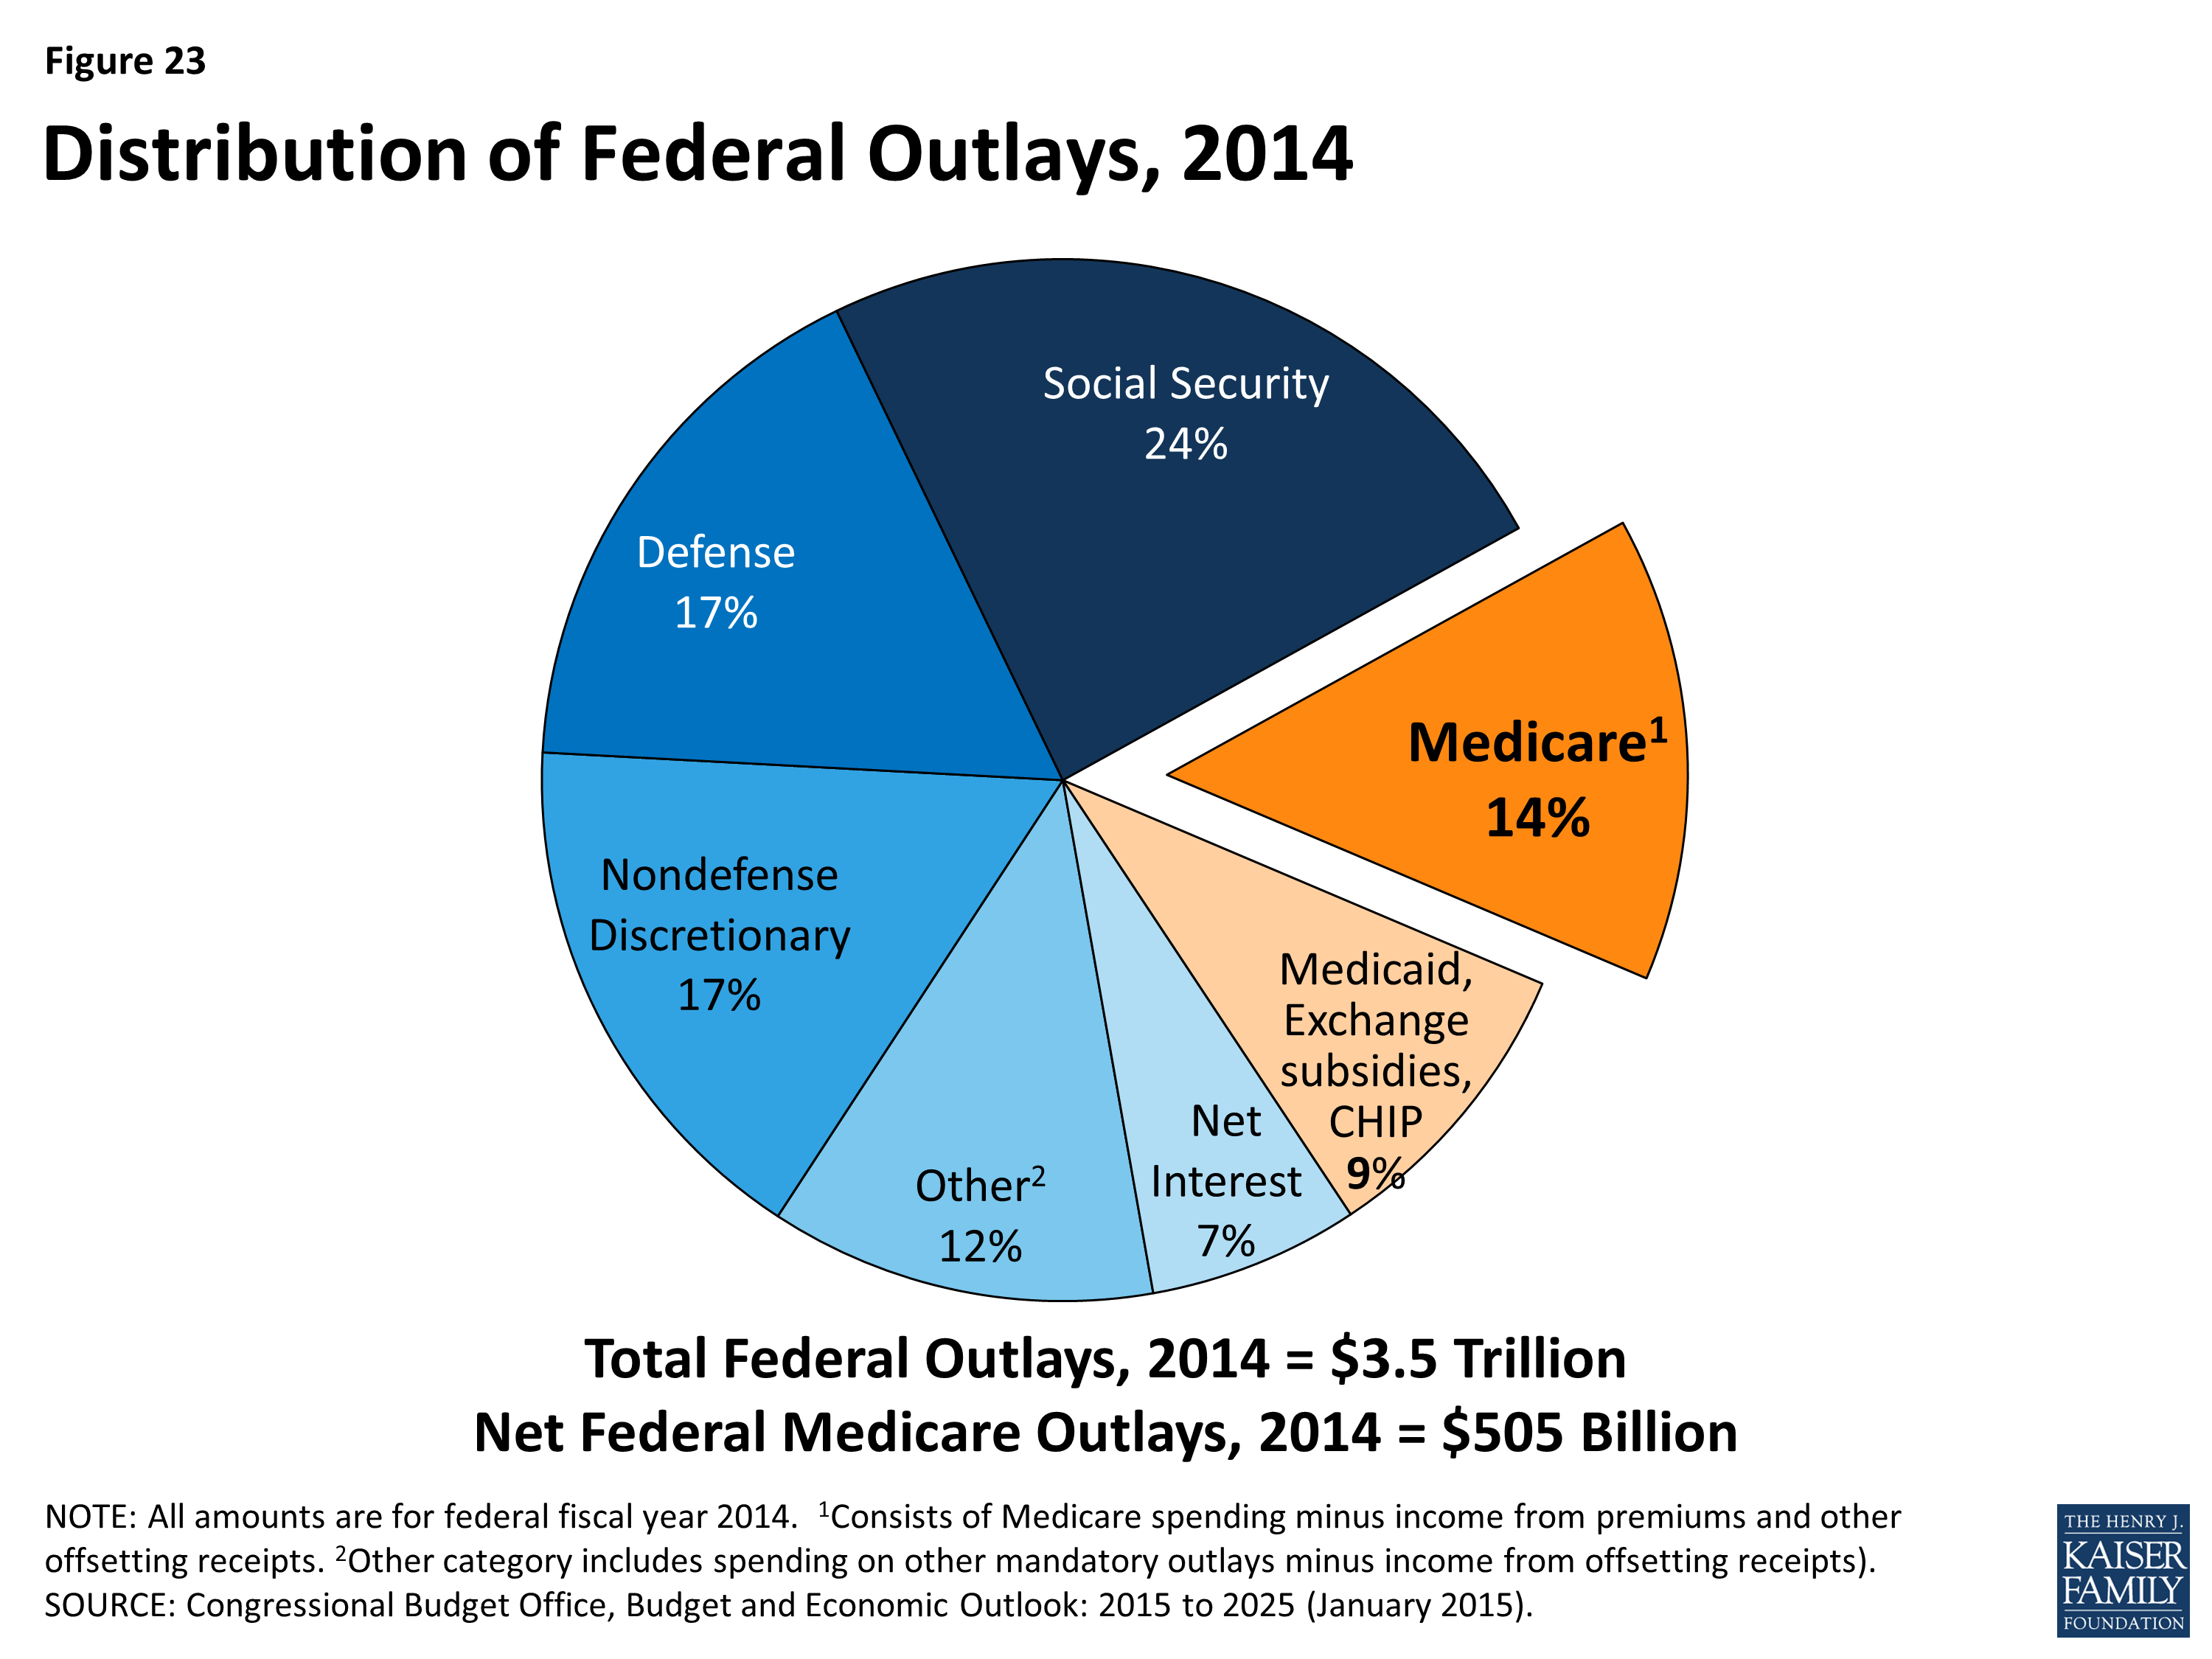
Figure 23: Distribution of Federal Outlays, 2014
Medicare benefit payments totaled $597 billion in 2014.
Medicare benefit payments totaled $597 billion in 2014; roughly one-fourth was for hospital inpatient services, 12 percent for physician services, and 11 percent for the Part D drug benefit (Figure 24). Just over one-fourth of benefit spending (26%) was for Medicare Advantage private health plans covering all Part A and B benefits; in 2014, 30 percent of Medicare beneficiaries were enrolled in Medicare Advantage plans.
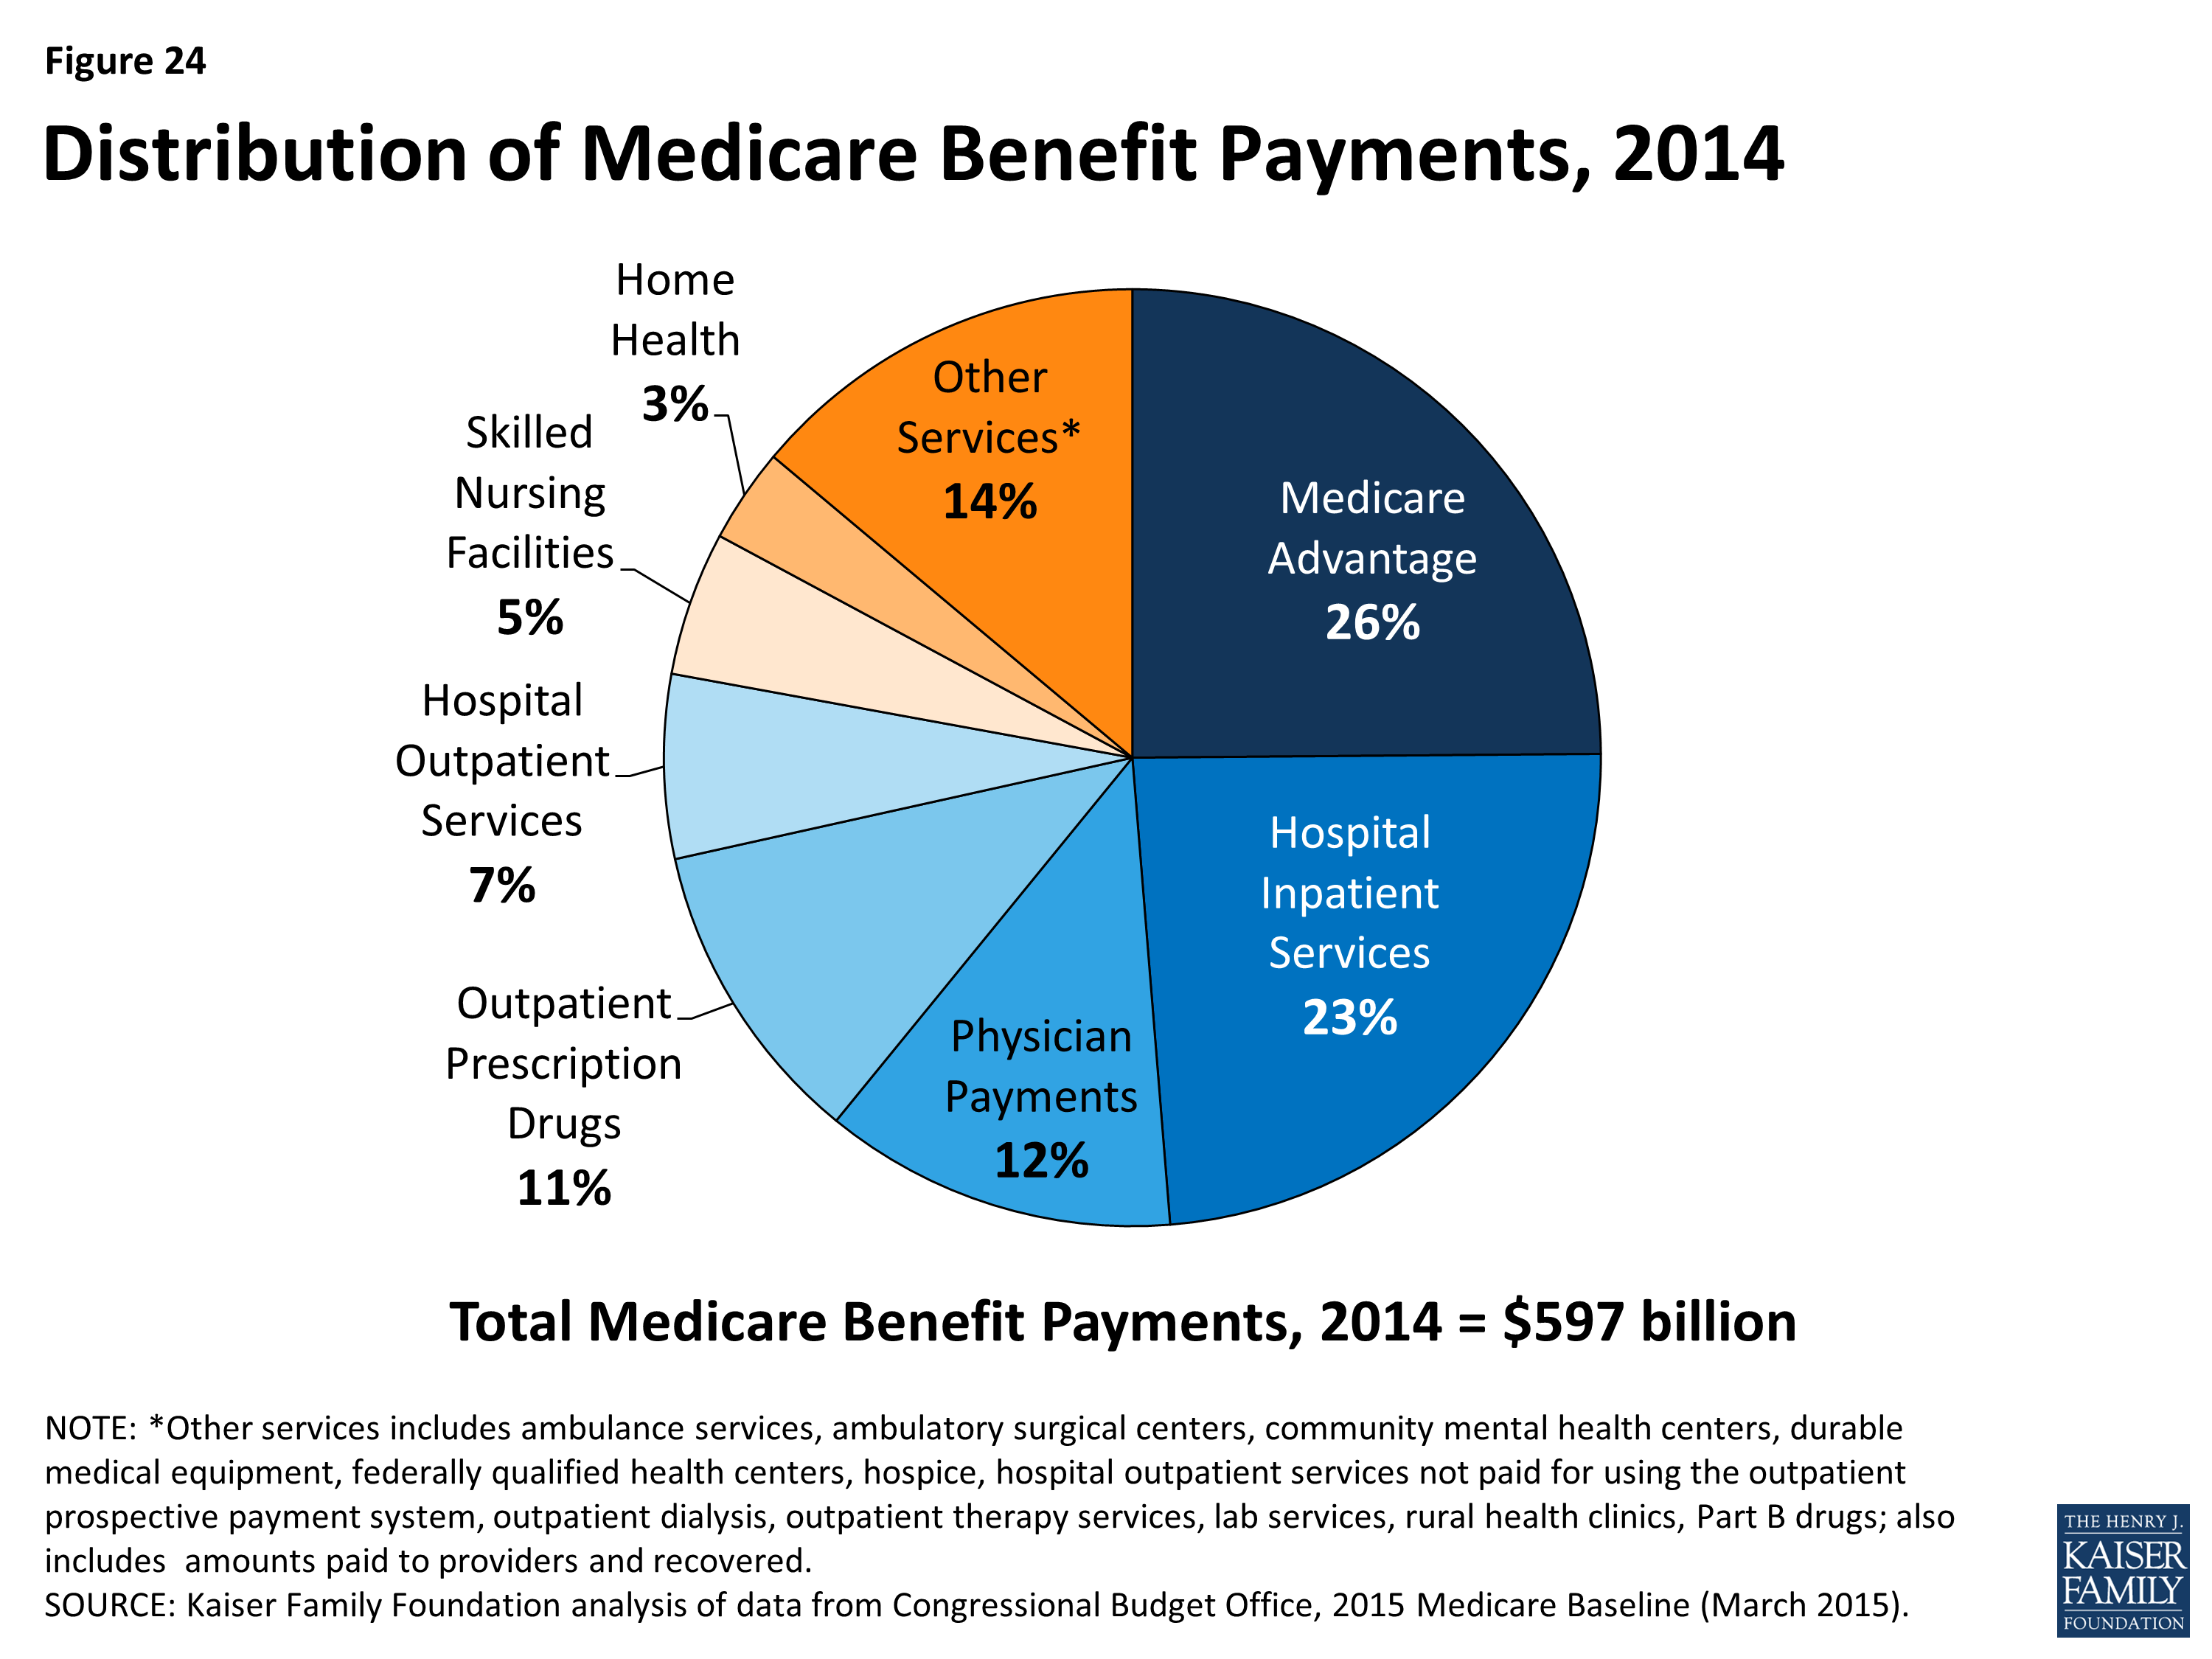
Figure 24: Distribution of Medicare Benefit Payments, 2014
Medicare spending is concentrated among a small share of beneficiaries.
A small share of Medicare beneficiaries accounts for a majority of Medicare spending. Ten percent of beneficiaries in traditional Medicare accounted for nearly 60 percent of Medicare spending in 2010 (Figure 25). At the other end of the spectrum, 30 percent of beneficiaries in traditional Medicare had total spending of less than $1,000, accounting for just 1 percent of total expenditures. Twelve percent of beneficiaries incurred no Medicare expenditures at all.
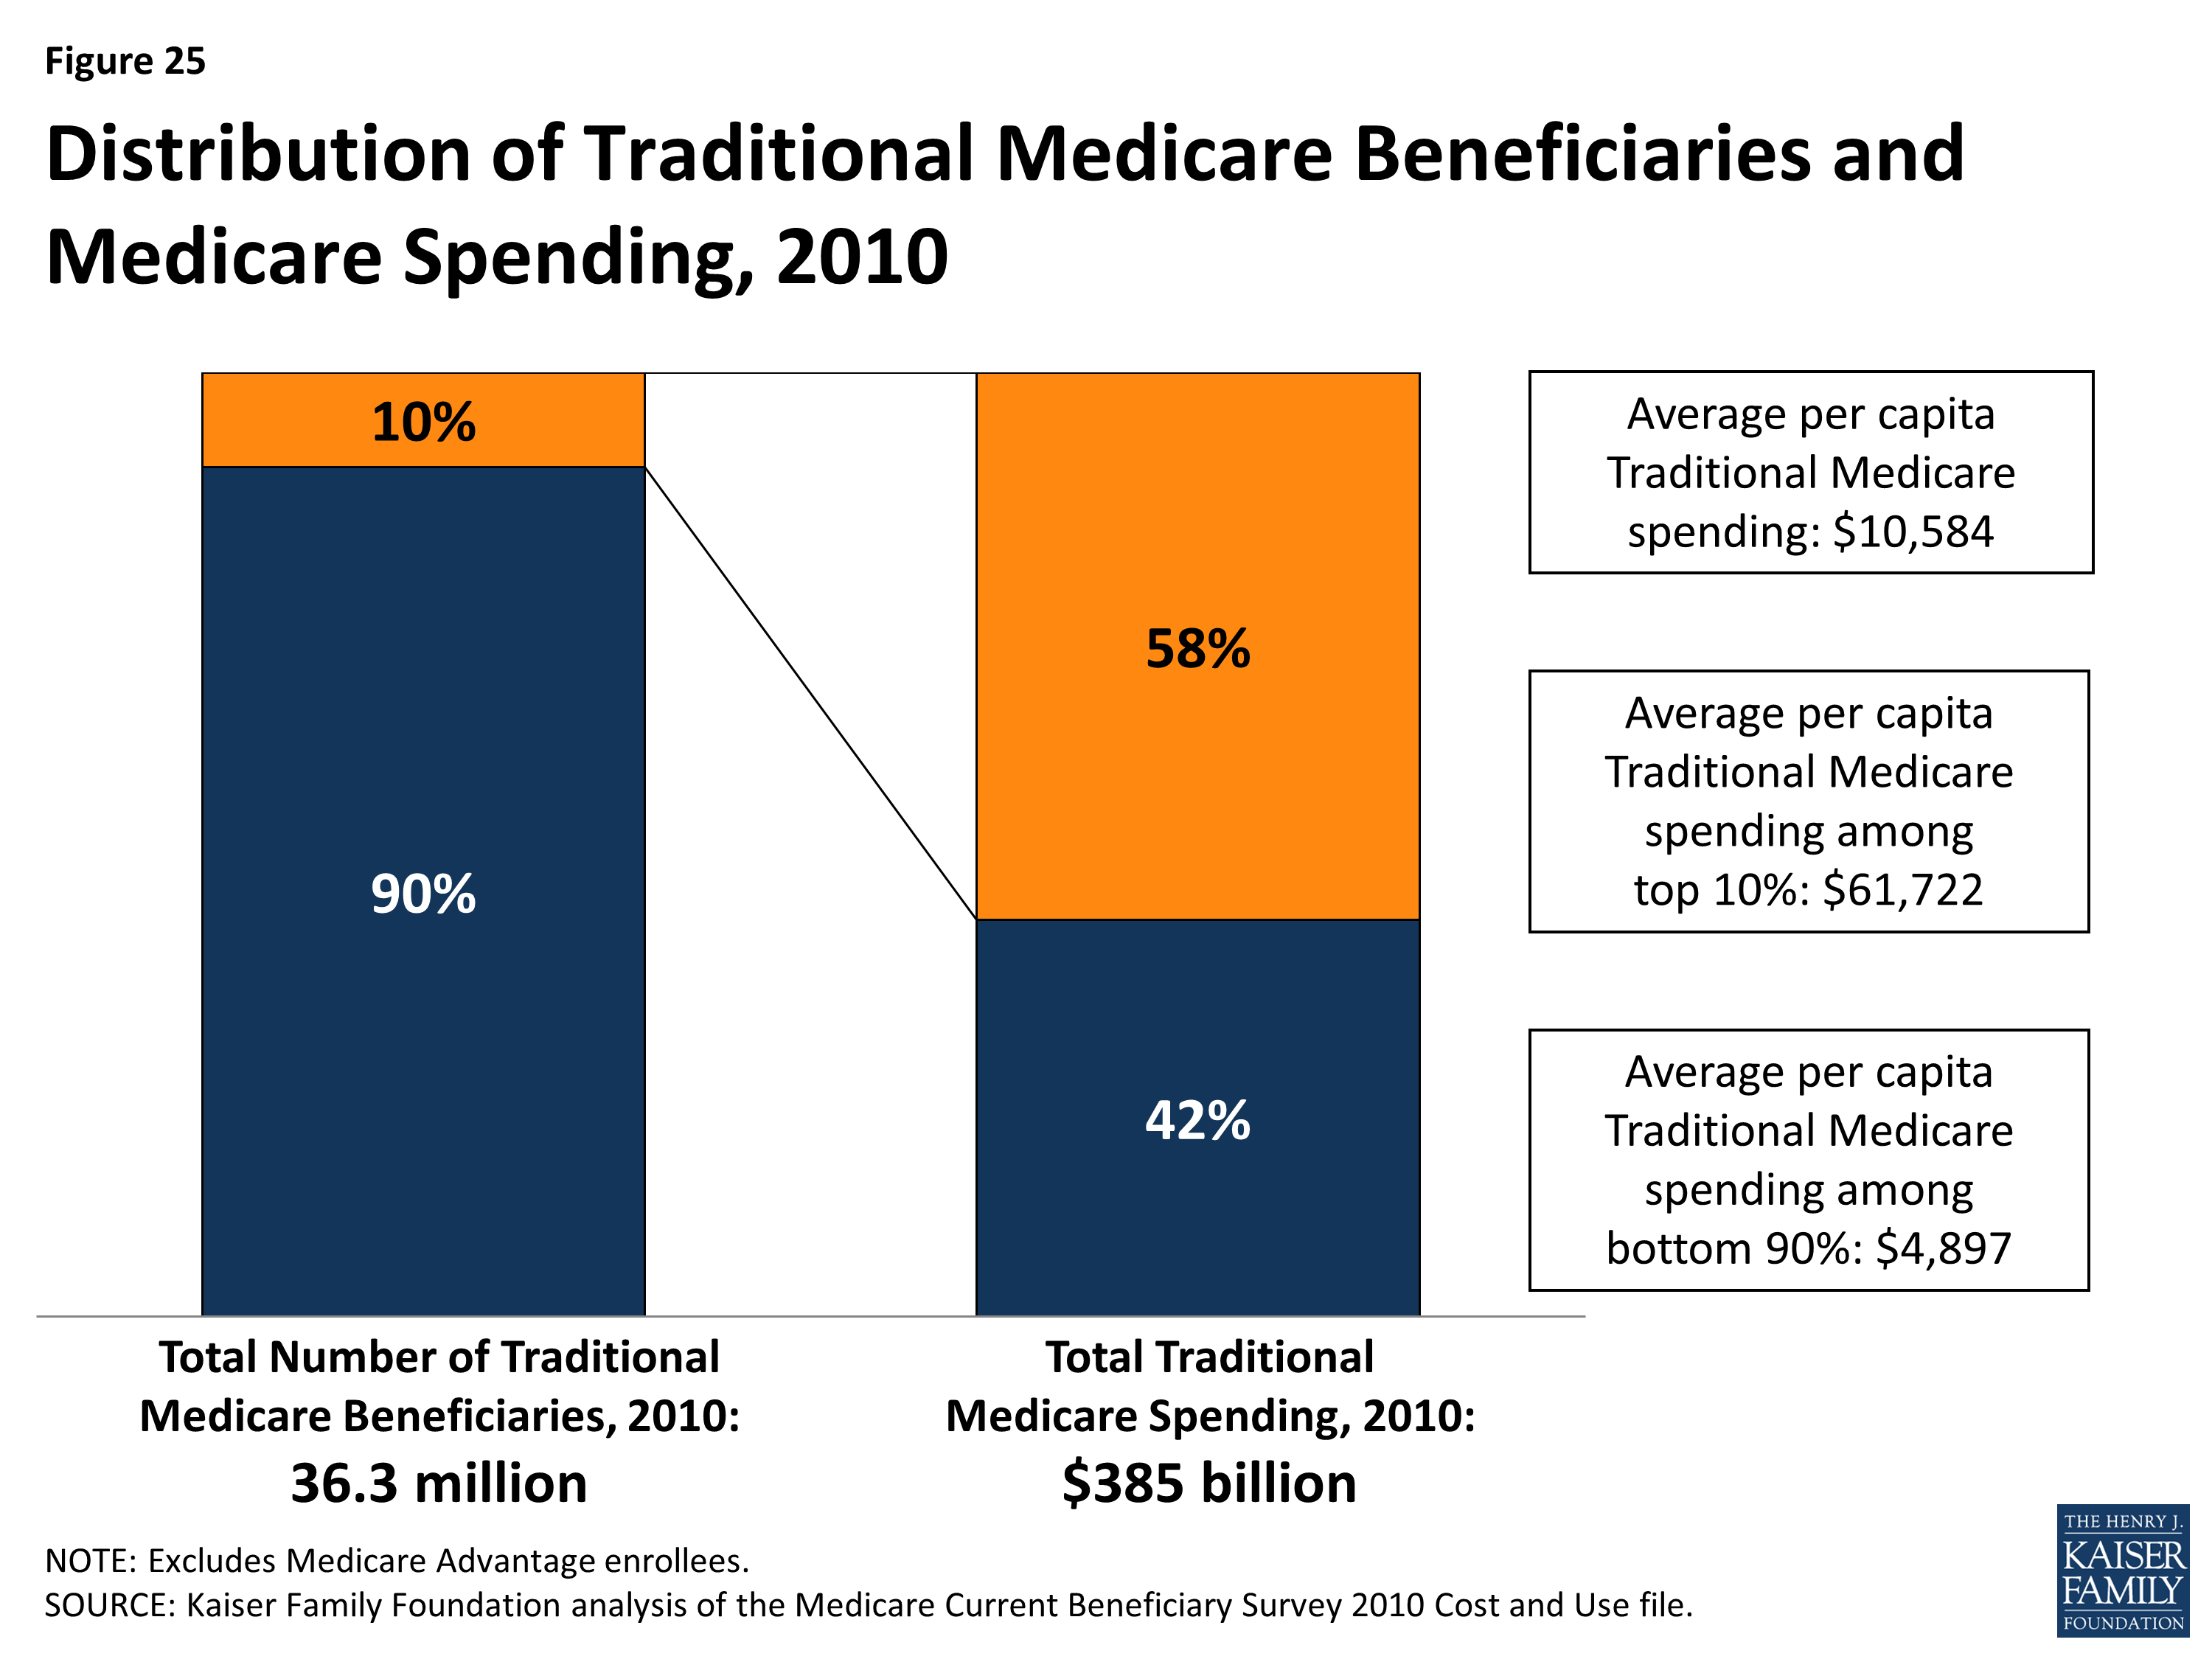
Figure 25: Distribution of Traditional Medicare Beneficiaries and Medicare Spending, 2010
Medicare spending accounted for one-fifth of the $2.5 trillion in personal health care expenditures in the U.S in 2013.
Medicare’s share of national personal health care expenditures varies by type of service, reflecting benefits covered and services used by the Medicare population. For example, in 2013, Medicare accounted for 43 percent of home health care spending and 26 percent of all hospital spending, but less than 1 percent of dental care spending (because traditional Medicare does not cover dental services) (Figure 26). Medicare accounted for 28 percent of total national prescription drug spending in 2013—a significant increase from 2 percent in 2005, the year before the Part D drug benefit went into effect.
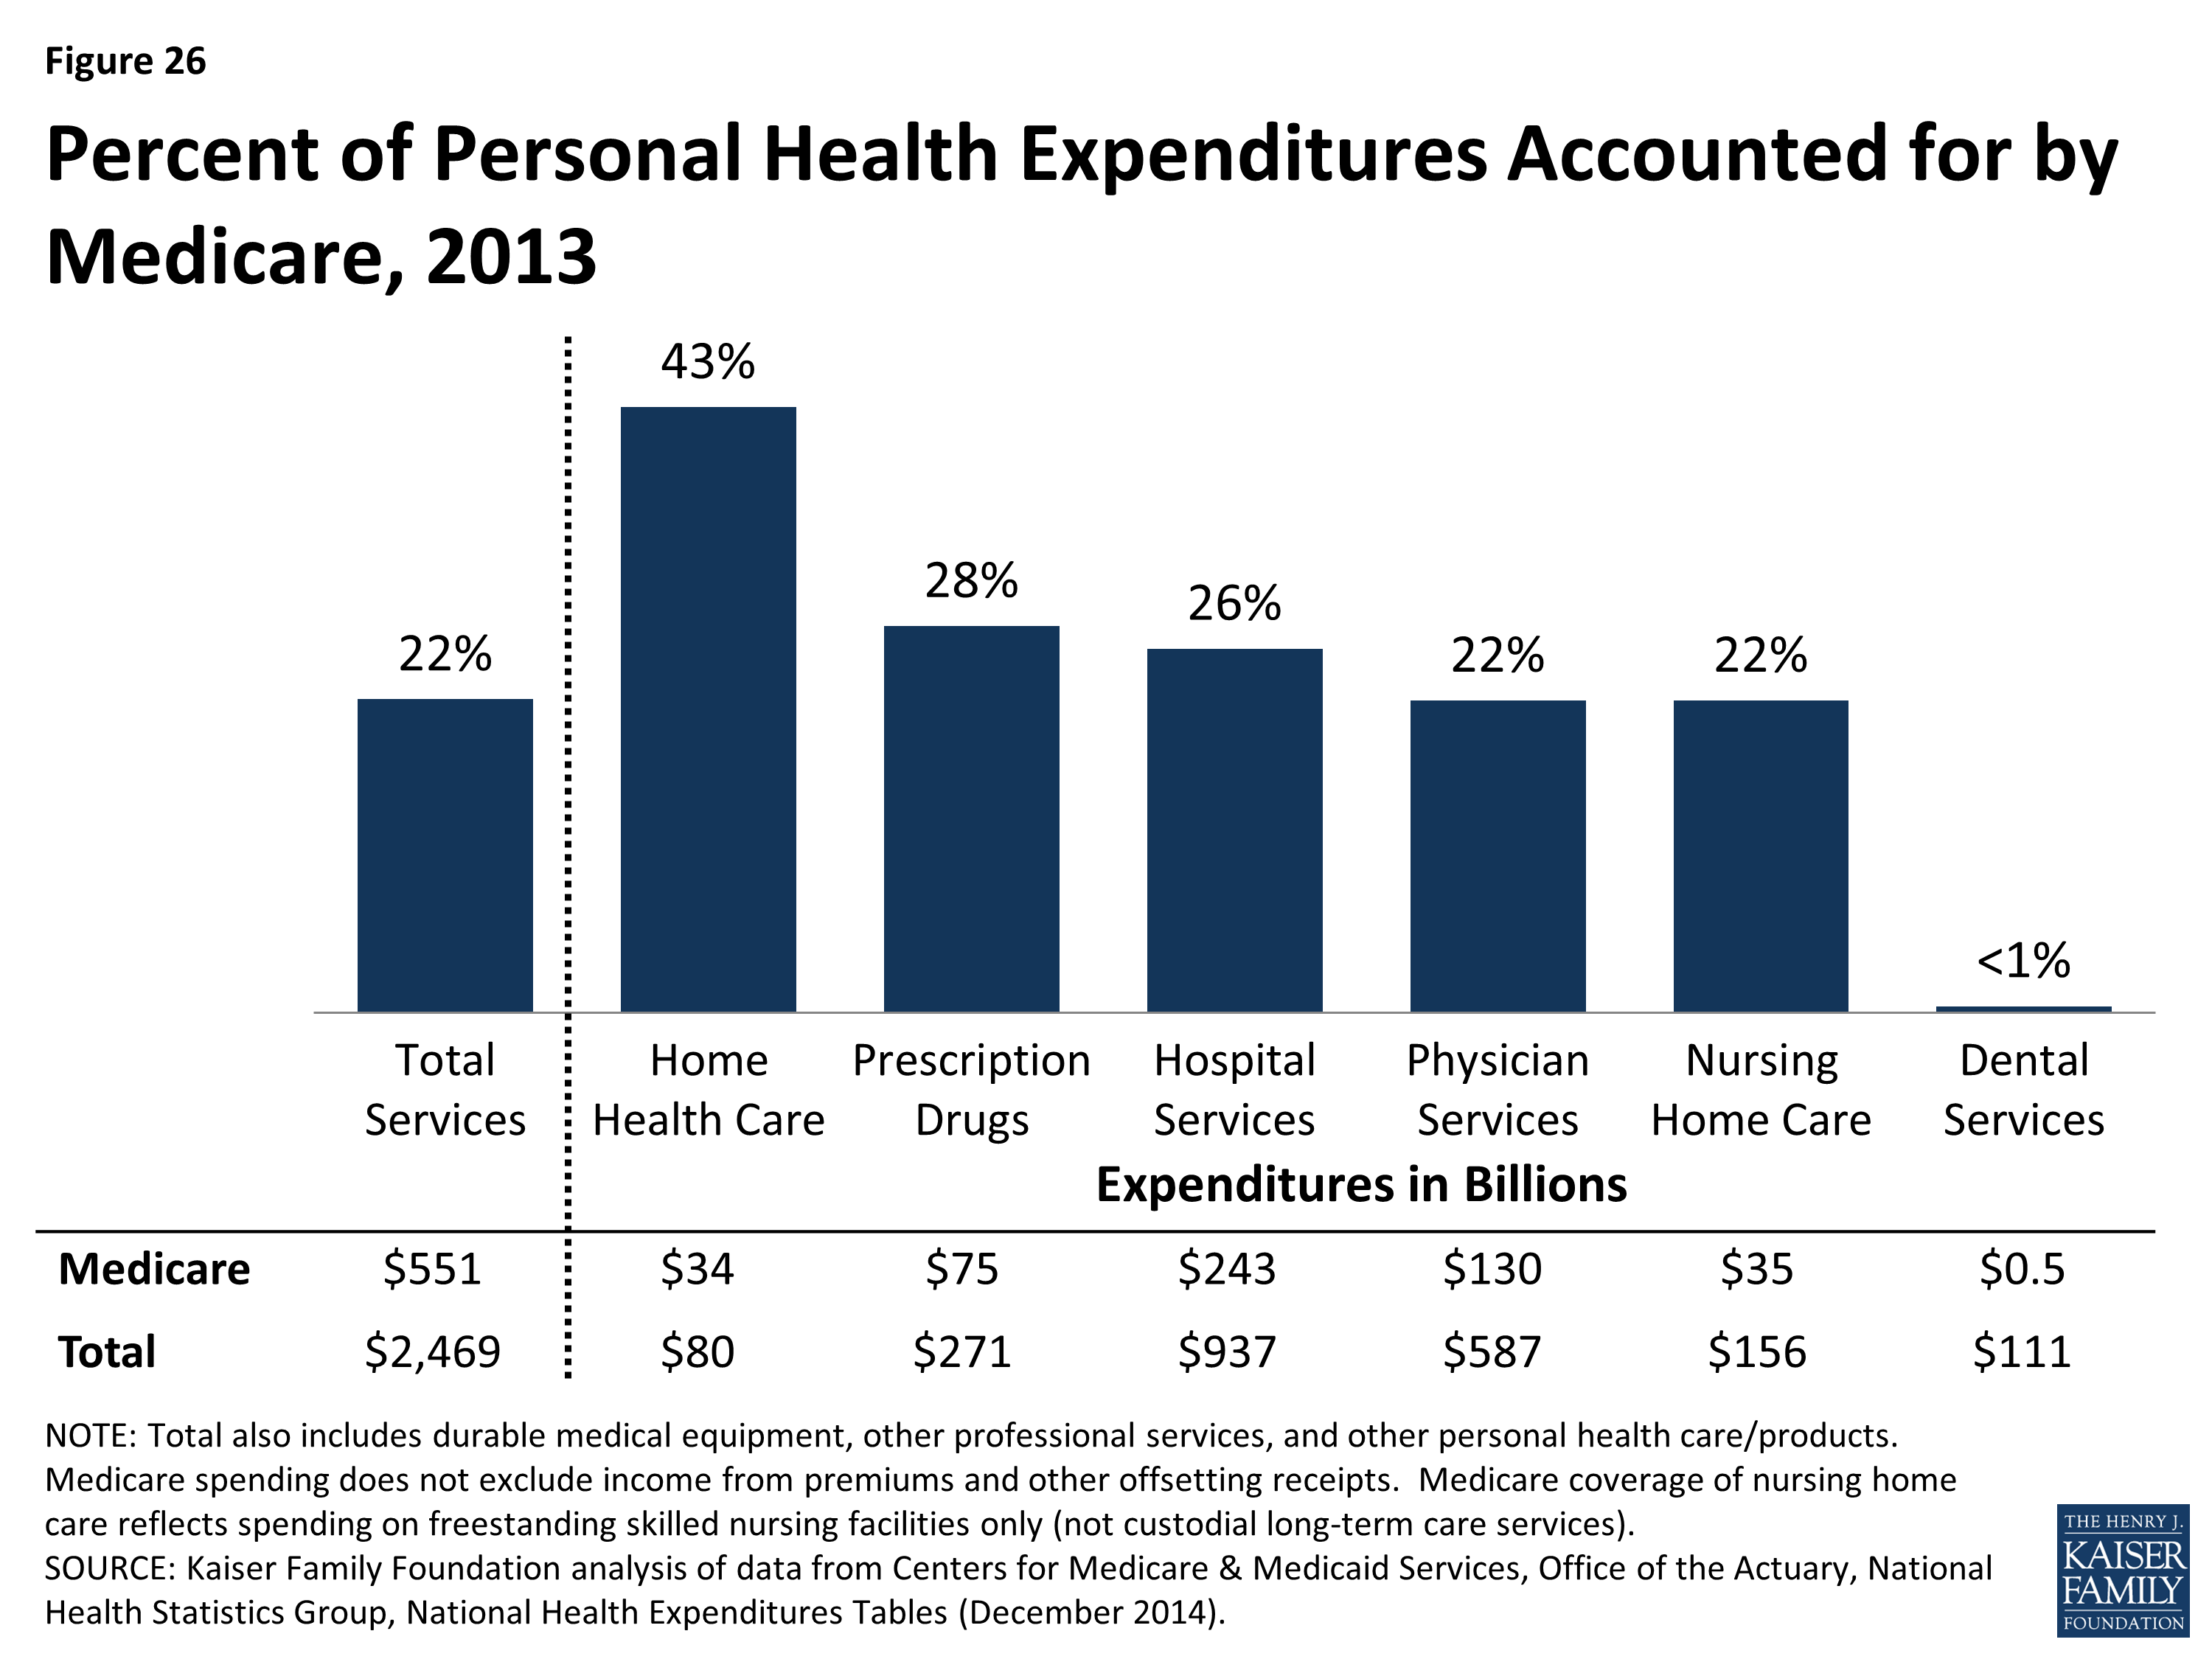
Figure 26: Percent of Personal Health Expenditures Accounted for by Medicare, 2013
Medicare spending is projected to nearly double from $527 billion in 2015 to $981 billion in 2025, according to CBO.
Looking ahead, net Medicare outlays (that is, Medicare spending minus income from premiums and other offsetting receipts) are projected to increase nearly two-fold from $527 billion in 2015 to $981 billion in 2025—an average annual growth rate of 6.4 percent in the aggregate—due to growth in the Medicare population and increases in health care costs (Figure 27). These estimates do not take into account additional spending that is likely to occur to avoid reductions in physician fees scheduled under current law. The growth in health spending, which affects all payers, is influenced by increasing volume and use of services, new technologies, and higher prices.
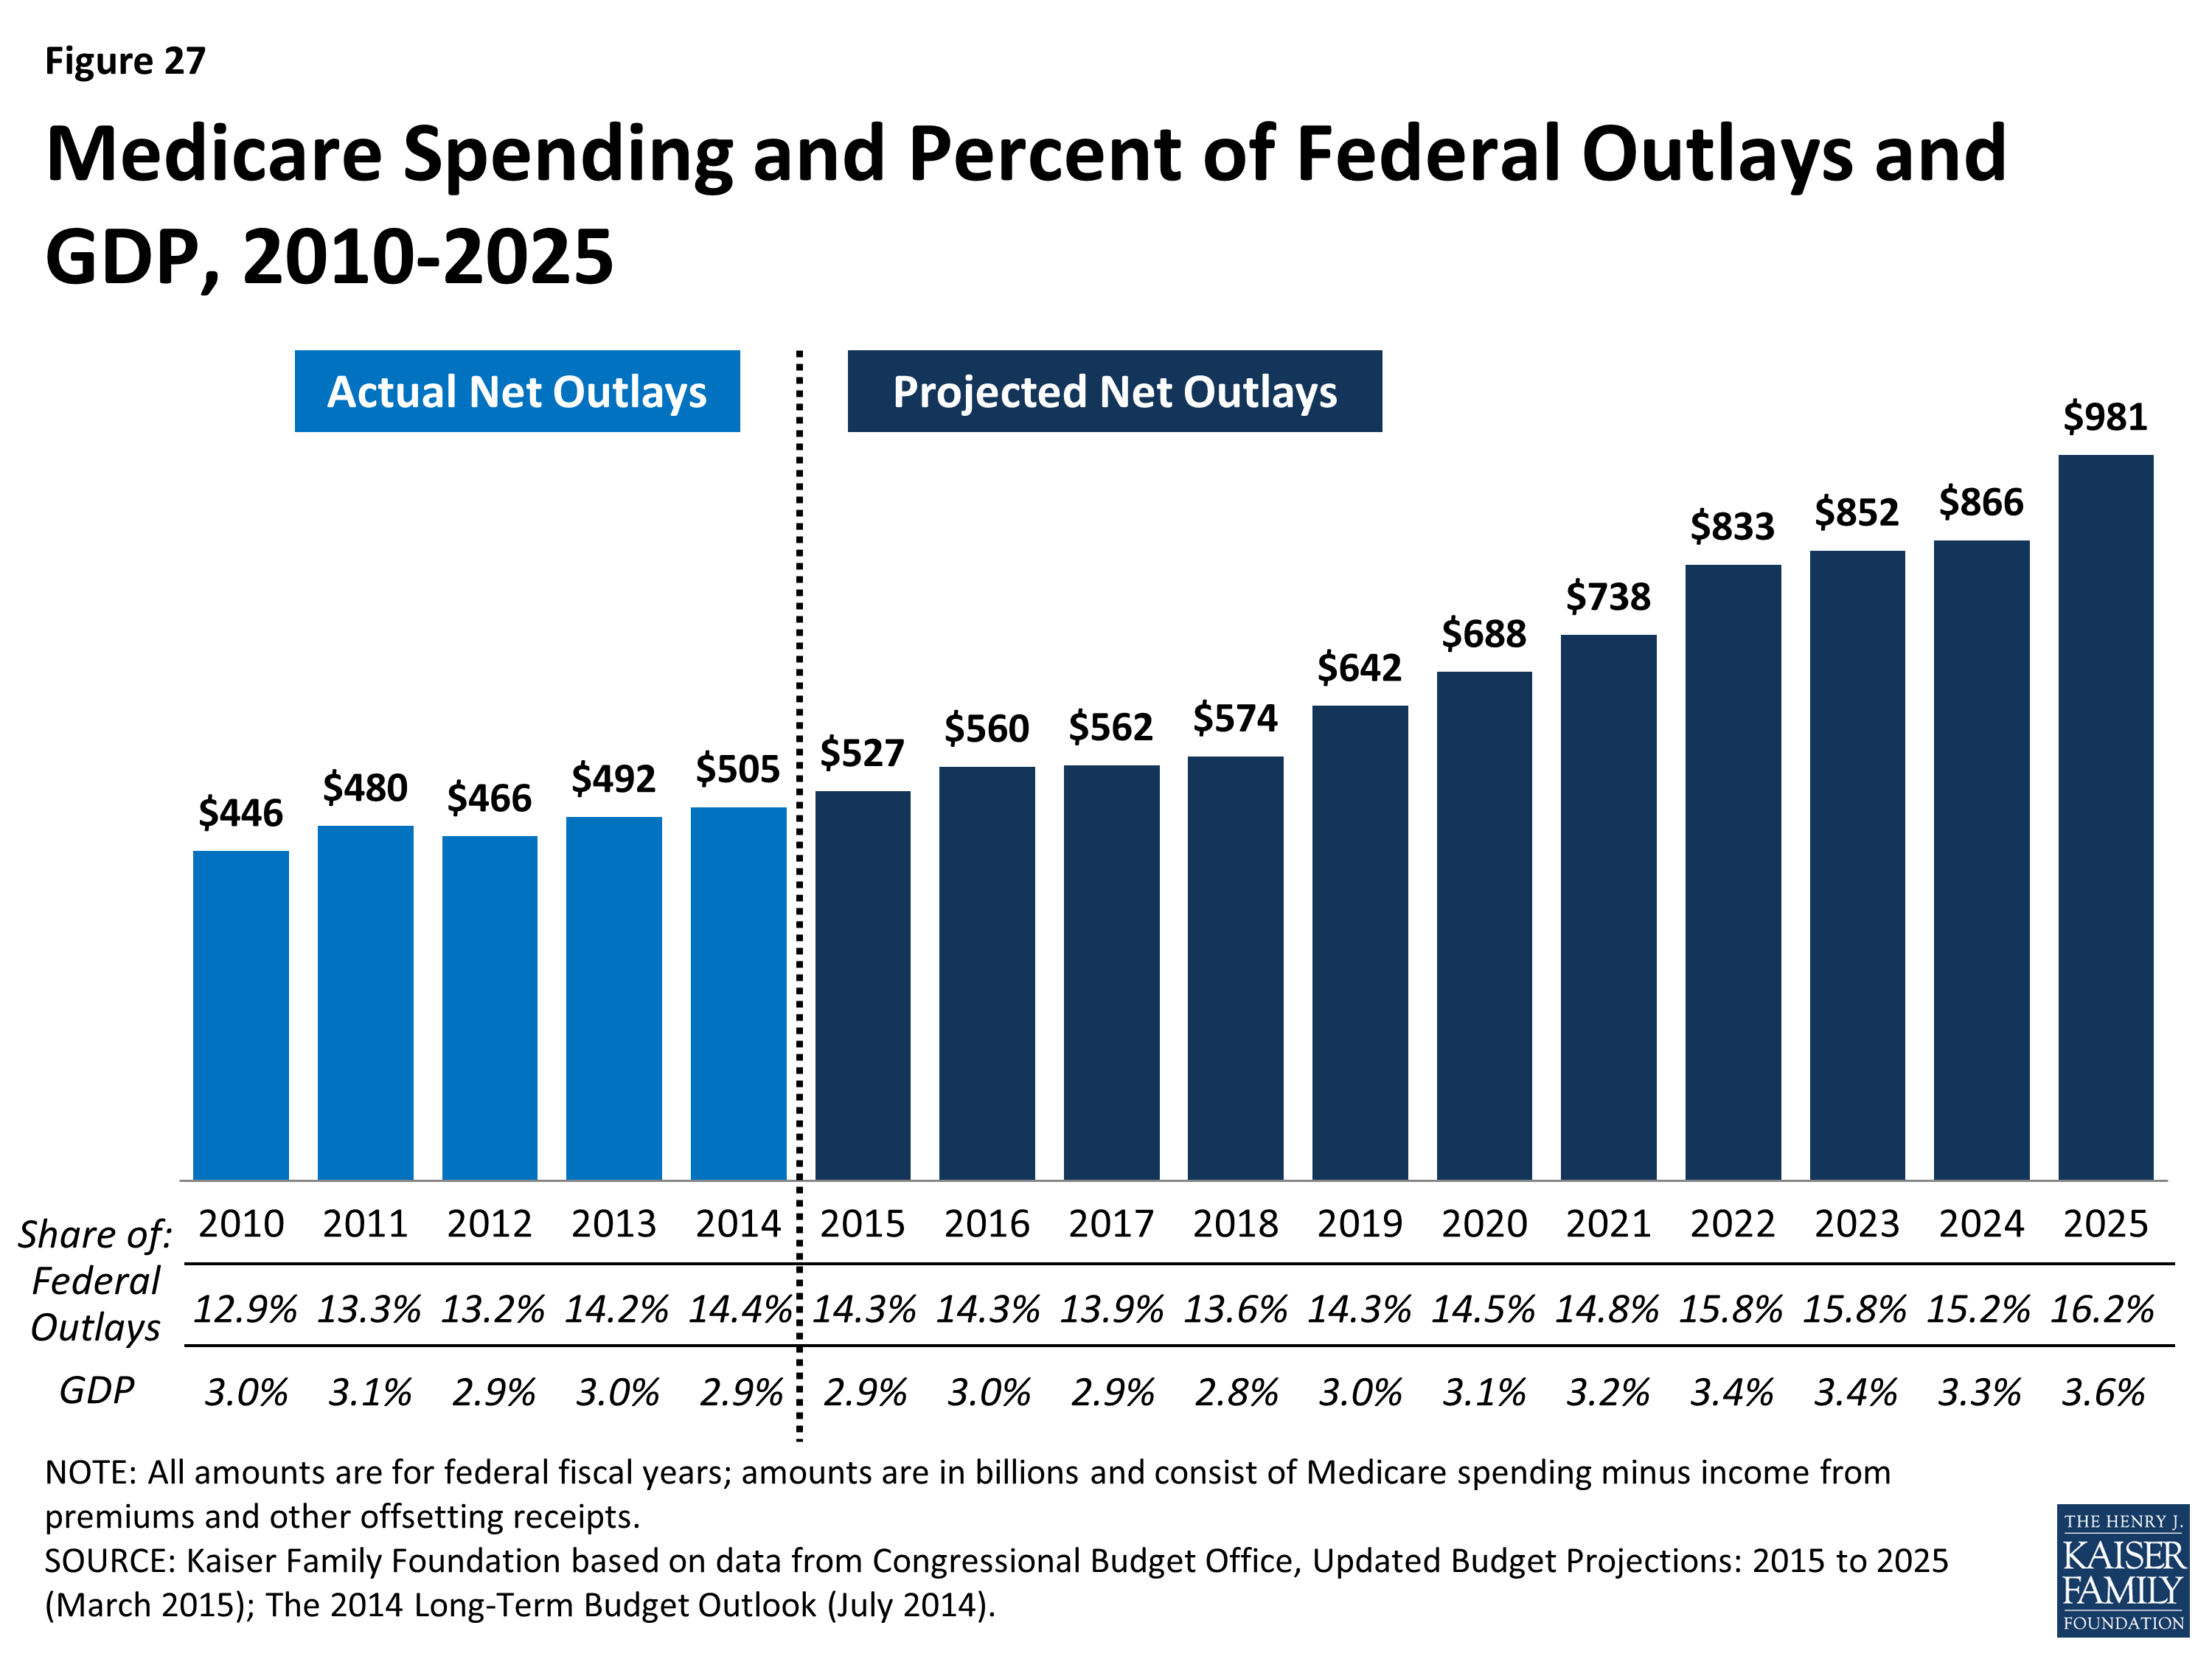
Figure 27: Medicare Spending and Percent of Federal Outlays and GDP, 2010-2025
Despite annual growth in outlays, net Medicare spending is projected to be a modestly larger share of the federal budget and the nation’s economy in the coming decade. Medicare’s share of the federal budget is projected to rise from 14.3 percent in 2015 to 16.2 percent in 2025, while Medicare spending as a share of GDP is projected to be 2.9 percent in 2015 and 3.6 percent in 2025.
In the short term, Medicare spending per person is expected to grow more slowly than it has in the past, more slowly compared to private health insurance spending growth, and in line with growth in the economy.
On a per capita basis, Medicare spending is projected to grow at a slower rate between 2014 and 2023 than it did between 2000 and 2013 (3.7 percent vs. 5.5 percent) (Figure 28). Medicare spending also is projected to grow more slowly than private health insurance spending on a per capita basis in the coming years (4.7 percent), and roughly in line with growth in GDP per capita (3.5 percent). The Congressional Budget Office has attributed Medicare’s slow per person growth rate in the short term to a larger share of younger beneficiaries as the baby boom generation ages onto Medicare; constraints on Medicare payment rates to plans, physicians, and other types of providers; and the overall slowdown in Medicare spending across different types of services, beneficiaries, and geographic areas.
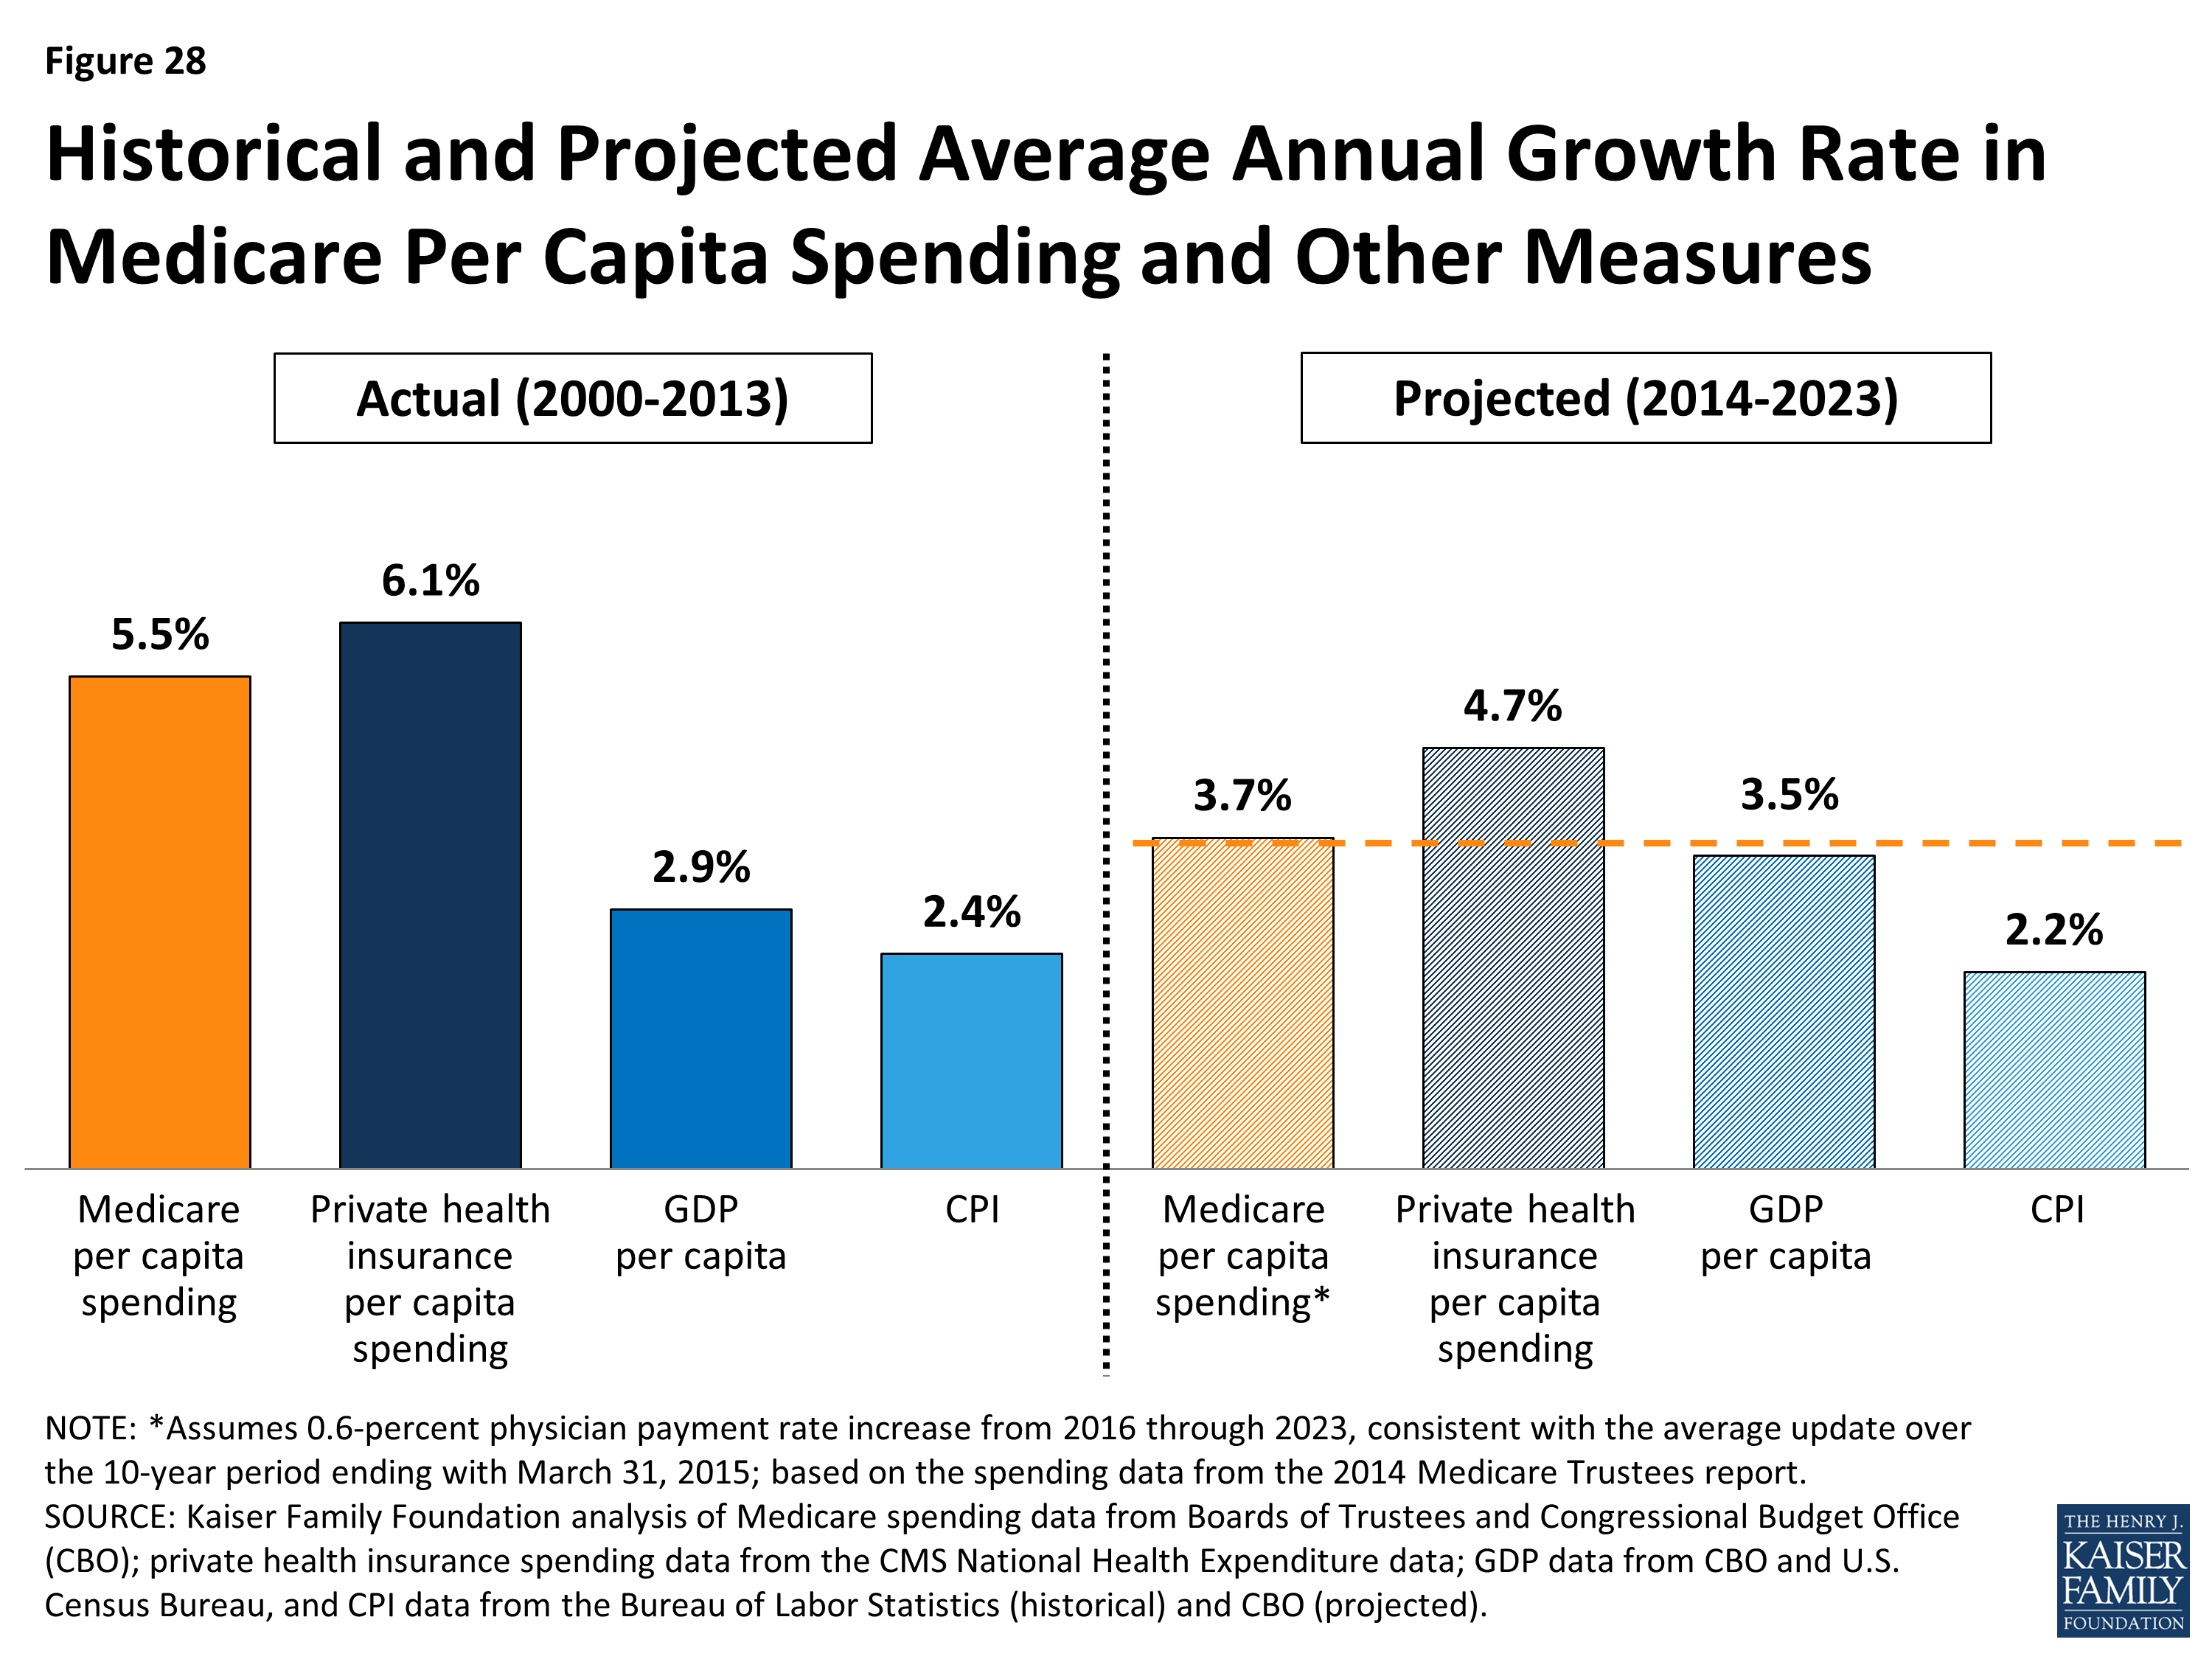
Figure 28: Historical and Projected Average Annual Growth Rate in Medicare Per Capita Spending and Other Measures
Over the longer term, both CBO and the Medicare Actuaries expect Medicare spending to begin to rise more rapidly due to a number of factors.
Medicare’s long-term spending trends are driven by the aging of the population, an increase in service use associated with greater severity of illness, and faster growth in health care costs than growth in the economy on a per capita basis. According to CBO’s most recent long-term projections, net Medicare spending will grow from 3.0 percent of GDP in 2014 to 3.8 percent of GDP in 2030, 4.7 percent in 2040, and 5.5 percent in 2050.1 Through 2039, CBO projects that the aging of the population will account for a larger share of spending growth on the nation’s major health care programs (Medicare, Medicaid, and subsidies for ACA Marketplace coverage) than either “excess” health care spending growth or expansion of Medicaid and Marketplace subsidies.