A Final Look: California's Previously Uninsured after the ACA's Third Open Enrollment Period
Executive Summary
The Kaiser Family Foundation California Longitudinal Panel Survey is a series of surveys that, over time, tracked the experiences and views of a representative, randomly selected sample of Californians who were uninsured prior to the major coverage expansions under the Affordable Care Act (ACA). The initial baseline survey was conducted with a representative sample of 2,001 nonelderly uninsured Californian adults in summer 2013, prior to the ACA’s initial open enrollment period.
After each enrollment period concluded, a survey was conducted of the same group of previously uninsured Californians who participated in the baseline (a longitudinal panel survey). The fourth and final survey in the series, and the focus of this report, followed up with them after the third open enrollment period in spring 2016 to find out whether more have gained coverage, lost coverage, or remained uninsured, what barriers to coverage remain, how those who now have insurance view their coverage, and to assess the impacts that gaining health insurance may have had on financial security and access to care. The surveys were designed and analyzed by researchers at KFF and the fieldwork costs associated with the spring 2014, spring 2015, and spring 2016 surveys were paid for by The California Endowment.
This longitudinal panel study allows us to follow a large group of randomly selected uninsured Californians and assess how their insurance status changed over time to learn more about why those changes did or did not occur, and what gaining health insurance means for their daily lives without having to rely on respondents’ ability to report and recall details from months or years ago. By tracking a scientifically representative panel, we can quantify how widespread or limited certain problems or changes that may have been reported anecdotally actually were. Statistically representative narratives and stories from individuals’ actual experiences can then be drawn from the sample to illuminate more accurately how the uninsured fare as the law is implemented in California.
Key Findings
Coverage Among Key Groups
After three rounds of open enrollment under the Affordable Care Act, 72 percent of Californians who were uninsured prior to the first open enrollment period now report that they have health insurance (including 78 percent of all eligible individuals). This is similar to the share who reported having insurance last year, after the second open enrollment period (68 percent). The largest share of California’s previously uninsured, one-third, say they have coverage through the state’s Medicaid program, Medi-Cal, while 21 percent say they have insurance through an employer, about one in ten (11 percent) say they have a plan through Covered California — the state’s health insurance marketplace where people can shop for and compare health insurance plans and access federal subsidies for coverage — and another 8 percent say they have non-group coverage or insurance through some other source.
By tracking the insurance status of these individuals over a period of four years, it is clear that the majority of individuals who get health insurance coverage keep some form of coverage. Sixty-three percent of habitual survey respondents report having had health insurance for a period of at least one year, including 48 percent who have had coverage for at least two years. In fact, 14 percent of the habitual respondents have unstable health insurance status, meaning that they have gained health insurance in the past two years and have subsequently lost their coverage. Of the individuals with unstable health insurance status, 5 percent gained coverage again but 9 percent remain without health insurance coverage.
Gains In Financial Security and Health Needs Being Met For Recently Insured
Overall, Californians who recently obtained health insurance are more likely to report that their health needs are being met today than they were in 2013. About three-fourths (77 percent) of those who report now having coverage after the third open enrollment period say their health needs are being met either “very” or “somewhat” well today, while half of them (49 percent) said the same thing when they were uninsured in summer 2013, prior to the first open enrollment period. This is compared to the remaining uninsured, among whom a similar share say their health needs are being met well today as did in 2013 (62 percent compared to 59 percent). In addition, 60 percent of insured Californians currently say it is difficult for them to afford health care. While this is still more than half, it is considerably smaller than the 85 percent of these individuals who reported the same in 2013. And while half (53 percent) of California’s recently insured are still “very worried” that they would not be able to pay medical bills in the event of a serious illness or accident, this is a smaller share than the percent of these who reported being “very worried” in 2013 (80 percent) and smaller than the share of the remaining uninsured who now report being “very worried” (72 percent).
Most Rate Plan Favorably, But Some Report Access Challenges
The majority of the recently insured say their experiences with their current health insurance plan have been positive. About one-third (31 percent) say their experiences have been very positive with an additional 48 percent saying their experiences have been somewhat positive. Only 15 percent say their experiences have been negative. Despite this, one-fifth of the recently insured report forgoing needed medical care in the past year due to cost. But this share is smaller than the share of those remaining without insurance (32 percent) who report not getting medical care due to costs. The share of those with insurance who have foregone medical care due to costs is similar across insurance type, with about one in five of those with Medi-Cal, Covered California, and employer-sponsored insurance saying they have not gotten care due to costs. In addition, some of the recently insured report problems accessing medical care. One-fourth of the recently insured say they have had to wait longer than a reasonable time to get an appointment for medical care and about one in ten (12 percent) say they have been told by a doctor’s office or clinic in the past 12 months that they would not be accepted as a new patient.
Remaining Uninsured Are Largely Long-Term Uninsured, Cite Costs As Reason For Not Getting Insurance
Although many previously uninsured Californians gained coverage since the health care law went into effect, 27 percent report that they do not currently have health insurance. Many of these remaining uninsured had little interaction with the health insurance system in the years prior to the ACA implementation. Nearly four in ten of the remaining uninsured reported in the baseline survey that they had been without health insurance for two or more years. When asked to say in their own words the main reason why they do not currently have health insurance, 47 percent of California’s remaining uninsured say it is because health insurance is too expensive and they can’t afford it. This is in spite of the fact that many of the remaining uninsured report a family income that makes them likely eligible for Medi-Cal (27 percent) or for financial assistance through Covered California (30 percent).
Hispanics Lag in Coverage
One-third of the Hispanic individuals included in the panel still do not have insurance. A significant portion of these uninsured Hispanics may not have insurance due to the fact that they are not eligible for coverage because of their immigration status. Of all eligible Hispanics in this survey, three-fourths (76 percent) report having health insurance, which is similar to the share of non-Hispanic whites who report having health insurance (80 percent).
Most Know About Health Care Law Fines, Fewer Know About Provisions
A large share (83 percent) of the remaining uninsured in California are aware of the health care law’s requirement that most Americans have health insurance or pay a fine, and most (54 percent) think that the requirement applies to them. Smaller shares of the remaining uninsured are aware of provisions of the health care law, beyond the requirement to have coverage, intended to expand coverage to the uninsured and those with lower-incomes. Just over half know that the law allowed for the expansion of the Medi-Cal program to cover more low-income Californians (54 percent), and half (49 percent) know that the law provides financial help to low- and moderate-income people to help them purchase health insurance coverage.
Introduction
This report is the fourth, and final, in the California Longitudinal Panel Survey series examining how previously uninsured Californians navigate the health care system as the Affordable Care Act (ACA) goes into effect. Prior to the enactment of the health care law, California had the largest nonelderly uninsured adult population in the nation, at nearly 6 million.1 The state eagerly adopted options under the ACA to expand coverage to more low- and moderate-income people, primarily through the development of Covered California, the state’s marketplace where people can shop for and compare health plans and access financial help to purchase insurance, and by expanding eligibility for Medi-Cal, the state’s Medicaid program, to include parents and adults without dependent children earning 138% of the federal poverty level (FPL) or less (about $33,534 annually for a family of 4 in 2016). As an early adopter with large numbers of uninsured, California is a particularly valuable place to track how the rollout of the health care law has impacted the state’s uninsured, and its progress and challenges can help inform future enrollment efforts state-wide and nationally.
To track the experiences and perceptions of California’s uninsured as the ACA is implemented, the Kaiser Family Foundation conducted the California Longitudinal Panel Survey series, following the same group of randomly selected Californians over time who were uninsured prior to the major coverage expansions under the ACA. The initial baseline survey was conducted with a representative sample of 2,001 nonelderly uninsured Californian adults in summer 2013, prior to the ACA’s initial open enrollment period.2 It found most of the state’s uninsured said they wanted insurance but that most didn’t think they could afford it, as the vast majority reported family incomes under 400% FPL (about $94,000 a year for a family of 4 in 2013). At that time, the first open enrollment period under the ACA was just a couple months away, and many of California’s uninsured were unaware of the upcoming coverage expansion opportunities and were unsure of how the law would impact them.
After the first open enrollment concluded in spring 2014, the second survey in the series followed up with the same group of previously uninsured Californians to find out whether they gained coverage or remained uninsured, how they felt about and interacted with the new coverage options, and what barriers to getting insurance remained.3 Many (58 percent) of California’s previously uninsured reported having health insurance at the close of the first open enrollment period. Most reported that shopping for coverage went smoothly; however, some expressed difficulty affording the cost of coverage. Still, about four in ten remained uninsured, despite the fact that many reported incomes that put them in the group likely eligible for Medi-Cal or for financial assistance through Covered California. The third survey in the series found recently insured residents reported very different experiences than they did in 2013 when they were uninsured, but many still reported problems paying for and accessing care.4
While the surveys are generally timed around the ACA’s open enrollment periods, it is important to note that eligible individuals are able to enroll in Medi-Cal year round. California has made considerable strides in enrolling eligible low- and moderate-income people in new coverage options under the ACA. By following a representative group of Californians who were uninsured prior to the ACA’s coverage expansions, a key target of the ACA, we can better understand how these new coverage opportunities have impacted this group’s ability to access coverage and gain insight into their interactions with these new pathways to coverage.
While the ACA makes it easier for some people to get and keep coverage, other people will move in and out of coverage due to job status changes, shifts in income that change their eligibility for public subsidies or coverage, or missed deadlines for enrollment. While many previously uninsured Californians now have insurance, other Californians who had insurance prior to the ACA’s coverage expansions may now be uninsured, a group whose experiences and movements within the health care system are not captured in this series of surveys. As a result, this survey does not estimate the overall change in the number of uninsured Californians since the start of open enrollment but instead estimates the share of previously uninsured who gained coverage.
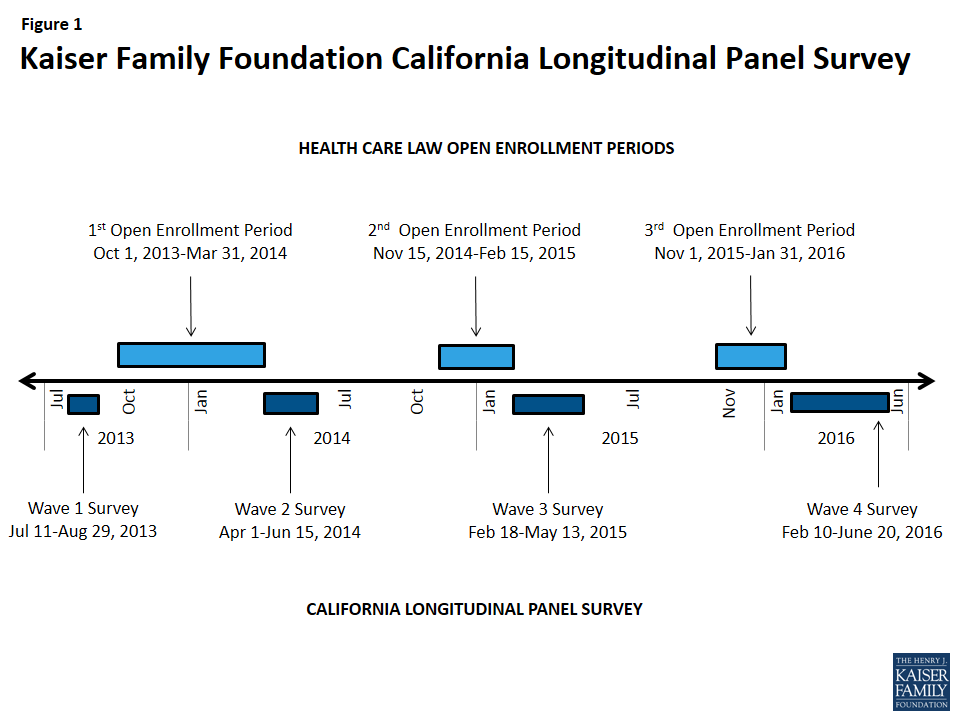
Figure 1: Kaiser Family Foundation California Longitudinal Panel Survey
Section 1: Coverage among the Previously Uninsured
Enrolling in Health Care Coverage
After three rounds of open enrollment under the Affordable Care Act, 72 percent of Californians who were uninsured prior to the first open enrollment period now report that they have health insurance. This is similar to the share who were insured after the second open enrollment period (68 percent), which may indicate a stabilizing of health insurance coverage. About one-fourth (27 percent) report being currently uninsured, a group referred to throughout this report as the “remaining uninsured.” Excluding those who are likely ineligible for coverage under the ACA due to their immigration status,1 78 percent of California’s eligible uninsured now report having coverage.
For the purposes of this report, the “eligible uninsured’” are California residents who said they had been uninsured for at least two months in the baseline survey and would be eligible for participation in the ACA coverage expansion based on their self-reported status as a citizen, permanent resident, or lawfully present immigrant.2
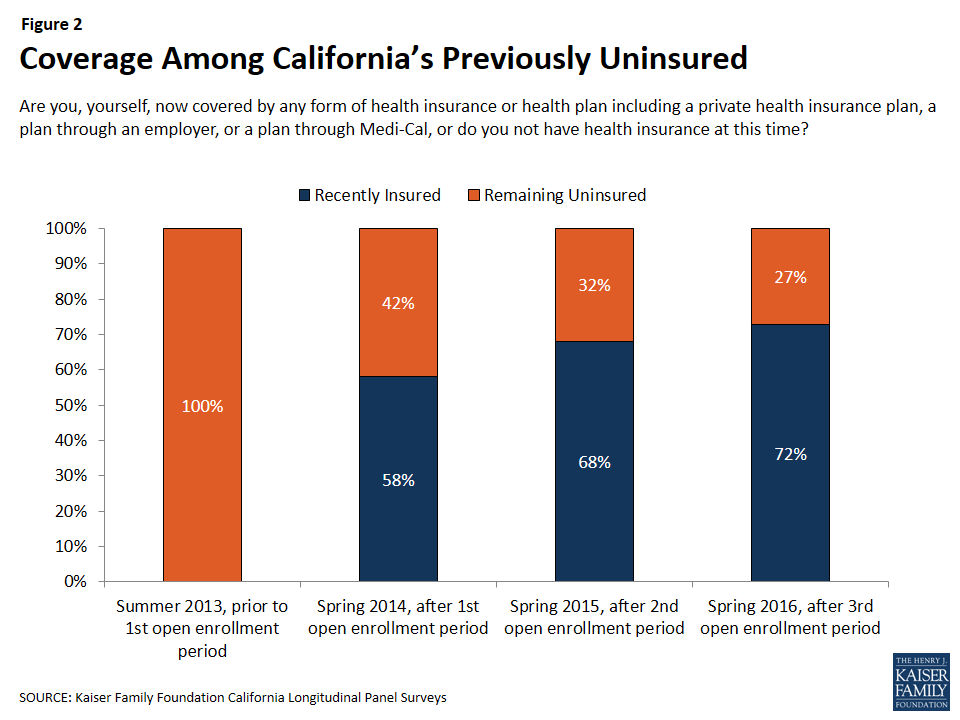
Figure 2: Coverage Among California’s Previously Uninsured
Those previously uninsured Californians who report after the third open enrollment period that they have health insurance (72 percent), referred to throughout this report as “California’s recently insured,” say they gained coverage from several different sources. The largest share of California’s previously uninsured (33 percent) say they have coverage through the state’s Medicaid program, Medi-Cal, which is similar to the share reported in 2015 (34 percent). One in five say they have insurance through an employer, up from 14 percent in 2015. About one in ten (11 percent) say they have a plan through Covered California, the state’s health insurance marketplace where people can shop for and compare health insurance plans and access federal subsidies for coverage, and another 8 percent say they have non-group coverage or insurance through some other source.3
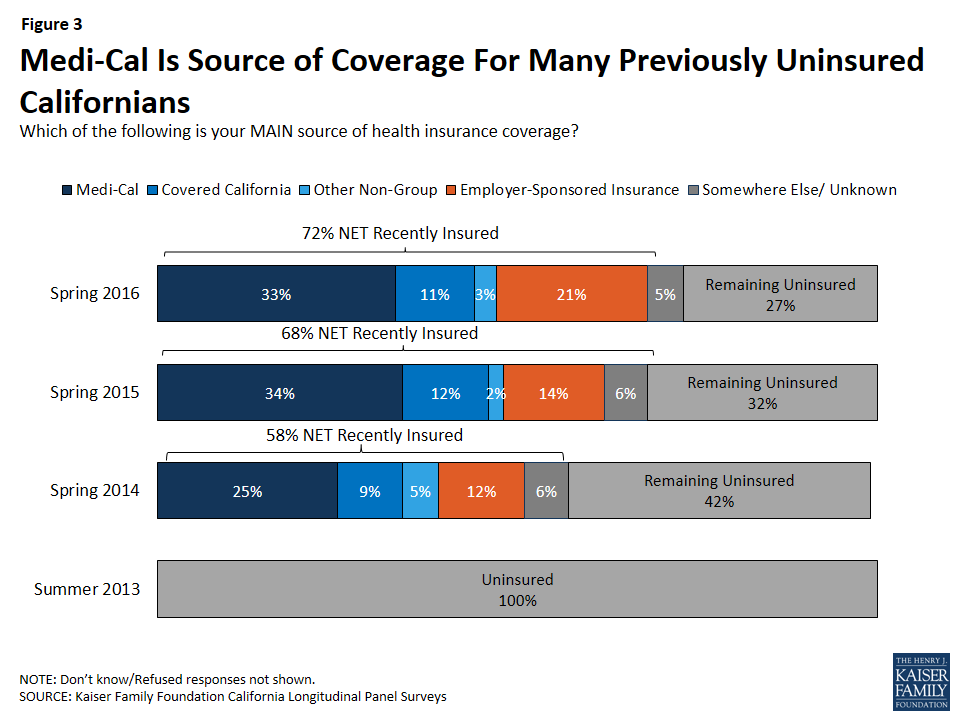
Figure 3: Medi-Cal Is Source of Coverage For Many Previously Uninsured Californians
Who Now Has Coverage?
Similar shares of many demographic groups now report having coverage, such as men and women, people of different ages, and people of different employment status, with one notable exception: Hispanic individuals. One-third of previously uninsured Hispanic individuals still do not have insurance, with individuals who may not be eligible for insurance comprising nearly half of this group. This subgroup is examined in more depth in Section 3.
There are some factors that contribute to now being insured. Over half (62 percent) of those who said in 2013 that they had spent their lifetime without insurance now report having coverage while nearly eight in ten of the individuals who reported in 2013 that they had health insurance less than a year earlier report now being insured. Previously uninsured people who report being in good health are slightly less likely to say they have coverage than those who report being in fair or poor health (69 percent v. 78 percent). In addition, those who report having a debilitating chronic disease that keeps them from fully participating in work or other activities are more likely to say they have coverage now than those without significant chronic disease (85 percent vs. 70 percent).
| Table 1: Percentage Of Each Group Of Previously Uninsured Reporting That They Are Recently Insured Or Remain Uninsured | |||||||
| TOTAL RECENTLY INSURED IN 2016 |
COVERAGE TYPE IN 2016 | TOTAL REMAINING UNINSUREDIN 2016 |
|||||
| Medi-Cal | Covered California | Other Non-Group | Employer-Sponsored Insurance | ||||
| TOTAL | 72% | 33% | 11% | 3% | 21% | 27% | |
| AGE | 19-34 | 70% | 30% | 8% | 1% | 28% | 29% |
| 35-49 | 65% | 28% | 8% | 6% | 20% | 35% | |
| 50-64 | 81% | 42% | 18% | 3% | 14% | 19% | |
| RACE | White non-Hispanic | 80% | 33% | 15% | 6% | 21% | 18% |
| Hispanic (NET) | 67% | 32% | 8% | 2% | 21% | 33% | |
| Hispanic, Eligible | 76% | 37% | 11% | 3% | 22% | 24% | |
| GENDER | Male | 72% | 30% | 10% | 2% | 24% | 27% |
| Female | 73% | 38% | 11% | 5% | 17% | 27% | |
| LENGTH OF TIME UNINSURED PRIOR TO ACA | 2mo – <1 year | 81% | 32% | 10% | 5% | 32% | 19% |
| 1 year to <2 years | 75% | 33% | 7% | 3% | 26% | 25% | |
| 2 or more years | 77% | 35% | 14% | 3% | 19% | 23% | |
| Never had insurance | 62% | 32% | 7% | 3% | 16% | 37% | |
| EMPLOYMENT | Employed | 75% | 27% | 13% | 2% | 31% | 25% |
| Unemployed | 60% | 44% | 8% | 3% | 4% | 38% | |
| A student, retired, on disability, or stay at home parent | 72% | 44% | 7% | 6% | 4% | 28% | |
| EDUCATION | High school or less | 65% | 35% | 6% | 3% | 18% | 34% |
| Some college | 79% | 35% | 15% | 4% | 21% | 21% | |
| College or more | 88% | 22% | 21% | 3% | 36% | 12% | |
| HEALTH STATUS | Excellent/ Very good/ Good | 69% | 30% | 12% | 4% | 20% | 30% |
| Fair/ Poor | 78% | 39% | 8% | 2% | 22% | 22% | |
| MARITAL STATUS | Married | 71% | 27% | 12% | 4% | 23% | 29% |
| Not married | 73% | 37% | 10% | 3% | 20% | 26% | |
| FAMILY INCOME | Less than 138% FPL | 71% | 49% | 4% | 4% | 11% | 29% |
| Between 138% – 400% FPL | 73% | 18% | 17% | 2% | 30% | 27% | |
| DEBILITATING CHRONIC CONDITION | Yes | 85% | 44% | 15% | 3% | 12% | 15% |
| No | 70% | 31% | 10% | 4% | 22% | 30% | |
The Enrollment/Renewal Process
Being contacted by phone, email or a door-to-door visit about signing up for health insurance appears to have played a role in some of California’s previously uninsured gaining or keeping coverage. A large majority (85 percent) of those who say they were personally contacted since November 1st say they now have coverage, compared to 68 percent of those who report that they were not contacted.
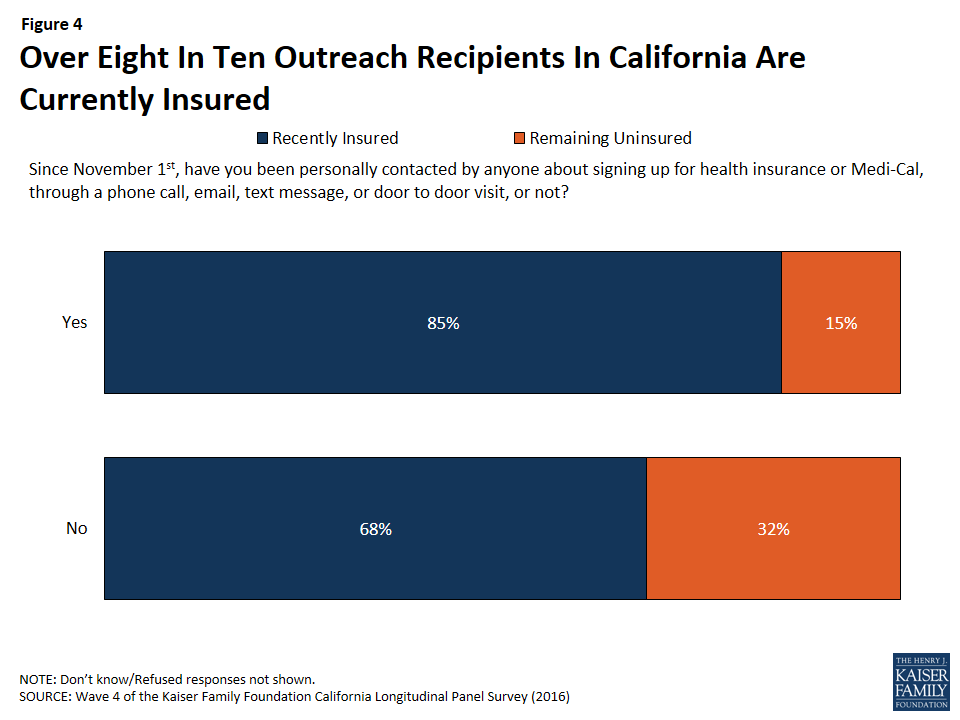
Figure 4: Over Eight In Ten Outreach Recipients In California Are Currently Insured
In addition, of the recently insured individuals whose main source of health insurance is not an employer-sponsored plan, 43 percent say that someone either helped them complete the enrollment/renewal process or someone else did the entire thing. This share includes 14 percent who report that a Covered California representative helped them enroll or renew, which is slightly higher than the share (8 percent) who say a community or county health worker helped them or who say a health plan representative helped them. Five percent of recently insured individuals without employer-sponsored coverage say a family member or friend helped them enroll or renew.
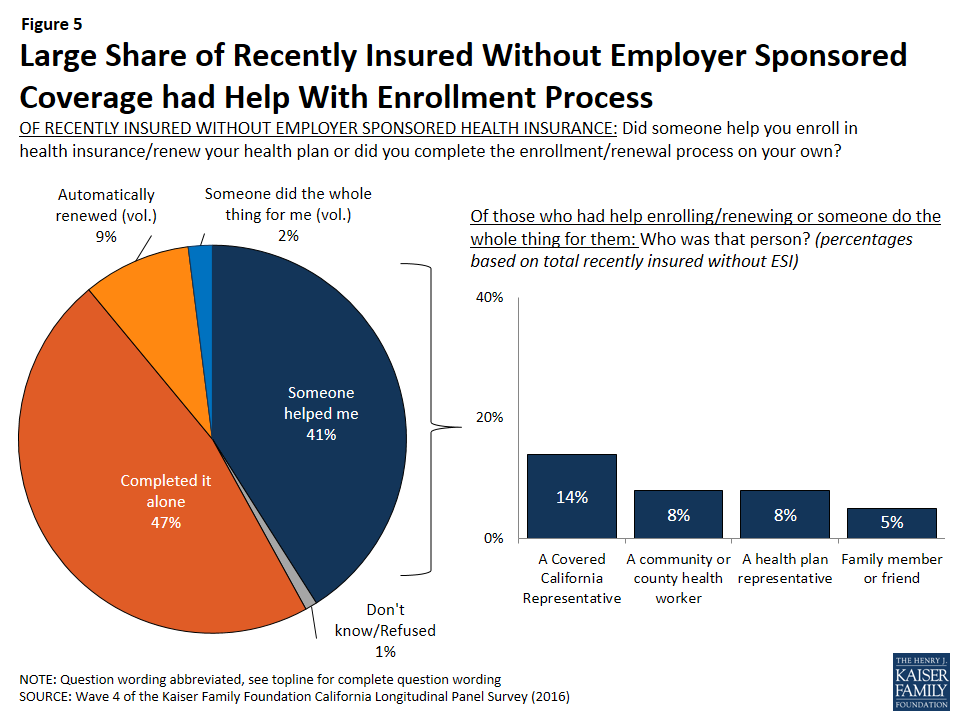
Figure 5: Large Share of Recently Insured Without Employer Sponsored Coverage had Help With Enrollment Process
The majority of California’s recently insured (70 percent) have the same plan in 2016 that they did in 2015 while one-fourth say they changed to a different plan and 5 percent were uninsured last year. This is also true of only those who got health insurance through Covered California. Of individuals who currently have health insurance coverage through Covered California, 68 percent say they have the same health insurance plan as they had last year in 2015, one-fourth say they changed to a different plan, and 7 percent were uninsured in 2015.
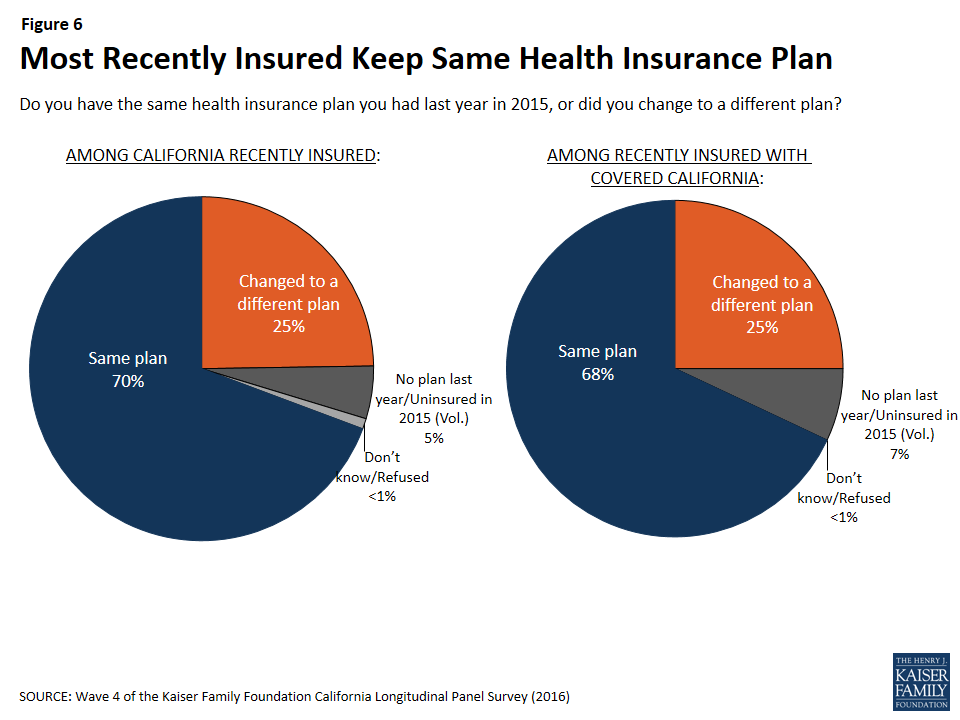
Figure 6: Most Recently Insured Keep Same Health Insurance Plan
For most recently insured, re-enrolling was automatic, with two-thirds saying they were re-enrolled in the same health plan without having to take any action while one-third say they took action to re-enroll in their same health plan. Only 15 percent of those who kept the same plan as they had last year shopped around for another health plan (9 percent of total insured).
Changing Health Insurance Plans
Of the one-fourth of California’s recently insured who did change health insurance plans, about three-fourths (77 percent) found the process either “very easy” or “somewhat easy” while 22 percent say the process was either “somewhat” or “very” difficult.
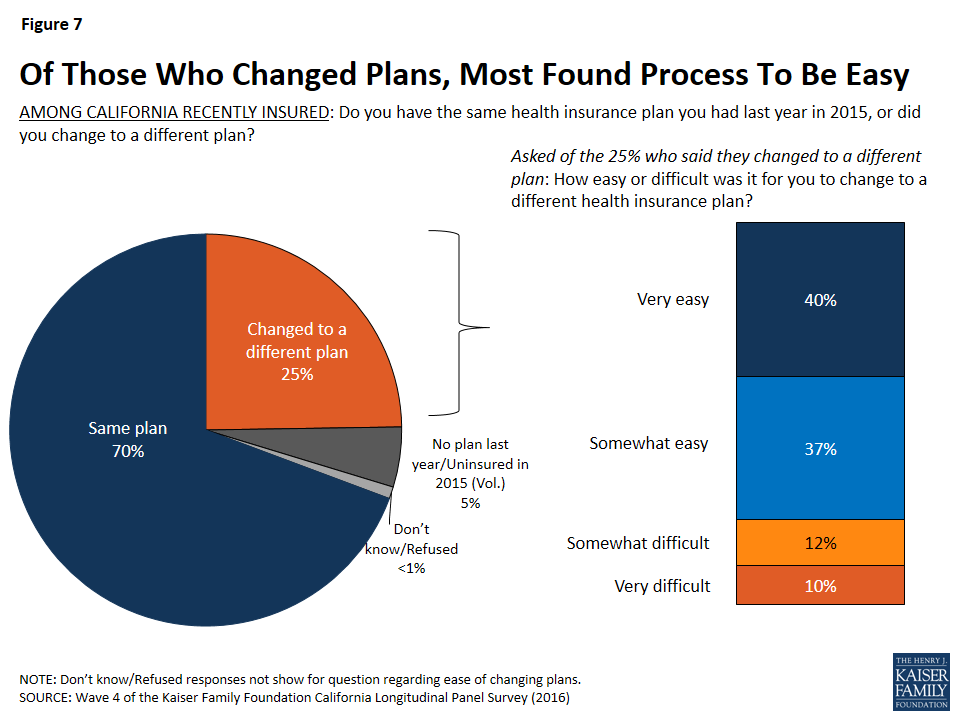
Figure 7: Of Those Who Changed Plans, Most Found Process To Be Easy
When those who had changed plans in the past year were asked their reasoning for switching to a different health plan, more than half (56 percent) say it was because their income changed. This was followed by half (49 percent) who say it was because they were able to enroll in an employer-sponsored plan, 31 percent who found a plan with a lower monthly premium, 28 percent who wanted a plan with more choice in providers, 27 percent who wanted a plan with a lower annual deductible, and 22 percent who said their or their family’s health needs changed. Only 5 percent say they changed health plans because they wanted to be eligible for government financial help.4
Dynamics In Enrollment And Coverage
People tend to move in and out of coverage as their income, employment status and other life factors change, particularly those with lower incomes or recent experience being uninsured. Many (57 percent) Californians who reported being uninsured in 2013, prior to the ACA’s first open enrollment period, reported gaining insurance in the spring 2014 or the second open enrollment period (spring 2015), and now report still having insurance coverage after the third open enrollment period (spring 2016). These individuals are referred to here as those “still insured.”5 While these people may have fluctuated in and out of coverage or changed plans over the course of the past two years, they are not new to health insurance. Another 15 percent of California’s previously uninsured are more likely to be new to their coverage because they reported being uninsured in the survey they most recently completed (whether it was Wave 3 or Wave 2). This group is referred to here as the “newly insured.”6 In addition, 22 percent of people reported being uninsured after three open enrollment periods and another 5 percent said they had coverage in the most recent survey they completed (either Wave 3 or Wave 2) but now say they are without health insurance. These groups combined are referred to here as the “remaining uninsured.” To see a demographic profile of each of these groups, see Appendix A.
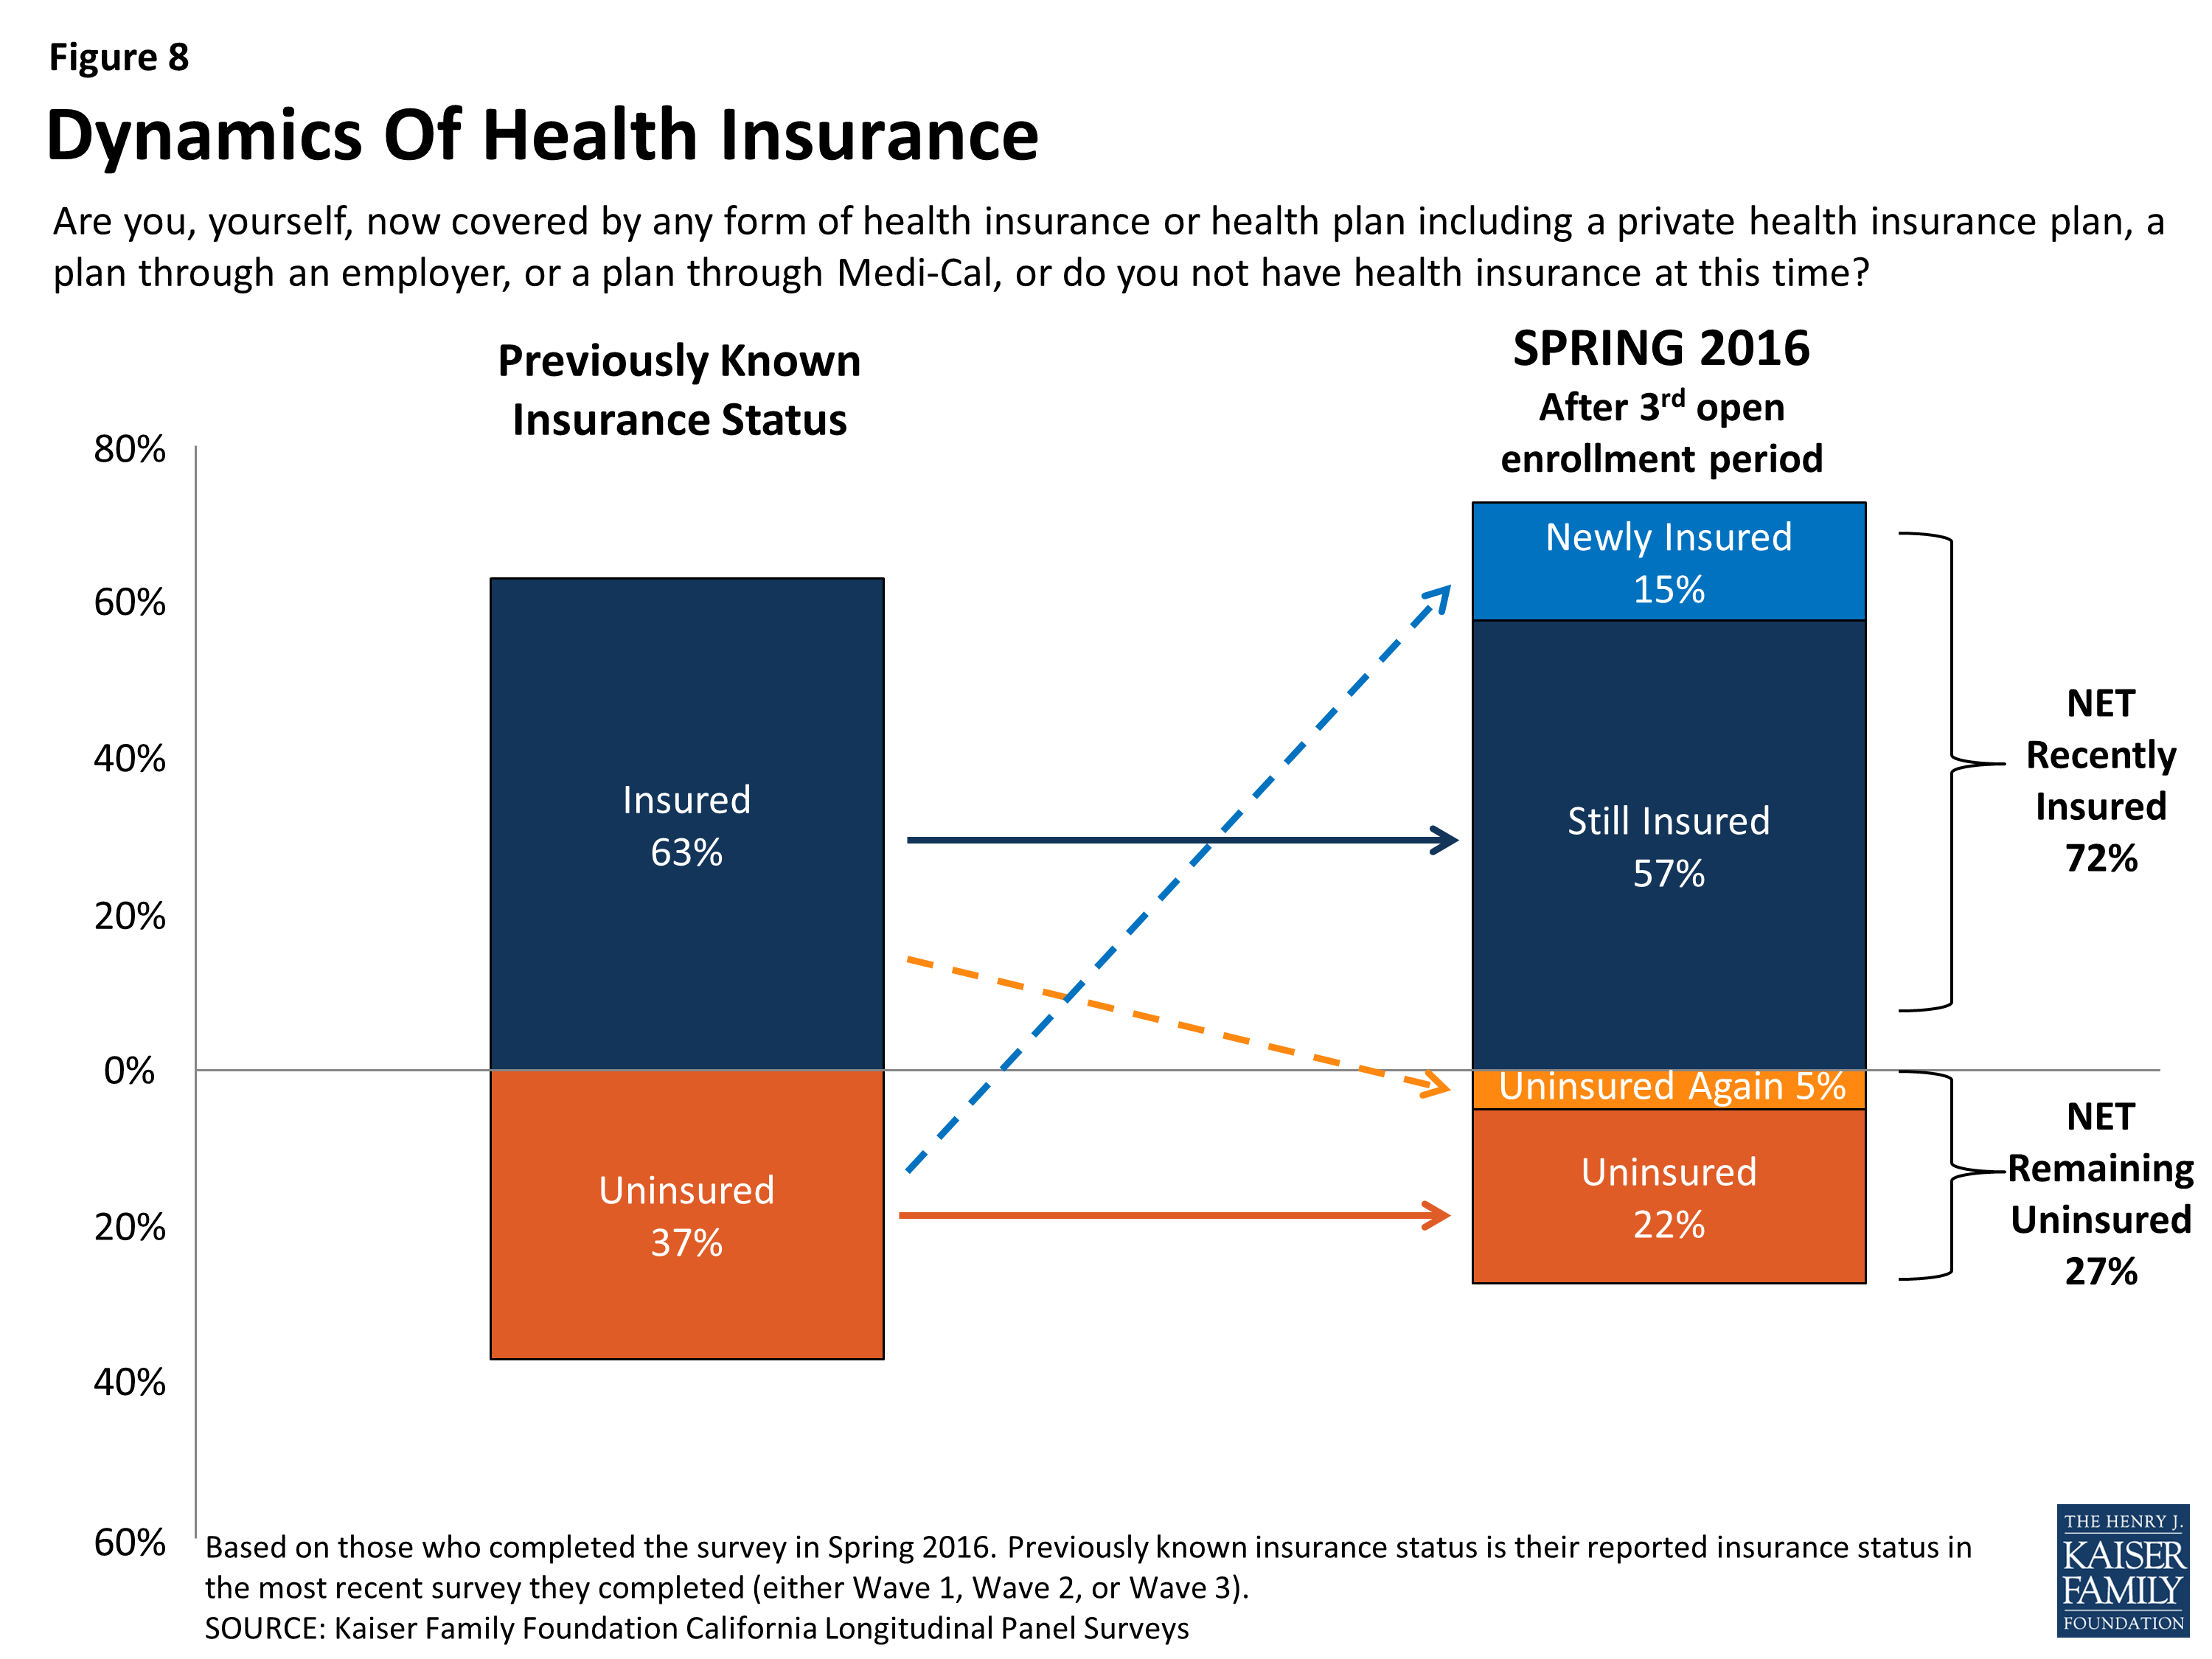
Figure 8: Dynamics Of Health Insurance
Getting Health Insurance Coverage and Keeping Coverage
By tracking the insurance status of these individuals over a period of four years, it is clear that the majority of individuals who get health insurance coverage keep some form of coverage. Individuals who completed all four waves of interviews are known as “habitual respondents.” In the first survey, conducted in 2013, 70 percent of the habitual respondents reported not having health insurance for a period of at least 2 years. Now, after collecting the insurance status of these individuals over the past three years, we can report that 63 percent of these individuals have reported having health insurance for at least one year, including 48 percent who have had coverage for at least two years. In addition, 14 percent of the habitual respondents have unstable health insurance status meaning that they have gotten health insurance in the past two years and have subsequently lost their coverage. Of the individuals with unstable health insurance status, 5 percent gained coverage again but 9 percent remain without health insurance coverage.
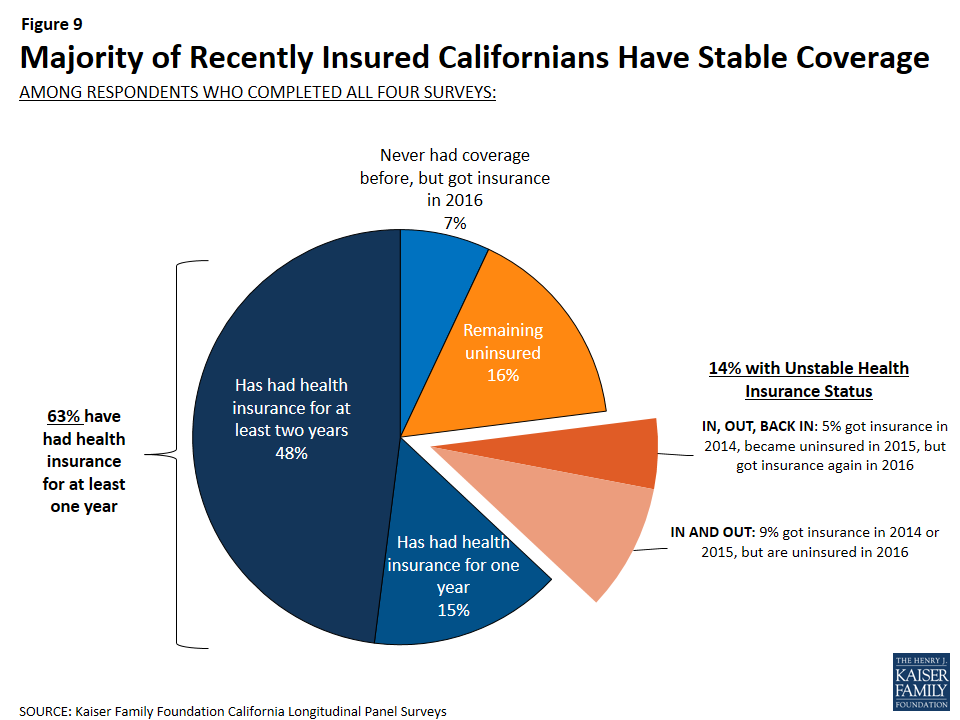
Figure 9: Majority of Recently Insured Californians Have Stable Coverage
Section 2: Financial Security, Health-Related Worries, Accessing Care, and Evaluations of Insurance Plans
By repeatedly contacting individuals who participated in a baseline survey, one of the strengths of the California Longitudinal Panel Survey is to track the experiences and perceptions of these individuals over time, while comparing their current experiences to previous experiences. One of the ways this is best illustrated is by comparing the change over time between individuals who recently got health insurance and those who remain uninsured.
Overall, Californians who recently got health insurance are more likely to report that their health needs are being met today than in the past. About three-fourths (77 percent) of those who report now having coverage after the third open enrollment period say their health needs are being met either “very” or “somewhat” well today, while only half of them (49 percent) said the same thing when they were uninsured in summer 2013, prior to the first open enrollment period. This is compared to the remaining uninsured, in which a similar share say their health needs are being met well today as did in 2013 (62 percent compared to 59 percent).
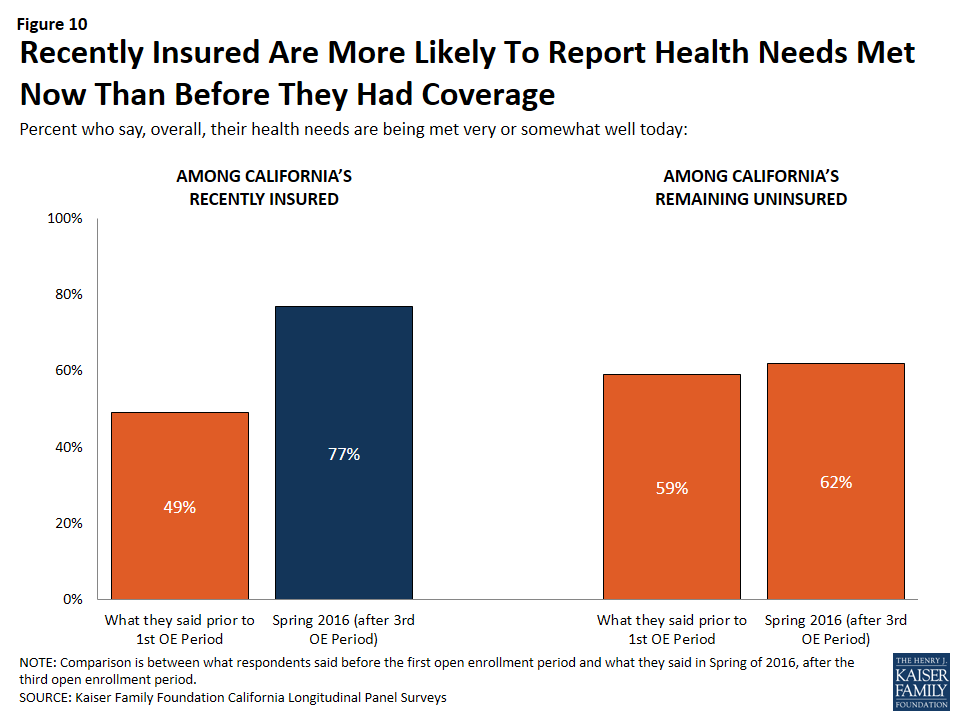
Figure 10: Recently Insured Are More Likely To Report Health Needs Met Now Than Before They Had Coverage
Californians who recently got health insurance are also less likely to report having difficulty affording a variety of household expenses, including health care, in 2016 than they did in 2013.
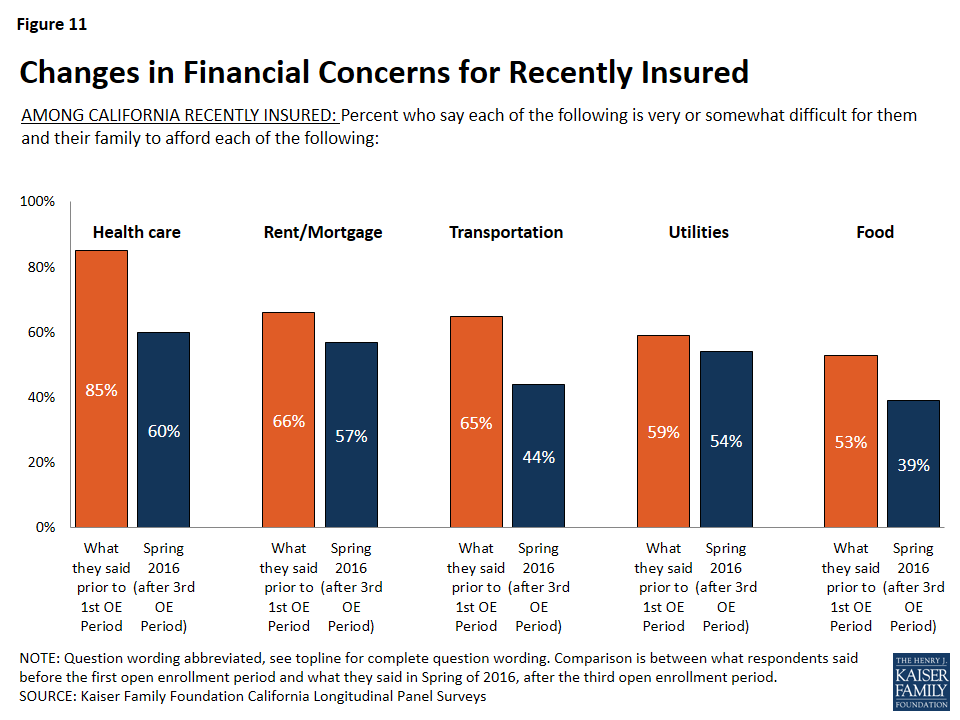
Figure 11: Changes in Financial Concerns for Recently Insured
In 2016, 60 percent of California’s recently insured say it is difficult for them to afford health care. While this is still a majority, it is considerably less than the share of these individuals who reported the same in 2013 (85 percent). In comparison, of the remaining uninsured, the percent who say it is difficult for them to afford health care has remained stable (80 percent in 2016 v. 84 percent in 2013). For those who report having health insurance in spring 2016 after the third open enrollment period, affording health care falls among one of several household expenses people say they have difficulty affording. But, for those who remain uninsured, health care is by far the most frequently cited burdensome household expense, with eight in ten saying it is at least somewhat difficult to afford.
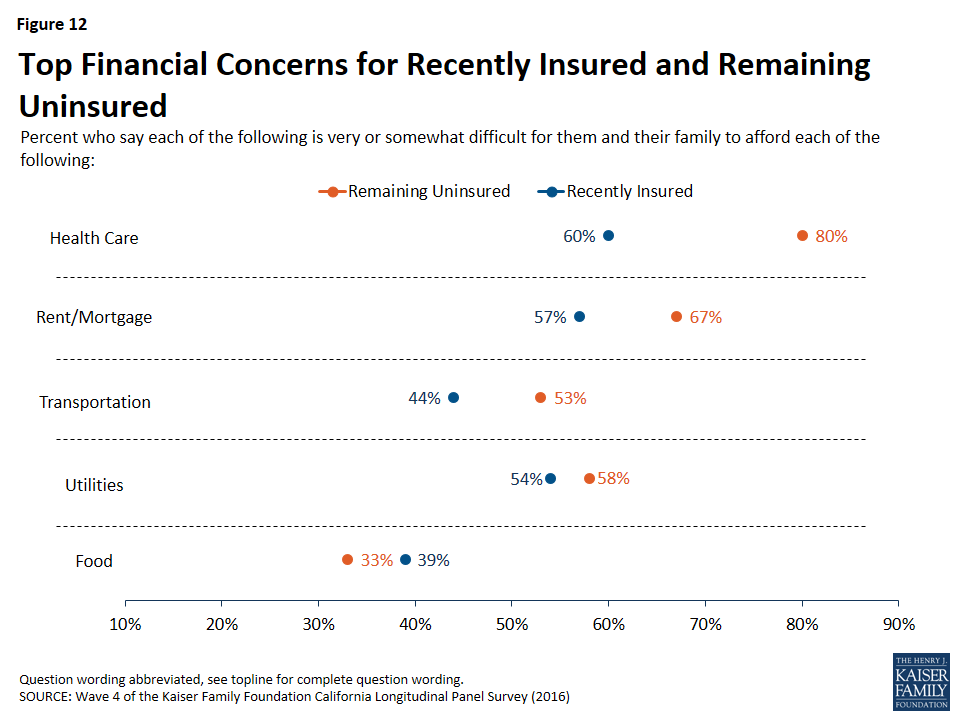
Figure 12: Top Financial Concerns for Recently Insured and Remaining Uninsured
Financial Security
Even with some saying coverage is difficult to afford, overall, about half (46 percent) of previously uninsured Californians who have recently gained coverage say that having health insurance makes them feel more financially secure. About four in ten (41 percent) say it doesn’t make a difference, and a smaller share (11 percent) say it makes them feel less financially secure. In addition, most (58 percent) of those now with insurance say they feel well-protected by their health insurance, but 40 percent say they feel vulnerable to medical bills. The share of the insured who say they feel vulnerable to medical bills has increased slightly since 2015 (33 percent).

Figure 13: Large Shares Say Coverage Makes Them Feel More Financially Secure and They Feel Well-Protected By Plan
Among the recently insured, a larger share (52 percent) of individuals who have Medi-Cal report that getting insured made them feel more financially secure compared to those with Covered California (42 percent) and those with employer-sponsored insurance (40 percent).
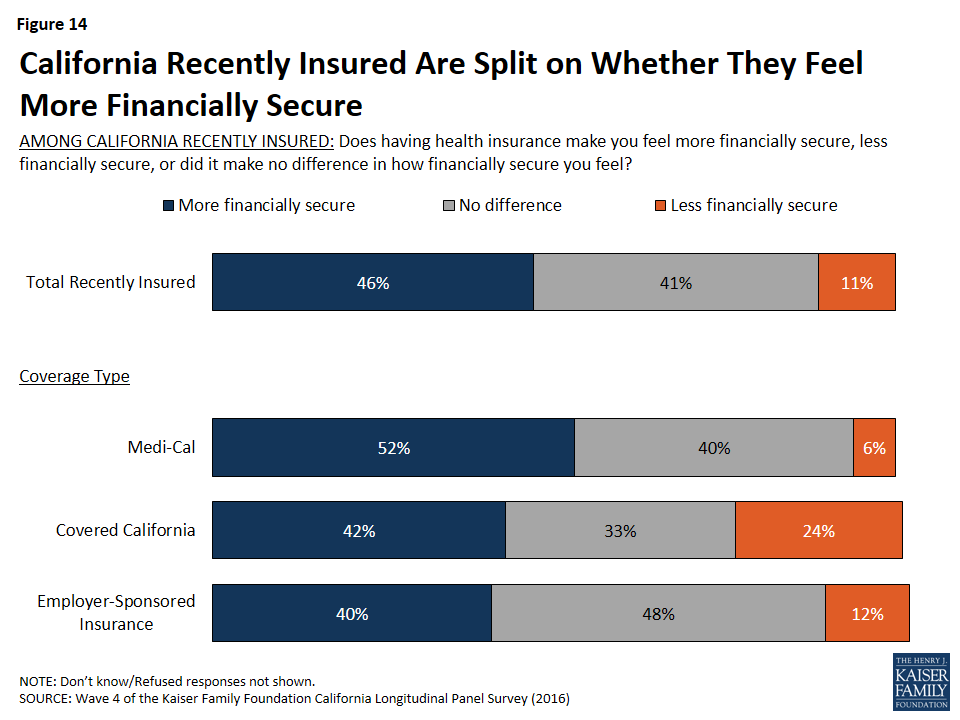
Figure 14: California Recently Insured Are Split on Whether They Feel More Financially Secure
Similarly, a larger share of individuals with Medi-Cal feel well protected by their health insurance plan from high medical bills than those with Covered California and those with employer-sponsored insurance (62 percent compared to 50 percent and 53 percent, respectively). This is likely due to lower cost sharing for those with Medi-Cal.
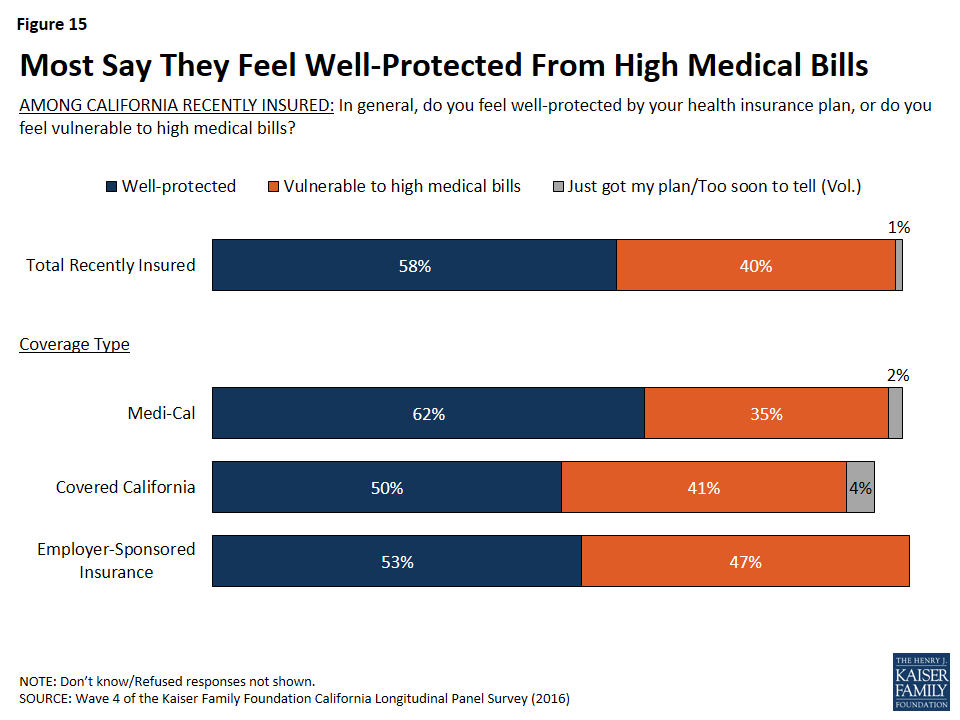
Figure 15: Most Say They Feel Well-Protected From High Medical Bills
For Some, Health Care-Related Worries Persist
While many who have recently gained insurance report feeling more financially secure as a result of their coverage, one-fifth of the recently insured report forgoing needed medical care in the past year due to cost. But this share is smaller than the share of those remaining without insurance (32 percent) who report not getting medical care due to costs. The share of those with insurance who have foregone medical care due to costs is similar across insurance type, with about one in five of those with Medi-Cal (17 percent), and about one in four with those with Covered California (23 percent) and employer-sponsored insurance (24 percent) saying they have not gotten care due to costs.
| Table 2: Likelihood Of Forgoing Medical Care and Worries About Health Costs | |||||
| REMAINING UNINSURED | RECENTLY INSURED | ||||
| Total Recently Insured | Medi-Cal | Covered California | Employer-Sponsored Insurance | ||
| Was there a time over the past twelve months when you needed medical care, but did not get it because of the cost, or not? | |||||
| YES | 32% | 20% | 17% | 23% | 24% |
| NO | 68 | 79 | 82 | 77 | 76 |
| Percent who say they are very worried about not being able to do the following: | |||||
| Pay medical bills for health care services | 55 | 39 | 47 | 29 | 28 |
| Pay medical bills in the event of a serious illness or accident | 72 | 53 | 61 | 44 | 47 |
| Find a doctor or health professional who will treat you | 44 | 35 | 42 | 23 | 30 |
Having health insurance also leads to lower rates of reporting being worried about a series of health-care related concerns. Forty-four percent of California’s remaining uninsured saying they are “very worried” they will not be able to find a doctor or health professional to treat them, 55 percent are “very worried” they won’t be able to pay medical bills for health care services, and 72 percent are “very worried” they won’t be able to pay medical bills in the event of a serious illness or accident. This is compared to smaller shares of recently insured individuals who report being “very worried” about all of these health-related concerns. In addition, California’s recently insured now report a lower rate of being “very worried” about being able to pay medical bills for routine health care services than they did in 2013 (39 percent in 2016 compared to 52 percent in 2013), while the share of the remaining uninsured who are very worried has not changed and is 55 percent now compared to 57 percent in 2013.
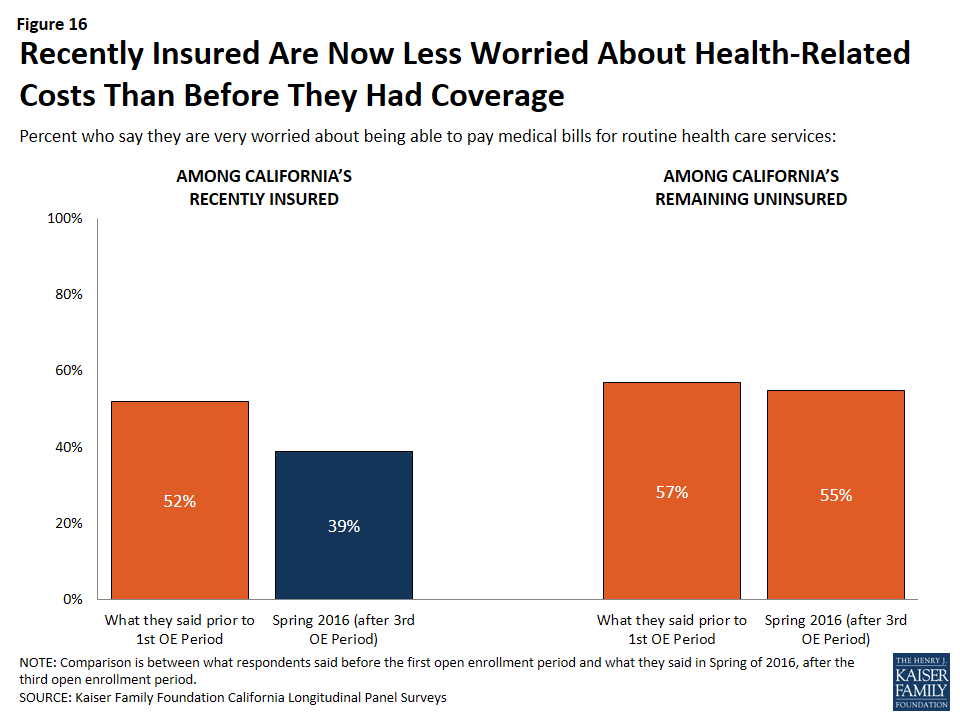
Figure 16: Recently Insured Are Now Less Worried About Health-Related Costs Than Before They Had Coverage
While half (53 percent) of California’s recently insured are still “very worried” that they would not be able to pay medical bills in the event of a serious illness or accident, this is a smaller share than the percent of these people who reported being “very worried” in 2013 (80 percent) and smaller than the share of the remaining uninsured who now report being “very worried” (72 percent). A larger share of individuals with Medi-Cal coverage (61 percent) say they are “very worried” about medical expenses for a serious illness compared to 47 percent of those with employer-sponsored coverage and 44 percent of individuals with Covered California health insurance coverage.
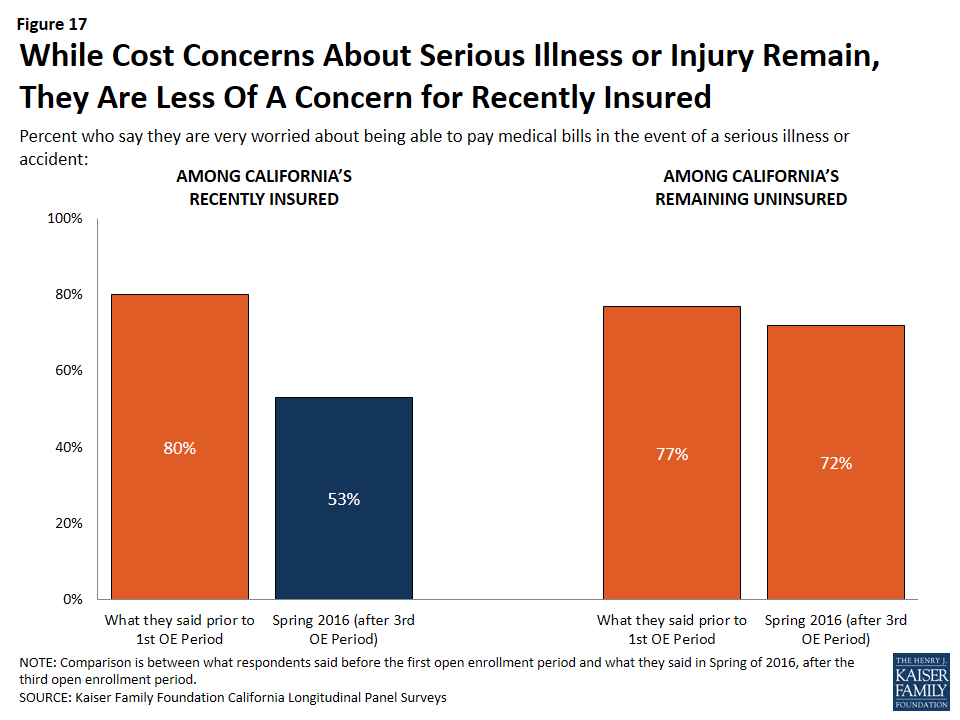
Figure 17: While Cost Concerns About Serious Illness or Injury Remain, They Are Less Of A Concern for Recently Insured
Accessing Health Care
Three-fourths of California’s recently insured have visited a doctor or health clinic in the past 12 months compared to 40 percent of California’s remaining uninsured.
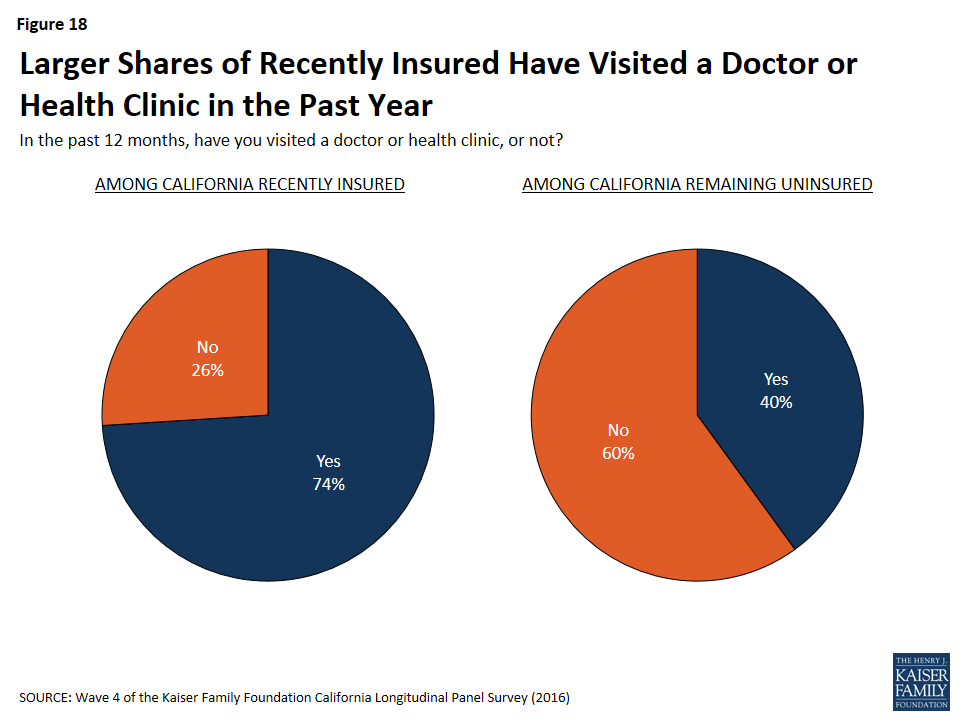
Figure 18: Larger Shares of Recently Insured Have Visited a Doctor or Health Clinic in the Past Year
Among California’s recently insured, 57 percent say they have a usual source of care outside of the hospital emergency room, which is slightly higher than the share of these individuals who reported having a usual source of care outside of the hospital emergency room in 2013 (48 percent).
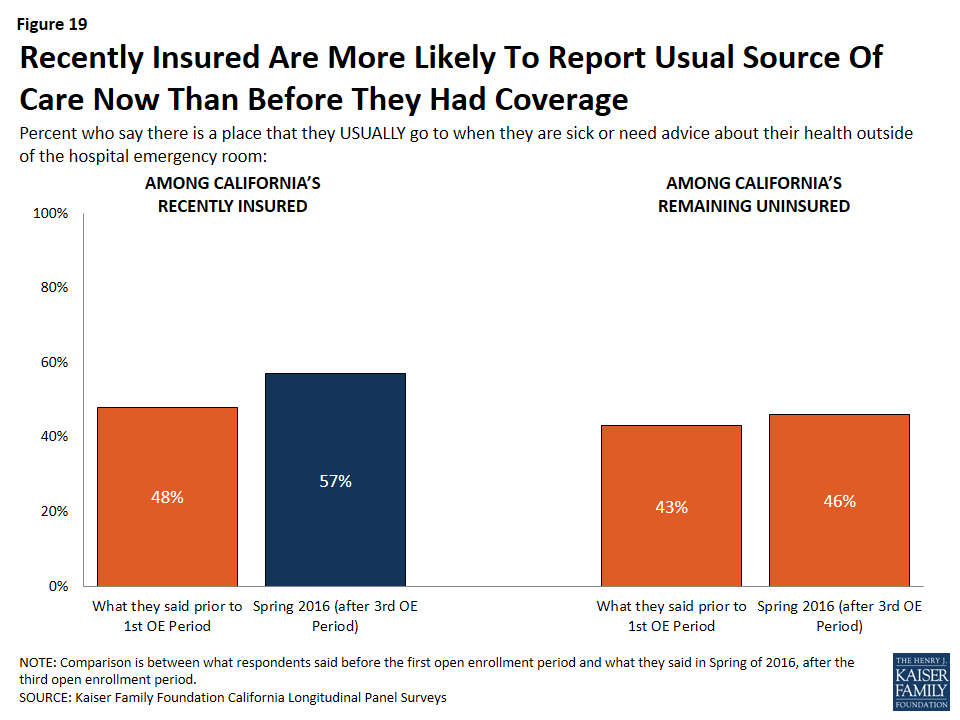
Figure 19: Recently Insured Are More Likely To Report Usual Source Of Care Now Than Before They Had Coverage
A larger share of California’s recently insured now report there is a place they usually go to, outside of the hospital emergency room, when they are sick or need advice about their health. In 2016, nearly six in ten (57 percent) of the recently insured report a usual source of care outside of the emergency room. In 2013, 48 percent of these individuals reported the same.
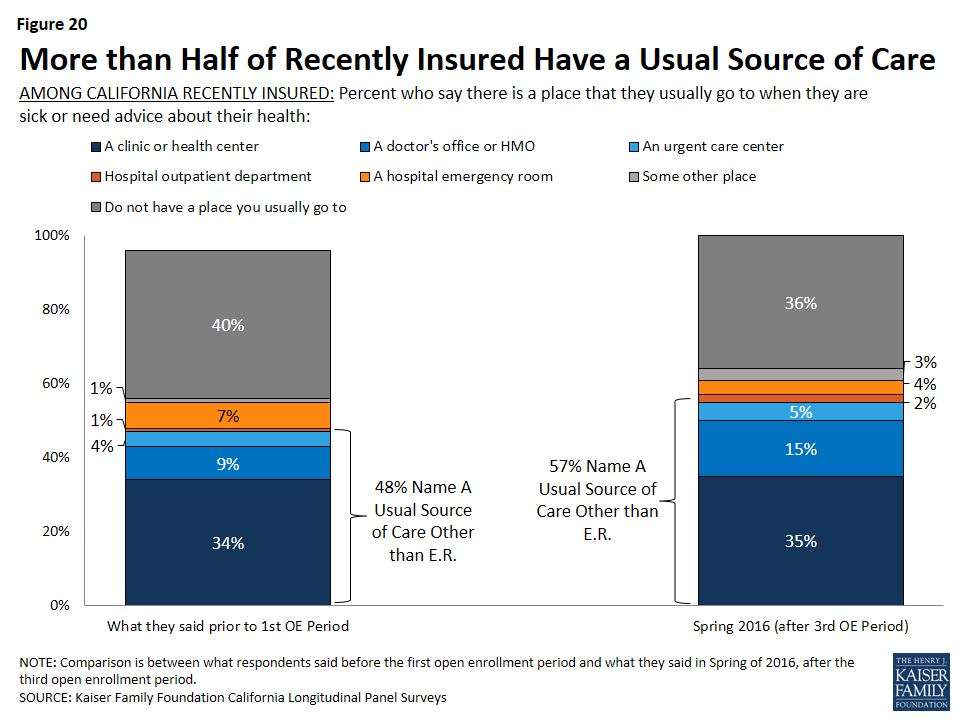
Figure 20: More than Half of Recently Insured Have a Usual Source of Care
Problems Accessing Medical Care Among Recently Insured
Yet, for some of the recently insured, some problems accessing medical care remain. One-fourth of the recently insured say they have had to wait longer than a reasonable time to get an appointment for medical care and about one in ten (12 percent) say they have been told by a doctor’s office or clinic in the past 12 months that they would not be accepted as a new patient.
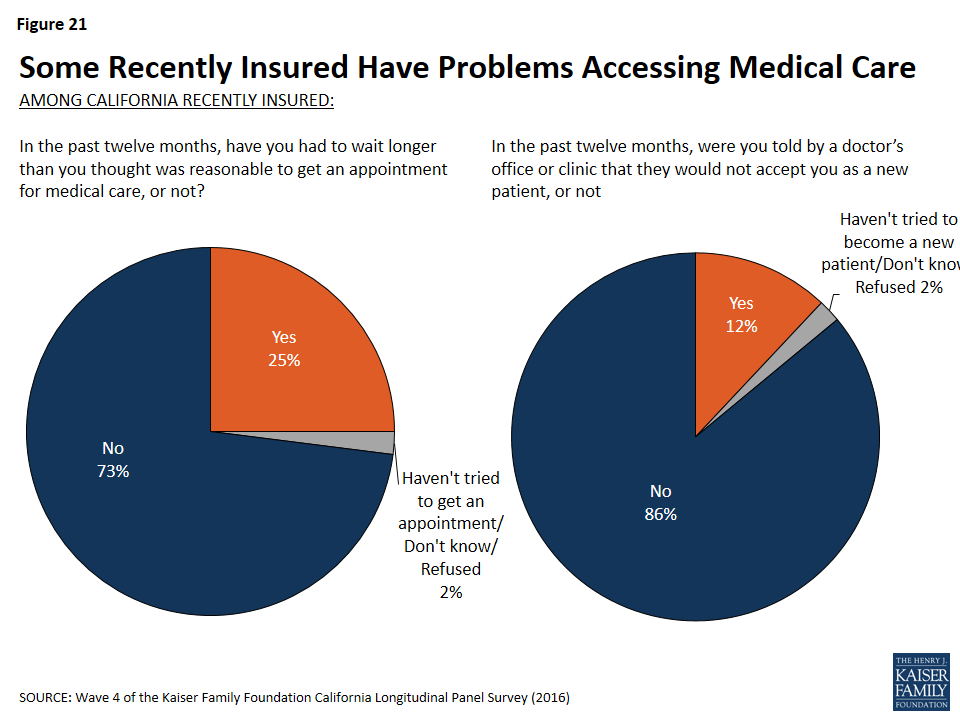
Figure 21: Some Recently Insured Have Problems Accessing Medical Care
Evaluations of Health Insurance
Sixty-five percent of California’s recently insured say health insurance is worth the money that it costs. This is slightly larger than the share in 2013, in which 58 percent of these individuals reported that health insurance is worth the money that it costs. Among the remaining uninsured, 56 percent say health insurance is worth the money it costs.
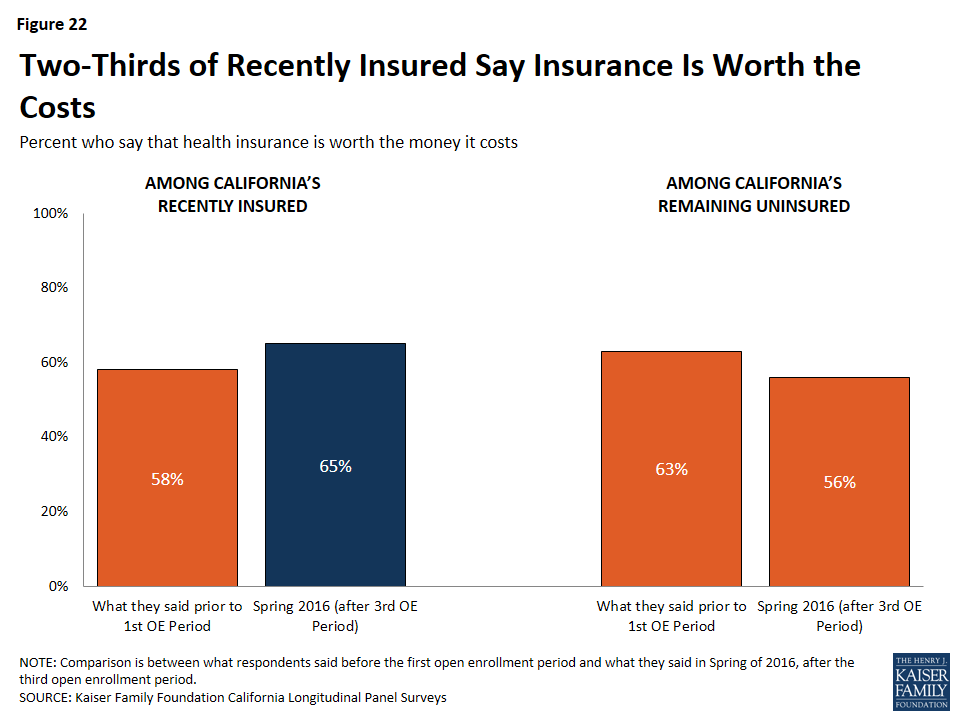
Figure 22: Two-Thirds of Recently Insured Say Insurance Is Worth the Costs
In addition, 85 percent of California’s recently insured say health insurance is something they need compared to 75 percent of those who remain uninsured. There are differences by gender within insurance status. Of the men who were recently insured, eight in ten say health insurance is something they need compared to 69 percent of men who remain uninsured. More than eight in ten women, regardless of insurance status, say health insurance is something they need.
| Table 3: Gender Differences in Perceptions of Whether Health Insurance is Needed | ||||||
| RECENTLY INSURED | REMAINING UNINSURED | |||||
| Total | Men | Women | Total | Men | Women | |
| Health insurance is something I need | 85% | 80% | 90% | 75% | 69% | 82% |
| I’m healthy enough that I don’t really need health insurance | 14 | 20 | 8 | 22 | 28 | 15 |
Satisfaction with Current Health Insurance Plan
Of the recently insured, the majority say their experiences with their current health insurance plan have been positive. About one-third (31 percent) say their experiences have been “very positive” with an additional 48 percent saying their experiences have been “somewhat positive.” Only 15 percent say their experiences have been negative: 10 percent say “somewhat negative” and 5 percent “very negative.” When looking at differences among coverage type, slightly larger shares of recently insured individuals with Medi-Cal say their experiences have been either very or somewhat positive (85 percent), compared to about three-fourths of those with employer-sponsored insurance and 70 percent of those with Covered California.
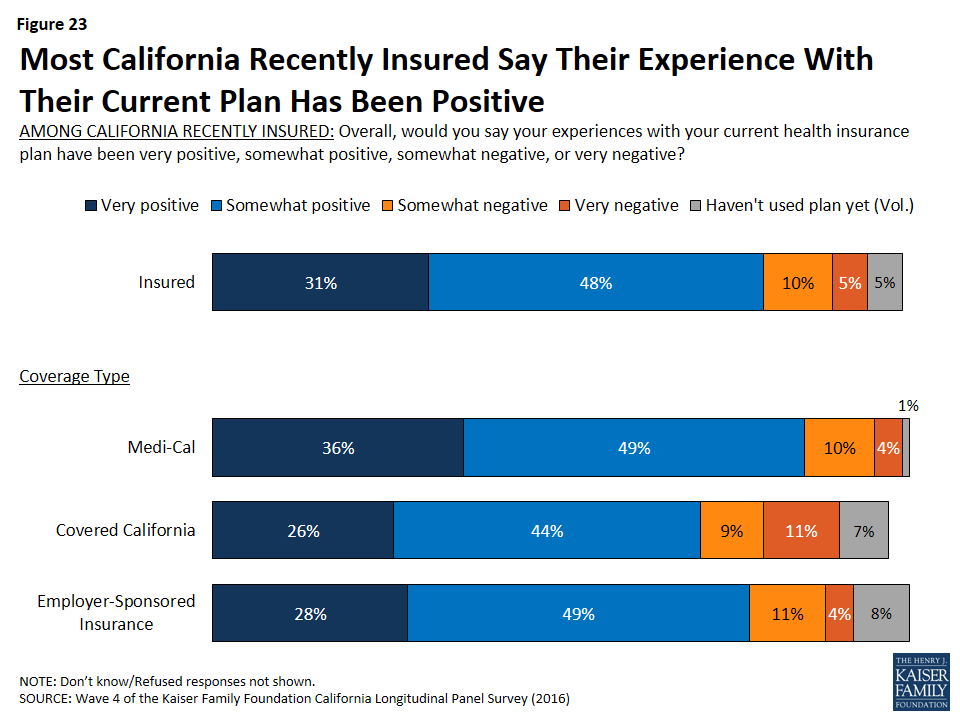
Figure 23: Most California Recently Insured Say Their Experience With Their Current Plan Has Been Positive
In addition, the majority of the recently insured report that they are either “very satisfied’ or “somewhat satisfied” with various aspects of their current plan including their choice of hospital (80 percent), their choice of primary doctors (76 percent), and their choice of specialists (68 percent).
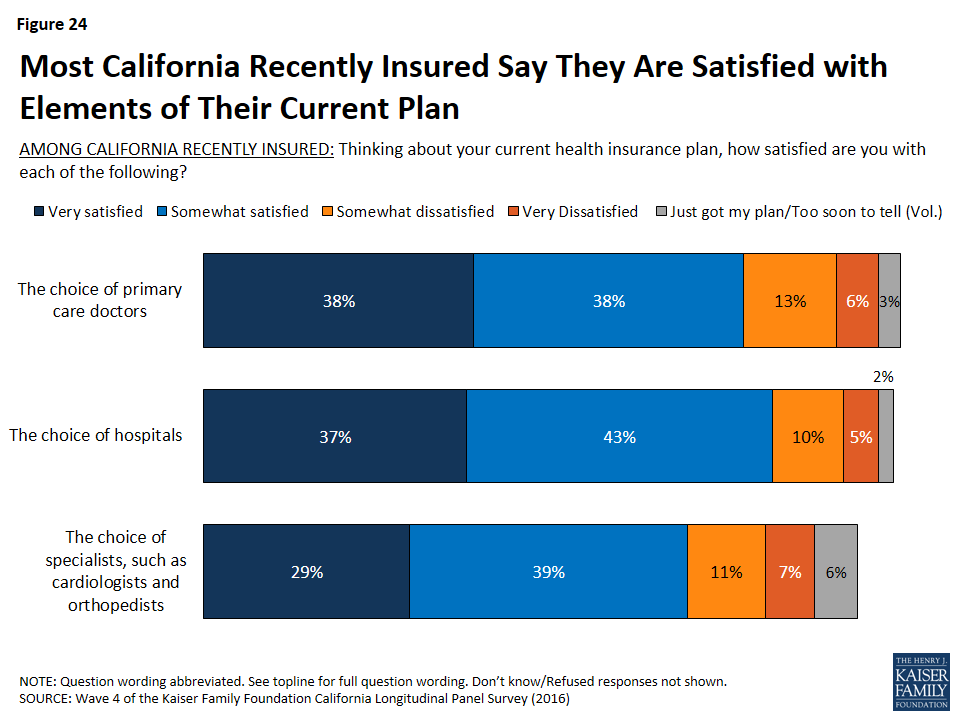
Figure 24: Most California Recently Insured Say They Are Satisfied with Elements of Their Current Plan
Section 3: The Remaining Uninsured
Who are the Remaining Uninsured?
Although many previously uninsured Californians gained coverage since the health care law went into effect, 27 percent report that they do not currently have health insurance. Many of these remaining uninsured had little interaction with the health insurance system in the years prior to the ACA implementation. Nearly four in ten of the remaining uninsured reported in the baseline survey that they had been without health insurance for two or more years (39 percent), and an additional 41 percent said they have never had insurance. Seventeen percent of the remaining uninsured are between the ages of 19 and 26 and therefore may be eligible to be covered through a parent or guardian’s health plan — if their parents have health insurance. However, the largest share are individuals between the ages of 30 and 39 (33 percent), followed by those between the ages of 40 and 49 (22 percent). Hispanics make up two-thirds of the remaining uninsured. Though half of them (33 percent of all remaining uninsured) are likely undocumented immigrants who are not eligible for Medi-Cal or assistance through Covered California. Many report a family income that makes them likely eligible for Medi-Cal (27 percent) or for financial assistance through Covered California (30 percent), while 41 percent are likely undocumented and therefore are ineligible.1
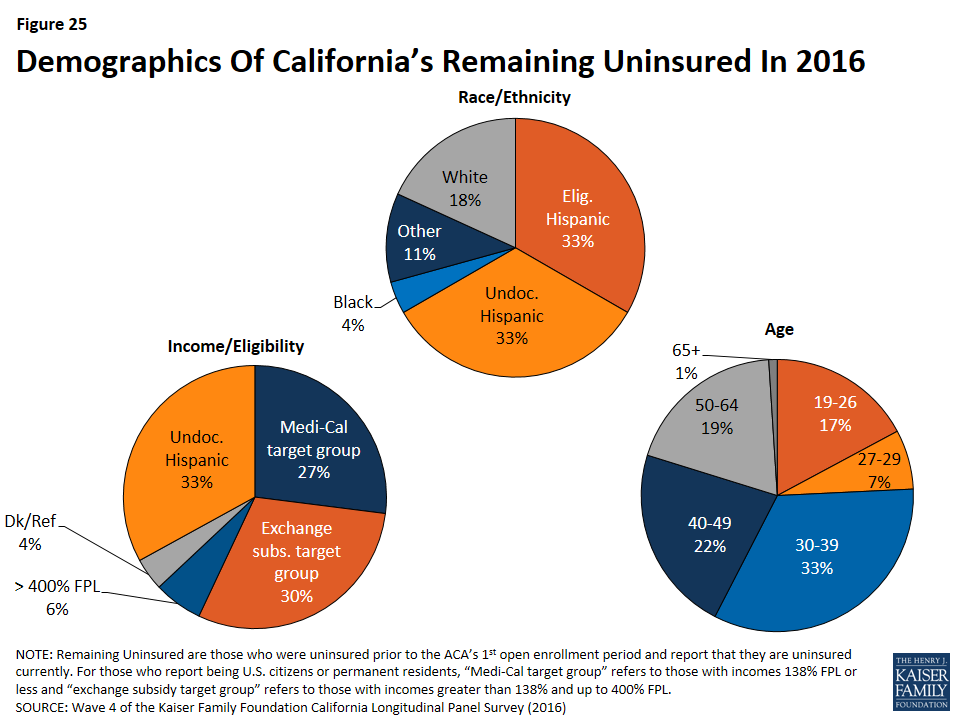
Figure 25: Demographics Of California’s Remaining Uninsured In 2016
Why Don’t They Have Insurance?
When asked to say in their own words the main reason why they do not currently have health insurance, 47 percent of California’s remaining uninsured say it is because health insurance is too expensive or they can’t afford it. Affordability is by far the most common reason named for lacking health insurance, followed by eligibility reasons (19 percent), such as immigration concerns (10 percent) or the fact that they believe they are ineligible for Medi-Cal or government help (4 percent). One in ten say they haven’t tried to get insurance, they don’t need insurance, or they just haven’t gotten around to it, and about one in ten (9 percent) name application-process-related issues as the main reason. Small shares say other reasons such as unavailability (2 percent) — including that their employer doesn’t offer coverage (1 percent), unemployment (2 percent), and opposition to the health care law (2 percent).
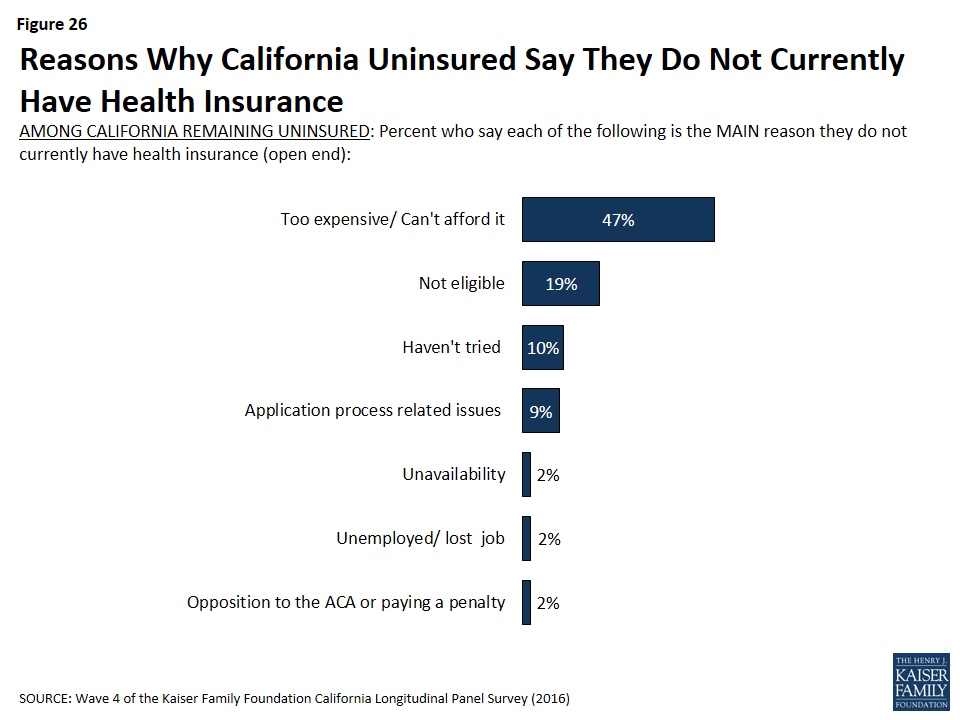
Figure 26: Reasons Why California Uninsured Say They Do Not Currently Have Health Insurance
Did They Try To Get Insurance?
Slightly more than one-third (36 percent) of California’s remaining uninsured say they tried to get health insurance in the past 6 months. Those who tried but did not gain health insurance point to cost as a main reason they were unsuccessful. About a quarter (27 percent) of California’s remaining uninsured say they tried but didn’t get insurance because it was too expensive, including 19 percent who say they shopped for health insurance and 7 percent who say they didn’t bother shopping because they didn’t think they could afford it. Another 15 percent say they weren’t eligible for coverage, and less than one in ten (7 percent) say they were not able to complete the application process.

Figure 27: Most Remaining Uninsured Who Tried But Did Not Enroll In Health Insurance Say It Was Too Expensive
While a large share of California’s remaining uninsured say they did not get insurance because it was too expensive, there is little consensus on how much they would be willing to pay each month for health insurance or how much they think it will cost for them to buy health insurance. About half of the remaining uninsured say they are willing to pay up to $99. However, only 20 percent say they think it will cost them that much per month. About one-third (35 percent) of the remaining uninsured is unsure how much it would cost them each month to buy health insurance for themselves.
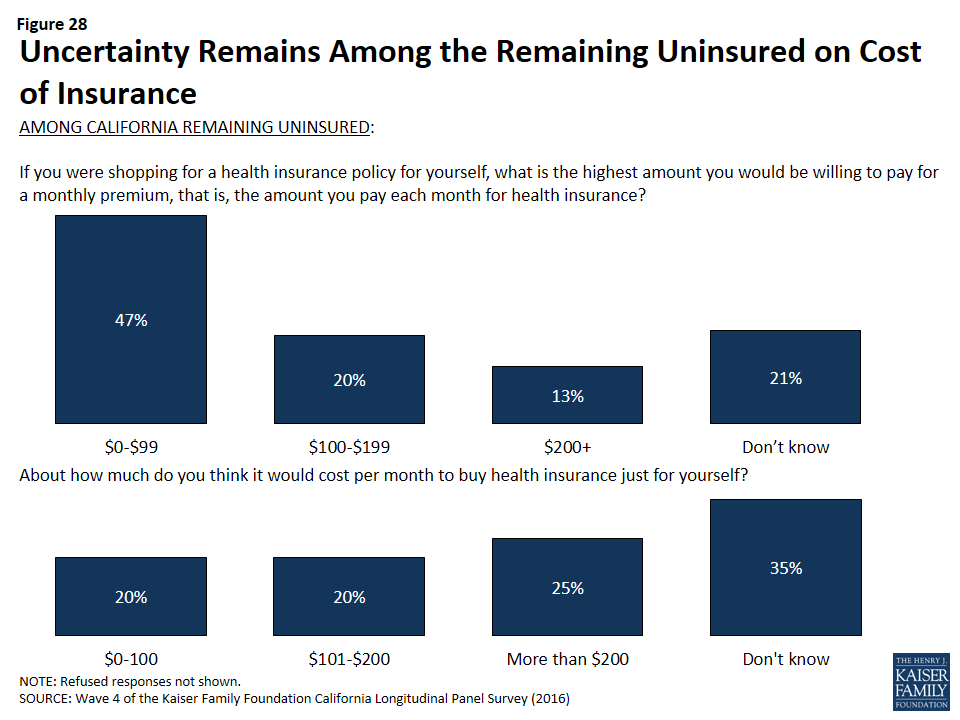
Figure 28: Uncertainty Remains Among the Remaining Uninsured on Cost of Insurance
In addition, getting health insurance for free and buying health insurance for less than they thought are two of the many factors that could influence the remaining uninsured to get coverage. In fact, more than half of the remaining uninsured say they would be likely to get health insurance in the future if they had time to explore their options, they could get health insurance for free, they had more time to understand how to sign up, they could buy health insurance for less than they thought, the fine for not getting health insurance is higher this year, they or their spouse’s employer offered health insurance coverage, or if they had to pay a fine for not having health insurance.
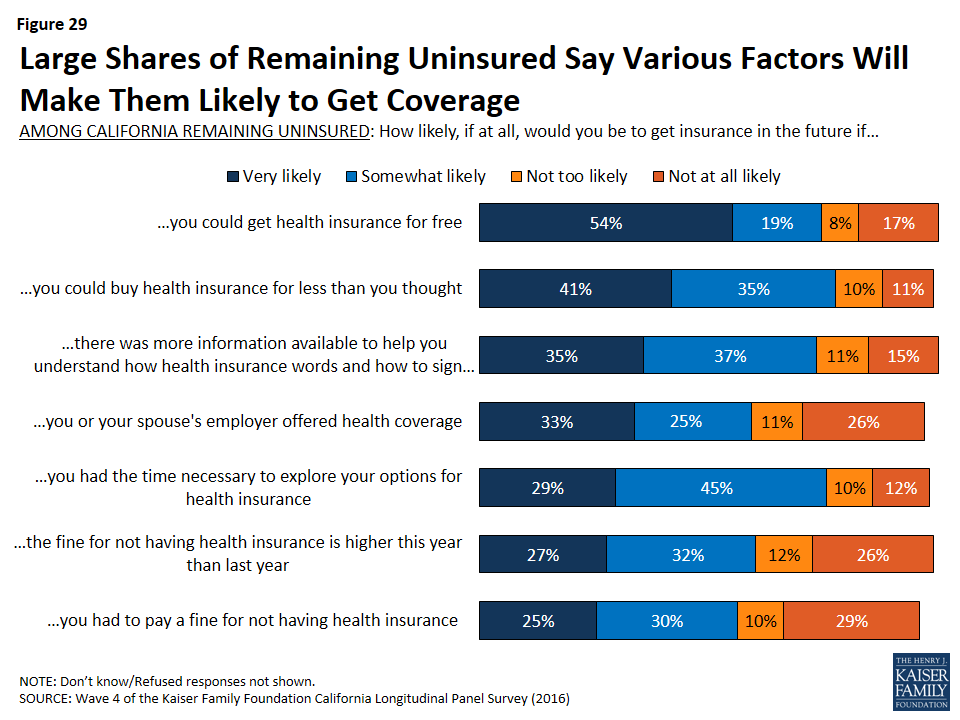
Figure 29: Large Shares of Remaining Uninsured Say Various Factors Will Make Them Likely to Get Coverage
Knowledge About Health Care Law Fines and Provisions
A large share (83 percent) of the remaining uninsured in California are aware of the health care law’s requirement that most Americans have health insurance or pay a fine, and most (54 percent) think that the requirement applies to them but more than one-third (37 percent) say the requirement does not apply to them.
In fact, nearly equal shares of the uninsured think they will have to pay a fine for not having health insurance (45 percent) as think they will not have to pay a fine (40 percent), with the remaining 15 percent unsure of whether or not they will have to pay a fine. It is important to note that many may in fact be exempt from the requirement due to financial hardship or other exceptions under the law, including exceptions for undocumented immigrants.
Smaller shares of the remaining uninsured are aware of provisions of the health care law, beyond the requirement to have coverage, intended to expand coverage to the uninsured and those with lower incomes. Just over half know that the law allowed for the expansion of the Medi-Cal program to cover more low-income Californians (54 percent), and half (49 percent) know that the law provides financial help to low- and moderate-income people to help them purchase health insurance coverage.
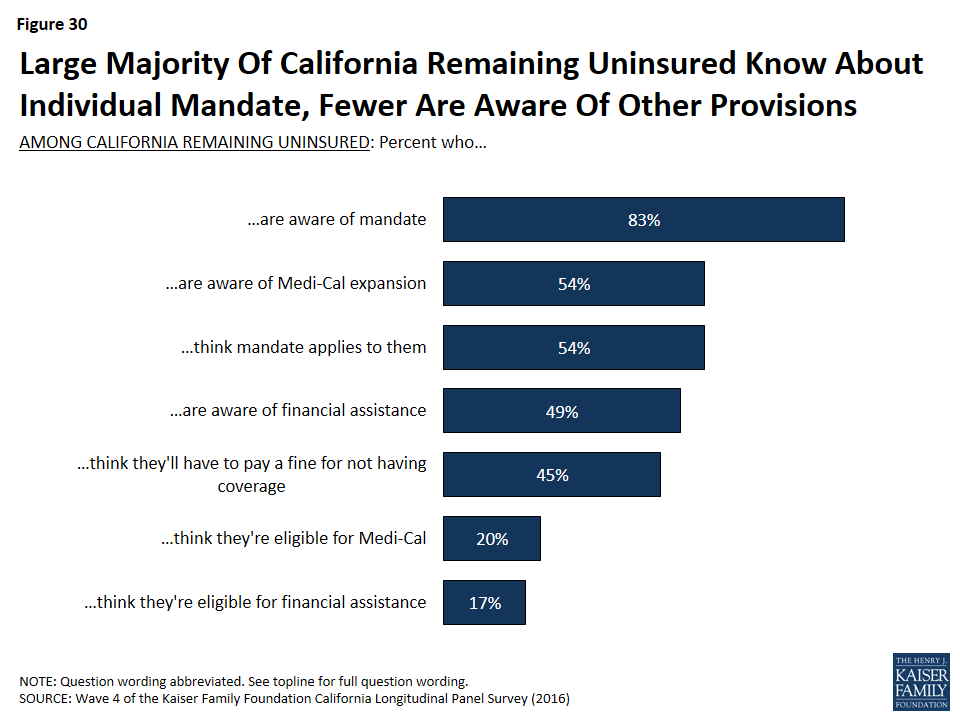
Figure 30: Large Majority Of California Remaining Uninsured Know About Individual Mandate, Fewer Are Aware Of Other Provisions
California’s Remaining Uninsured Immigrants
The Hispanic population is particularly important in California because Latinos make up the largest racial or ethnic group in the state, accounting for 39 percent of the population,2 and about seven in ten of the remaining uninsured are Hispanic (67 percent). Overall, one-third of California’s Hispanics remain uninsured. A significant portion of these uninsured Hispanics may not have insurance due to the fact that they are not eligible for coverage because of their immigration status. Of the total Hispanic population, about one-third (32 percent) are likely not eligible for health insurance coverage. Of all eligible Hispanics in this survey, three-fourths report having health insurance leaving one-fourth (24 percent) eligible for, but without health insurance coverage. This is compared to about one in five of white non-Hispanics who do not have health insurance coverage.
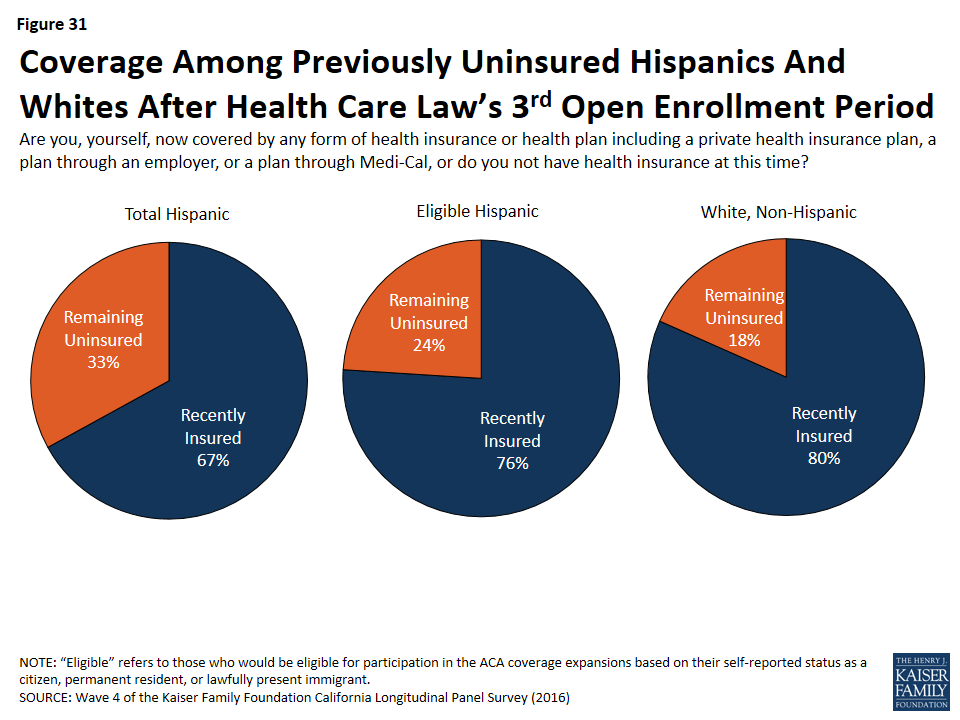
Figure 31: Coverage Among Previously Uninsured Hispanics And Whites After Health Care Law’s 3rd Open Enrollment Period
Half (55 percent) of uninsured Hispanics and two-thirds of uninsured Hispanics who completed the survey in Spanish say they are very or somewhat worried that if they sign up for health insurance, it will draw attention to their immigration status or that of a family member.
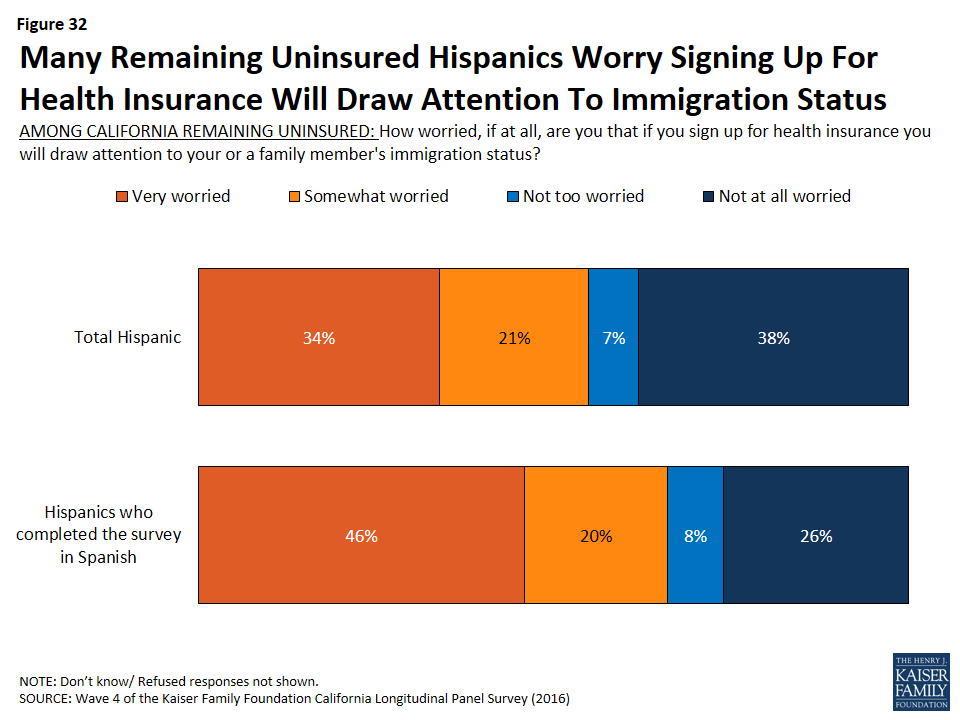
Figure 32: Many Remaining Uninsured Hispanics Worry Signing Up For Health Insurance Will Draw Attention To Immigration Status
In fact, concerns about immigration status exist for all California’s remaining uninsured who were born in another country — both Hispanics and non-Hispanics. One-fourth (27 percent) of California’s remaining uninsured worry that they or a family member could be deported if they sign up for health insurance. In addition, 50 percent of all uninsured who were born in another country worry that signing up for health insurance could hurt their ability to become a U.S. citizen.
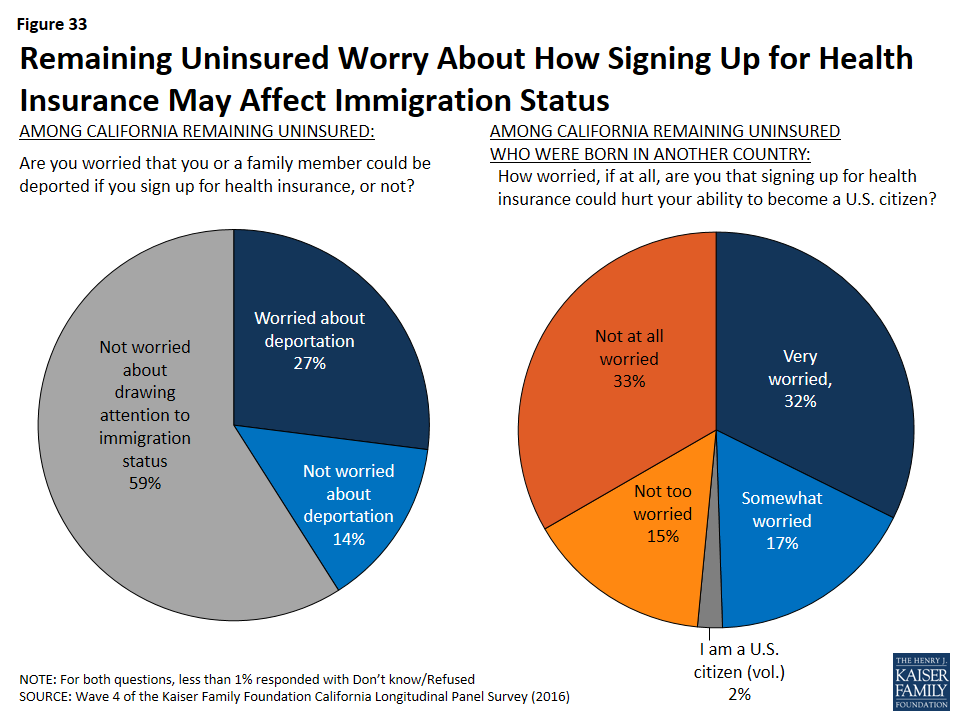
Figure 33: Remaining Uninsured Worry About How Signing Up for Health Insurance May Affect Immigration Status
Spanish Language Assistance
Navigating health insurance options and health care jargon can be confusing, and adding language differences to the equation has the potential to be an even bigger barrier to enrollment. However, Californians currently without health insurance who prefer to communicate in Spanish give largely positive feedback when asked how much information is available in Spanish and whether there are people in their community trained to help them sign up for insurance in Spanish. Most (65 percent) remaining uninsured Spanish speakers say that, in their experience, there is at least some information about signing up for insurance available in Spanish – about four in ten (39 percent) say there is a lot of information available and another 26 percent say there is some information available. There is still room for improvement though, as a third of Spanish-speaking remaining uninsured Californians report that there is only a little information available in Spanish (24 percent) or say that there is none available at all (7 percent). Six in ten Spanish-speaking uninsured report there are people in their community trained to help them sign up (compared to 72 percent in 2015), while one-third (35 percent) say that there are not people in their community trained to help and 6 percent say they do not know.
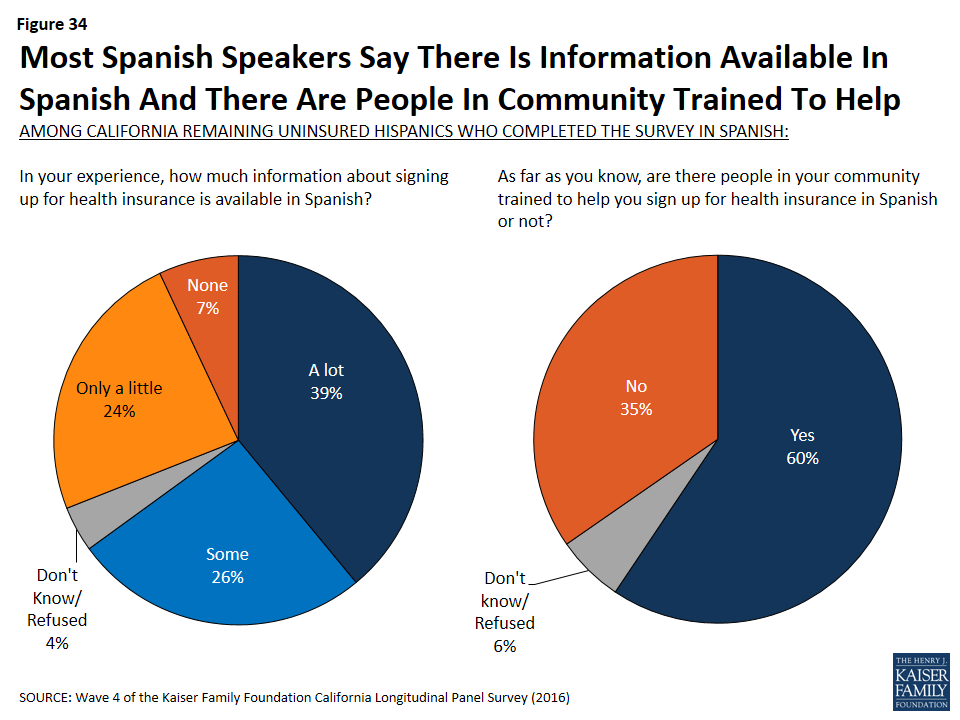
Figure 34: Most Spanish Speakers Say There Is Information Available In Spanish And There Are People In Community Trained To Help
Conclusion
The Kaiser Family Foundation California Longitudinal Panel Survey provides unique insights into the experiences and views of a representative, randomly selected sample of Californians who were uninsured prior to the major coverage expansions under the Affordable Care Act (ACA). The initial baseline survey was conducted with a representative sample of 2,001 nonelderly uninsured Californian adults in summer 2013, prior to the ACA’s initial open enrollment period. Because the same group of previously uninsured people has been followed over time, the survey is able to explore the dynamics of health insurance and track how many people have moved in to or back out of coverage since the baseline survey in 2013.
After three rounds of open enrollment under the Affordable Care Act, nearly three-fourths (72 percent) of Californians who were uninsured prior to the first open enrollment period now report that they have health insurance. This share is similar to the 68 percent who said they were insured after the second open enrollment period in the spring of 2015, and is an increase from 58 percent after the first open enrollment period in the spring of 2014. This indicates that the percent of Californians with health insurance may have reached a relatively steady rate, with less fluctuation in the market as individuals gain and keep coverage.
Most of California’s previously uninsured who reported having coverage after the first open enrollment period continued to report having coverage, but some have since become uninsured, while some others who reported being uninsured after the first open enrollment period or the second enrollment period now report having coverage. These dynamics indicate the potential challenges of getting and keeping coverage for the previously uninsured as well as potential opportunities for new enrollment gains among those who have potentially missed chances to enroll in the past. Future gains in coverage may be moderate, however, with the remaining shares of California’s previously uninsured consisting largely of harder-to-reach groups: those who are undocumented immigrants and therefore ineligible for coverage through the ACA and those who reported as of the baseline survey that they had been without coverage for two or more years or had never had health insurance. There is some lack of knowledge of the assistance that is currently available, which indicates that there is potential for outreach to make a difference.
Among the recently insured, there have been considerable gains in access and affordability compared to what they said in the baseline survey, but concerns about health care costs remain. The final fourth wave of the Kaiser Family Foundation California Longitudinal Panel Survey illustrates that while more individuals are gaining access to health insurance coverage, challenges still exist for both the remaining uninsured and those who now have health insurance coverage.
About The Terms Used In This Report
This report primarily uses the following definitions for key groups examined in the survey:
The overall group of Californians who were uninsured prior to the ACA’s first open enrollment period, most often referred to as “California’s previously uninsured.”
- The subgroup of previously uninsured Californians who currently report that they are uninsured, referred to as “California’s remaining uninsured.” This group includes some who reported having coverage in 2014 or 2015, some who reported not having coverage in 2014 or 2015, and some whose 2014 coverage status or 2015 coverage status is unknown because they were unable to be contacted during those years.
- The subgroup of previously uninsured Californians who now report that they have health insurance, referred to as “California’s recently insured.” Two subgroups within California’s recently insured are:
- Those who reported that they were uninsured in the summer of 2013 and either said in spring 2014 or spring 2015 that they did not have coverage or were unable to be contacted, but now report having health insurance, referred to as “California’s newly insured,” and
- Those who reported that they were uninsured in the summer of 2013, reported gaining insurance sometime in the past two years and say they still have coverage in spring 2016, referred to as “California’s still insured.”
And, as noted in the Survey Methodology Section, only those uninsured for at least two months were included in the baseline survey. Other terms used occasionally throughout the report are defined below.
- Eligible Previously Uninsured Californians: Because the coverage expansions under the ACA do not extend to undocumented immigrants, some of the analyses focuses on those who reported being U.S. citizens or permanent residents in the baseline survey, described in shorthand as those who are ‘eligible’ for the ACA’s coverage expansions.
- Undocumented Previously Uninsured Californians: For the purposes of this report, undocumented immigrants are defined as those who reported in the baseline survey that a) they were not born in the United States or Puerto Rico, b) they came to this country without a green card, and c) they have not received a green card or become a permanent resident since arriving. There are several ways that this definition, while workable for the purposes of a broad analysis of this sort, falls short of the complexity of real life. First, it relies on self-reporting, and since respondents have an incentive not to reveal unlawful immigration status, it is undoubtedly a somewhat imperfect measure. Second, those that did not answer all three in the series of immigration status items in the baseline survey were not able to be categorized. Third, by necessity of time and efficiency, the survey did not allow for a full exploration of the many nuances inherent in the U.S. immigration system. For example, this category may actually include a small number of individuals in California as refugees, asylees or other humanitarian immigrants who might better be placed among the ‘eligible uninsured’. The survey, unfortunately, does not allow this level of detailed sorting. Since estimated immigration status is based on individuals’ responses to the baseline survey, it is possible that some small share of those thought to be undocumented immigrants have now become permanent residents or received a green card.
- Income categories: Because eligibility for two of the law’s main components – the Medi-Cal expansion and the tax credits being made available to purchase insurance on the new exchanges – is based on an individual’s family income relative to the federal poverty level (FPL), in some cases we report survey results by FPL categories. Eligible previously uninsured Californians with incomes 138% FPL or less (roughly $33,000 a year for a family of 4 in 2015) are eligible for Medi-Cal coverage, while those with incomes greater than 138% and up to 400% FPL (roughly $33,000-$97,000 for a family of 4 in 2015), are eligible for subsidies to purchase insurance through Covered California Marketplace. Those with incomes above 400% FPL are allowed to buy insurance through Covered California but are not eligible for subsidy assistance. For convenience, we sometimes refer to the eligible group with incomes 138% FPL or less as the “Medi-Cal target group”, and those greater than 138% and up to 400% FPL as the “exchange subsidy target group”. These obviously are approximations that do not allow for every real world exception to be taken into account. For example, lawfully present immigrants may remain subject to a five year wait before they may enroll in Medi-Cal, but for the purposes of this analysis they are included in the Medi-Cal target group if they meet the income criteria. Similarly, some of those in the exchange subsidy target group may not be eligible for marketplace subsidies if they have access to affordable employer coverage, a situation difficult to ascertain in a phone survey.
Methodology
Survey Methodology
This is the fourth in a series of surveys by the Kaiser Family Foundation (KFF) tracking the views and experiences of a group of Californians who were uninsured in the summer of 2013, prior to implementation of the ACA’s insurance market reforms and coverage expansions through Covered California and Medi-Cal. The first survey (Wave 1) was conducted from July 11-August 29, 2013, with a randomly selected group of individuals who were uninsured at the time of the interview, and was paid for entirely by KFF. The second survey (Wave 2) was conducted from April 1-June 15, 2014. The third survey (Wave 3) was conducted from February 18-May 13, 2015, and the current survey (wave 4) was conducted from February 10-June 20, 2016, with the same longitudinal panel of respondents, whether they obtained coverage or remained uninsured. All four surveys were designed and analyzed by researchers at KFF. Social Science Research Solutions collaborated with KFF researchers on sample design, weighting, and supervised fieldwork. Fieldwork costs associated with Waves 2, 3, and 4 of the survey were paid for by The California Endowment.
The Wave 1 survey was conducted among a representative random sample of 2,001 adults ages 19-64 living in California who reported having been without health insurance for at least two months at the time of the interview1 (NOTE: persons without a telephone could not be included in the random selection process). Computer-assisted telephone interviews conducted by landline (990) and cell phone (1,011, including 660 who had no landline telephone) were carried out in English and Spanish by SSRS. To increase efficiency in reaching this low-incidence, hard-to-reach group, both the landline and cell phone sampling frames oversampled areas with a lower-income population (since being uninsured is negatively correlated with income). The landline sample frame also oversampled households whose phone numbers were matched with directory listings indicating the presence of at least one person age 19-64 and a household income of less than $25,000. Additionally, 230 interviews (130 landline, 100 cell phone) were conducted with respondents who previously completed recent national SSRS omnibus surveys of the general public and indicated they were ages 19-64 and uninsured. These previous surveys were conducted with nationally representative, random-digit-dial landline and cell phone samples. Waves 2, 3, and 4 also consisted of computer-assisted telephone interviews conducted in English and Spanish by landline and cell phone, including those who had no landline phone.
| Table 4: Comparing Respondent Contact Mode Across Waves | ||||
| Total | Landline | Cell phone (no landline) | Web | |
| Wave 1 (July 11-August 29, 2013) | 2,001 | 990 | 1,011 (660) | Not applicable |
| Wave 2 (April 1-June 15, 2014) | 1,219 | 623 | 545 (327) | 51 |
| Wave 3 (February 18-May 13, 2015) | 1,105 | 555 | 463 (317) | 87 |
| Wave 4 (February 10-June 20, 2016) | 1001 | 484 | 404 (240) | 113 |
In order to re-connect with respondents who may be more willing to complete the survey online, an abbreviated web version was introduced for Waves 2, 3, and 4 after attempts had been made to reach respondents by phone. The online questionnaire was offered in English and Spanish and was limited to key questions about insurance status, type of coverage, and reasons for obtaining coverage or remaining uninsured. A total of 51 respondents in Wave 2, 87 respondents in Wave 3, and 113 in Wave 4 completed the online version of the survey.
Screening for Waves 2, 3, and 4 involved verifying that the respondent had participated in Wave 1. Multiple attempts were made to reach every respondent from Wave 1 and encourage participation in later waves. Efforts included multiple dialing at various times of day and throughout the week, mailings and emails to those who provided such contact information, repeated dialing of non-working numbers, and attempts to find alternative phone numbers for non-working numbers.
A multi-stage weighting design was applied to ensure accurate representation of California’s nonelderly adult uninsured population prior to the ACA’s coverage expansions. The weighting process for Waves 2, 3, and 4 involved corrections for sample design, as well as sample weighting to match the weighted Wave 2 sample, weighted Wave 3 sample, and weighted Wave 4 sample to Wave 1 responses along demographic characteristics. As it did for Wave 1, the base weight for Waves 2, 3, and 4 accounted for the oversamples used in the sample design, as well as the likelihood of non-response for the sample from earlier omnibus surveys, number of eligible household members for the landline sample, and a correction to account for the fact that respondents with both a landline and cell phone have a higher probability of selection. Demographic weighting parameters for Waves 2, 3, and 4 were based on Wave 1 weighted demographics, which were adjusted for age, education, race/ethnicity, nativity (for Hispanics only), Hispanics by gender, presence of own child in household, marital status, California region, poverty level, and phone usage. For more information on weighting and data sources, see the Wave 1 methodology. All differences referred to in the report are statistically significant. Statistical tests of significance account for the effect of weighting, and, for trend analysis, testing takes into account the survey’s panel design.
A unique consideration for panel surveys such as the Kaiser Family Foundation California Longitudinal Panel Survey, is whether those who participate in subsequent waves are different in terms of their attitudes or demographics than those who refuse to participate again or were unable to be re-contacted. Of the total 2,001 respondents who completed Wave 1, 1,219 participated in Wave 2, 1,105 completed Wave 3, and 1001 completed Wave 4. These completion rates are within an expected range given that the uninsured are already an often a difficult to reach population since many are lower income, younger, undocumented immigrants, and members of racial/ethnic minority groups, and may change phone numbers or move more often than the public at large. After data collection was complete, data from Wave 1 and Wave 4 were compared to evaluate the impact of some respondents not completing Wave 4, referred to as attrition. While there are some differences in the unweighted demographics of those who completed Wave 4 and the full Wave 1 sample, these observable differences are corrected for by weighting. As shown in the table below the total weighted distributions are similar for Wave 1 and Wave 4 for age, gender, race/ethnicity, party identification, education and income. See the Wave 4 Attrition Appendix for more information on attrition.
| Table 5: Comparing Respondent Demographics | ||||||||
| Unweighted | Weighted | |||||||
| Wave 1
(n=2001) |
Completed Wave 4
(n=1001) |
Completed all 4 Waves
(n=764) |
Percentage Point Difference (W1 – W4 Total) |
Wave 1 | Completed Wave 4 | Completed all 4 Waves | Percentage Point Difference (W1 – W4 Total) |
|
| Gender | ||||||||
| Male | 48% | 43% | 41% | 5 | 54% | 53% | 50% | 1 |
| Female | 52% | 57% | 59% | -5 | 46% | 47% | 50% | -1 |
| Race/ethnicity | ||||||||
| White | 27% | 33% | 36% | -6 | 26% | 27% | 28% | -1 |
| Black | 7% | 8% | 8% | -1 | 5% | 5% | 5% | 0 |
| Hispanic | 58% | 51% | 50% | 7 | 56% | 55% | 54% | 1 |
| Other Race | 8% | 8% | 7% | 0 | 13% | 12% | 13% | 1 |
| Age | ||||||||
| 18 to 29 | 23% | 19% | 17% | 4 | 33% | 31% | 28% | 2 |
| 30 to 39 | 21% | 19% | 19% | 2 | 24% | 23% | 24% | 1 |
| 40 to 49 | 22% | 20% | 19% | 2 | 21% | 22% | 23% | -1 |
| 50 to 64 | 35% | 43% | 45% | -8 | 22% | 24% | 25% | -2 |
| Education | ||||||||
| HS or less | 57% | 49% | 47% | 8 | 58% | 57% | 57% | 1 |
| Some college | 28% | 33% | 34% | -5 | 29% | 29% | 29% | 0 |
| College Grad+ | 15% | 17% | 18% | -2 | 12% | 13% | 14% | -1 |
| Phone status | ||||||||
| Landline | 49% | 55% | 56% | -6 | 42% | 45% | 48% | -3 |
| Cell | 51% | 45% | 44% | 6 | 58% | 55% | 52% | 3 |
| Marital status | ||||||||
| Married | 33% | 34% | 33% | -1 | 37% | 38% | 37% | -1 |
| Not Married | 67% | 65% | 67% | 2 | 62% | 62% | 63% | 0 |
| Family income | ||||||||
| <138% FPL | 60% | 57% | 57% | 3 | 52% | 53% | 55% | -1 |
| 138%-400% FPL | 30% | 33% | 33% | -3 | 36% | 34% | 33% | 2 |
| 400%+ | 5% | 6% | 6% | -1 | 7% | 7% | 6% | 0 |
| Language of interview | ||||||||
| English | 63% | 70% | 72% | -7 | 65% | 66% | 64% | -1 |
| Spanish | 37% | 30% | 28% | 7 | 35% | 34% | 34% | 1 |
| Resident Status | ||||||||
| Citizen/ legal immigrant | 79% | 85% | 86% | -6 | 78% | 81% | 81% | -3 |
| Undocumented immigrant | 20% | 14% | 13% | 6 | 21% | 18% | 18% | 3 |
| Party Identification | ||||||||
| Republican | 11% | 13% | 13% | -2 | 11% | 11% | 12% | 0 |
| Democrat | 35% | 39% | 39% | -4 | 32% | 34% | 34% | -2 |
| Independent | 35% | 32% | 32% | 3 | 37% | 36% | 35% | 1 |
| Other | 9% | 8% | 8% | 1 | 9% | 9% | 9% | 0 |
Another consideration for panel surveys is the potential for “sensitization effects,” that is, what effect returning to the same people about the same topics has on their experiences or views. For example, after taking the baseline survey that covered many aspects of the coverage expansions under the ACA, were people more likely to seek out information about health insurance and enroll than they would have been otherwise? While there is no direct way to measure this effect on this survey, other analyses have found that these effects are minimal and short-lived,2 and we do not believe they would have had a substantial impact on results presented here, particularly given all the other media coverage, advertising, and outreach targeted at this population during the fall and winter of 2013, 2014, and 2015.
The margin of sampling error including the design effect for the full sample is plus or minus 5 percentage points. For the recently insured, it is plus or minus 5 percentage points and for the remaining uninsured it is plus or minus 9 percentage points. Numbers of respondents and margin of sampling error for key subgroups are shown in the table below.
| Table 6: Margin of Sampling Errors Across Subgroups | |||||
| Group | N | MOSE | |||
| Total Wave 4 | 1001 | +/- 5 percentage points | |||
| Recently Insured | 781 | +/- 5 percentage points | |||
| Recently insured by Medi-Cal | 393 | +/- 7 percentage points | |||
| Recently insured by non-group plan | 147 | +/- 11 percentage points | |||
| Recently insured through Covered California | 121 | +/- 12 percentage points | |||
| Recently insured through an employer | 180 | +/- 10 percentage points | |||
| Recently insured Hispanics | 366 | +/- 7 percentage points | |||
| Remaining Uninsured | 218 | +/- 9 percentage points | |||
| Remaining uninsured Hispanics | 143 | +/- 11 percentage points | |||
For results based on other subgroups, the margin of sampling error may be higher. Sample sizes and margin of sampling errors for other subgroups are available by request. Note that sampling error is only one of many potential sources of error in this or any other public opinion poll.
Some demographic measures referred to in the report were only asked during the baseline survey, such as questions about educational attainment, debilitating chronic condition, length of time uninsured, resident status, and race/ethnicity. For more information on the first and second waves of the Kaiser Family Foundation California Longitudinal Panel Survey visit:
Wave 1: https://www.kff.org/health-reform/report/californias-uninsured-on-the-eve-of-aca-open-enrollment/
Appendices
Findings Appendix
Table A1: Demographic Profiles Of Each Group Of Newly Insured, Still Insured, and Remaining Uninsured Californians |
||||
| NEWLY INSURED IN 2016
(15%) |
STILL INSURED IN 2016
(57%) |
REMAINING UNINSURED IN 2016
(28%) |
||
| AGE | 19-29 | 32% | 21% | 24% |
| 30-49 | 35% | 42% | 55% | |
| 50-64 | 32% | 31% | 19% | |
| 65+ | 2% | 6% | 1% | |
| RACE | White non-Hispanic | 19% | 33% | 18% |
| Black non-Hispanic | 8% | 5% | 4% | |
| Other non-Hispanic | 26% | 13% | 9% | |
| Hispanic | 59% | 48% | 67% | |
| Hispanic, eligible | 30% | 40% | 33% | |
| GENDER | Male | 57% | 51% | 53% |
| Female | 43% | 49% | 47% | |
| LENGTH OF TIME UNINSURED PRIOR TO ACA | 2 months to less than a year | 6% | 15% | 8% |
| 1 year to less than 2 years | 6% | 16% | 12% | |
| 2 years or more | 43% | 49% | 39% | |
| Never had insurance | 45% | 21% | 41% | |
| EMPLOYMENT | Employed | 58% | 67% | 57% |
| Unemployed | 14% | 11% | 19% | |
| A student, retired, on disability, or stay at home parent | 26% | 21% | 24% | |
| EDUCATION | High school or less | 52% | 51% | 72% |
| Some college | 31% | 32% | 22% | |
| College or more | 13% | 16% | 6% | |
| HEALTH STATUS | Excellent/ Very good/ Good | 61% | 59% | 70% |
| Fair/ Poor | 39% | 41% | 30% | |
| MARITAL STATUS | Married | 22% | 42% | 42% |
| Not married | 77% | 57% | 58% | |
| FAMILY INCOME | Less than 138% FPL | 56% | 51% | 56% |
| Between 138% – 400% FPL | 41% | 37% | 37% | |
| Over 400% FPL | 3% | 11% | 6% | |
| DEBILITATING CHRONIC CONDITION | Yes | 12% | 20% | 8% |
| No | 87% | 79% | 92% | |
| PERSONALLY CONTACTED | Yes, been contacted | 30% | 32% | 15% |
| No, have not been contacted | 70% | 67% | 84% | |
Wave 4 Attrition Appendix
A unique consideration for panel surveys such as the Kaiser Family Foundation California Longitudinal Panel Survey is whether those who participate in subsequent waves are different in terms of their attitudes or demographics than those who refuse to participate again or were unable to be re-contacted. Of the total 2,001 respondents who completed Wave 1, 1,219 participated in Wave 2, 1,105 completed Wave 3, and 1,001 completed Wave 4. These completion rates are within an expected range given that the uninsured are already a difficult to reach population since many are lower income, younger, undocumented immigrants, and members of racial/ethnic minority groups, and may change phone numbers or move more often than the public at large. After data collection was complete, data from Wave 1 and Wave 4 were compared to evaluate the impact of some respondents not completing Wave 4, referred to as attrition. Wave 4 respondents included those who completed all four waves (n=764) as well as those who completed Waves 1 and 4 only (n=52), those who completed Waves 1, 2, and 4 (n=87), and those who completed Waves 1, 3, and 4 (n=98). The analysis was designed to assess whether: (1) The makeup of respondents differed systematically between the waves; and (2) whether these differences correspond with bias as far as the study’s substantive questions.
As detailed below in Table A1, we compared Wave 1 question responses for the total Wave 1 and Wave 4 samples to assess whether Wave 4 consists of respondents who answered Wave 1 differently than the full Wave 1 sample. The table also includes comparisons for the subsample of Wave 4 respondents who have completed all four waves. The weighted columns indicate whether any differences in sample characteristics and substantive responses were minimized through Wave 4 weighting. The comparison indicates that the greatest difference between the complete Wave 1 sample and the Wave 4 sample centers on respondents with lower educational attainment (8 percentage points less in Wave 4), Spanish speaking (7 percentage points less in Wave 4), undocumented respondents (6 percentage points less in Wave 4), male respondents (5 percentage points less in Wave 4), cell phone respondents (6 percentage points less in Wave 4), and respondents under age 30 (4 percentage points less in Wave 4), along with an increase in the share of white respondents as well as a decrease in the share of Hispanic respondents (6 and 7 percentage points, respectively). This seems to indicate that the harder-to-reach (namely undocumented), more transient (cell phone), and younger respondents were slightly less likely to be reached and to complete the Wave 4 interview. These differences are similar to the differences among those who completed all four waves of the survey. However, these demographic differences between the samples did not translate into meaningful differences on the questions of self-reported party identification, self-reported health status, or whether respondents reported having a usual source of care at Wave 1. Furthermore, once the sample was weighted as it would be in any case, only slight demographic differences remained. The variables not included in the weighting were hardly affected by weighting, or became more similar to Wave 1 (Table A2). Overall, this analysis finds fairly small observable differences between Wave 4 respondents and the full Wave 1 sample as far as Wave 1 responses. Attrition does not appear to introduce significant bias, and most differences are addressed by weighting (that was specifically designed to match the Wave 1 sample, adding parameters such as language of interview and income relative to the federal poverty level (FPL)).
| Table A2: Wave 1 To Wave 4 Sample Comparisons For Wave 1 Questions (Weighted And Unweighted) | ||||||||
| Unweighted | Weighted | |||||||
| Wave 1 (n=2001) |
Completed Wave 4 (n=1001) |
Completed all 4 Waves (n=764) | Percentage Point Difference (W1 – W4 Total) |
Wave 1 | Completed Wave 4 | Completed all 4 Waves | Percentage Point Difference (W1 – W4 Total) |
|
| Gender | ||||||||
| Male | 48% | 43% | 41% | 5 | 54% | 53% | 50% | 1 |
| Female | 52% | 57% | 59% | -5 | 46% | 47% | 50% | -1 |
| Race/ Ethnicity | ||||||||
| White | 27% | 33% | 36% | -6 | 26% | 27% | 28% | -1 |
| Black | 7% | 8% | 8% | -1 | 5% | 5% | 5% | 0 |
| Hispanic | 58% | 51% | 48% | 7 | 56% | 55% | 54% | 1 |
| Other Race | 8% | 8% | 8% | 0 | 13% | 12% | 13% | 1 |
| Age | ||||||||
| 19 to 29 | 23% | 19% | 17% | 4 | 33% | 31% | 28% | 2 |
| 30 to 39 | 21% | 19% | 19% | 2 | 24% | 23% | 24% | 1 |
| 40 to 49 | 22% | 20% | 19% | 2 | 21% | 22% | 23% | -1 |
| 50 to 64 | 35% | 43% | 45% | -8 | 22% | 24% | 25% | -2 |
| Education | ||||||||
| HS or less | 57% | 49% | 47% | 8 | 58% | 57% | 57% | 1 |
| Some college | 28% | 33% | 34% | -5 | 29% | 29% | 29% | 0 |
| College Grad+ | 15% | 17% | 18% | -2 | 12% | 13% | 14% | -1 |
| Phone status | ||||||||
| Landline | 49% | 55% | 56% | -6 | 42% | 45% | 48% | -3 |
| Cell | 51% | 45% | 44% | 6 | 58% | 55% | 52% | 3 |
| Marital status | ||||||||
| Married | 33% | 34% | 33% | -1 | 37% | 38% | 37% | -1 |
| Not Married | 67% | 65% | 67% | 2 | 62% | 62% | 63% | 0 |
| Family income | ||||||||
| <138% FPL | 60% | 57% | 57% | 3 | 52% | 53% | 55% | -1 |
| 138%-400% FPL | 30% | 33% | 33% | -3 | 36% | 34% | 33% | 2 |
| 400%+ FPL | 5% | 6% | 6% | -1 | 7% | 7% | 6% | 0 |
| Language of interview | ||||||||
| English | 63% | 70% | 72% | -7 | 65% | 66% | 64% | -1 |
| Spanish | 37% | 30% | 28% | 7 | 35% | 34% | 34% | 1 |
| Table A3: Wave 1 And Wave 4 Sample Comparisons For Wave 1 Questions Not Used In Weighting (Weighted And Unweighted) | ||||||||
| Unweighted | Weighted | |||||||
| Wave 1 (n=2001) |
Completed Wave 4 (n=1001) |
Completed all 4 Waves (n=764) | Percentage Point Difference (W1 – W4 Total) |
Wave 1 | Completed Wave 4 | Completed all 4 Waves | Percentage Point Difference (W1 – W4 Total) |
|
| Resident Status | ||||||||
| Citizen/ legal immigrant | 79% | 85% | 86% | -6 | 78% | 81% | 81% | -3 |
| Undocumented immigrant | 20% | 14% | 13% | 6 | 21% | 18% | 18% | 3 |
| Party Identification | ||||||||
| Republican | 11% | 13% | 13% | -2 | 11% | 11% | 12% | 0 |
| Democrat | 35% | 39% | 39% | -4 | 32% | 34% | 34% | -2 |
| Independent | 35% | 32% | 32% | 3 | 37% | 36% | 35% | 1 |
| Other | 9% | 8% | 8% | 1 | 9% | 9% | 9% | 0 |
| Length of time uninsured prior to ACA | ||||||||
| 2 months to less than a year | 12% | 11% | 11% | 1 | 13% | 11% | 11% | 2 |
| 1 year to less than 2 years | 12% | 12% | 13% | 0 | 14% | 13% | 15% | 1 |
| 2 years or more | 48% | 53% | 55% | -5 | 44% | 45% | 45% | -1 |
| Never insured | 28% | 23% | 21% | 5 | 29% | 30% | 30% | -1 |
| Self-reported health status | ||||||||
| Excellent/Very good/Good | 59% | 60% | 60% | -1 | 62% | 62% | 64% | 0 |
| Fair/Poor | 41% | 40% | 40% | 1 | 38% | 37% | 36% | -1 |
| Debilitating Chronic Condition | ||||||||
| Yes | 16% | 19% | 21% | -3 | 13% | 15% | 15% | -2 |
| No | 84% | 81% | 79% | 3 | 87% | 84% | 85% | 3 |
| Usual place for care | ||||||||
| Yes | 61% | 63% | 63% | -2 | 56% | 57% | 57% | -1 |
| No | 39% | 36% | 37% | 3 | 43% | 42% | 43% | 1 |
An indicator consistent with this observation is the mean Wave 1 Weight of the Wave 4 sample. This value, 0.979 (SE=0.031), indicates that the measure to which Wave 4 respondents further accentuated Wave 1 non-response patterns (corresponding with smaller weights) was relatively small, about 2%. For those who responded to all four waves, this value was slightly smaller (0.973; SE=0.036), but still indicative of overall similarity between responders and non-responders.
We also compared the unweighted demographics for those who completed Wave 4 with those who didn’t (a typical nonresponse analysis) and there are some differences between these two groups. Those who did not participate in Wave 4 were somewhat more likely to be younger, male, Hispanic, undocumented, have lower levels of education, report never having had health insurance, or prefer taking the survey in Spanish. In order to further isolate the demographic factors associated with completing the Wave 4 survey or not, we conducted a logistic regression analysis. After controlling for demographic characteristics such as income, race/ethnicity, and party identification, the factors associated with completing Wave 4 include being interviewed on a landline telephone, being older, having a disability, and having higher levels of education. The factors associated with not completing Wave 4 are being male and being Hispanic as well as being undocumented. This pattern is similar when looking at those who completed all 4 waves as well as those who have not participated since taking the initial baseline survey. As noted above, weighting corrects for some of these differences.
Endnotes
Introduction
Kaiser Family Foundation analysis of 2013 ASEC Supplement to the Current Population Survey.
Kaiser Family Foundation, California’s Uninsured On The Eve Of ACA Open Enrollment, September 2013, https://www.kff.org/health-reform/report/californias-uninsured-on-the-eve-of-aca-open-enrollment/.
Kaiser Family Foundation, Where Are California’s Uninsured Now? Wave 2 Of The Kaiser Family Foundation California Longitudinal Panel Survey, July 2014, https://www.kff.org/health-reform/report/where-are-californias-uninsured-now-wave-2-of-the-kaiser-family-foundation-california-longitudinal-panel-survey/.
Kaiser Family Foundation, California’s Previously Uninsured After The ACA’s Second Open Enrollment Period, July 2015, https://www.kff.org/health-reform/report/californias-previously-uninsured-after-the-acas-second-open-enrollment-period/.
Section 1: Coverage among the Previously Uninsured
For the purposes of this report, the ‘eligible uninsured’ are California residents who said they had been uninsured for at least two months in the baseline survey and would be eligible for participation in the ACA coverage expansion based on their self-reported status as a citizen, permanent resident, or lawfully present immigrant. See the “About The Terms In This Report” Section for more details.
See the “About The Terms In This Report” Section for more details.
The total share with non-group coverage, including those in Covered California, remained stable in the past three waves.
It is important to note that among individuals with health insurance through Covered California, the most common reason for changing health insurance plans was that they found a plan with a lower monthly premium, however, the number of individuals in this group is too small to report.
The analysis of the dynamics of health insurance includes those who were unable to be contacted in spring 2014 or spring 2015. For instances of missing data from the most recent survey, their previous insurance status is reported. The only criteria for being included in this group is completing either Wave 2 or Wave 3 and completing both Wave 1 and Wave 4 surveys.
As previously mentioned, the analysis of the dynamics of health insurance includes those who were unable to be contacted in spring 2014 or spring 2015. For instances of missing data from the most recent survey, their previous insurance status is reported. The only criteria for being included in this group is either reporting being uninsured in Wave 2, not completing Wave 3, and reporting being insured in Wave 4; or not completing Wave 2, reporting being uninsured in Wave 3, and reporting being insured in Wave 4.
Section 3: The Remaining Uninsured
See the “About The Terms In This Report” Section for more details.
US Census Bureau, California State & County QuickFacts http://quickfacts.census.gov/qfd/states/06000.html
Methodology
Those who had been uninsured for less than two months were excluded from the survey since they may be experiencing a short period of uninsurance (i.e. someone who is between jobs), and the goal of the survey was to capture the experiences and views of those who have been without insurance for a longer period of time and are poised to experience the new coverage provisions of the ACA.
M. Brodie, “Sensitization Effects in a Study of the Impact of a Nationally Broadcast Special on Health Care Reform,” in Doctoral Thesis: Political Institutions, Participation, and Media Evaluations— Influences on Health Care Policy (Boston, Mass.: Harvard University, 1995).