2018 Employer Health Benefits Survey
Employer-sponsored insurance covers over half of the non-elderly population; approximately 152 million nonelderly people in total.1 To provide current information about employer-sponsored health benefits, the Kaiser Family Foundation (KFF) conducts an annual survey of private and non-federal public employers with three or more workers. This is the twentieth survey and reflects employer-sponsored health benefits in 2018.
PLAN ENROLLMENT
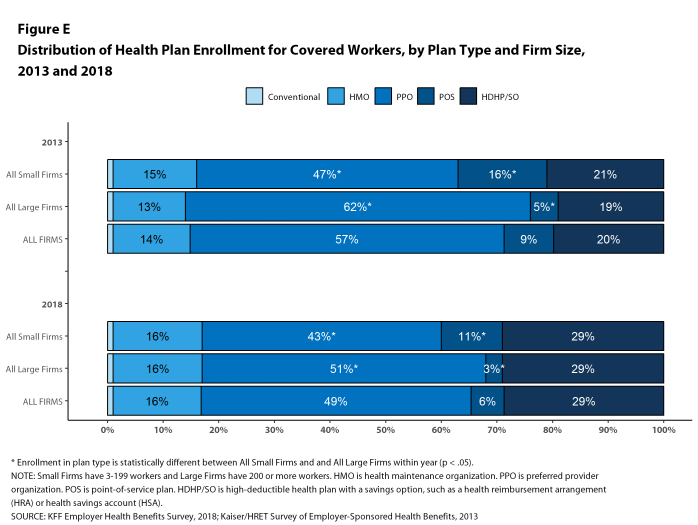
PPOs continue to be the most common plan type, enrolling 49% of covered workers in 2018. Twenty-nine percent of covered workers are enrolled in a high-deductible plan with a savings option (HDHP/SO), 16% in an HMO, 6% in a POS plan, and less than one percent in a conventional (also known as an indemnity) plan [Figure E]. Covered workers in the South (55%) are more likely to be enrolled in PPOs than workers in other regions. Covered workers in the Midwest (39%) are more likely to be enrolled in HDHP/SOs than workers in other regions, while covered workers in the West (19%) are less likely to be enrolled in HDHP/SOs. The share of covered workers enrolled in POS plans decreased from 10% in 2017 to 6% this year.
Figure E: Distribution of Health Plan Enrollment for Covered Workers, by Plan Type and Firm Size, 2013 and 2018
Self-Funding. Sixty-one percent of covered workers, including 13% of covered workers in small firms and 81% in large firms, are enrolled in plans that are either partially or completely self-funded. The percentage of covered workers in self-funded plans increases as the number of workers in a firm increases. The percentages of small and large firms with self-funded plans are similar to those last year.
In recent years, insurers have begun offering health plans that provide a nominally self-funded option for small or mid-sized employers that incorporates stoploss insurance with relatively low attachment points. These plans are sometimes referred to as level-funded plans because insurers calculate an expected monthly expense for the employer that includes a share of the estimated annual expense for benefits, the premiums for the stoploss protection, and an administrative fee. Due to the complexity of the funding (and regulatory status) of these plans, and because employers often pay a monthly amount that resembles a premium, they may be confused as to whether or not their health plan is self-funded or insured. To test this, we asked employers with fewer than 200 workers that responded that they had an insured health plan whether they had a level-funded plan. Among small firms that responded that they had an insured plan, 6% reported that they had a level-funded plan.
EMPLOYEE COST SHARING
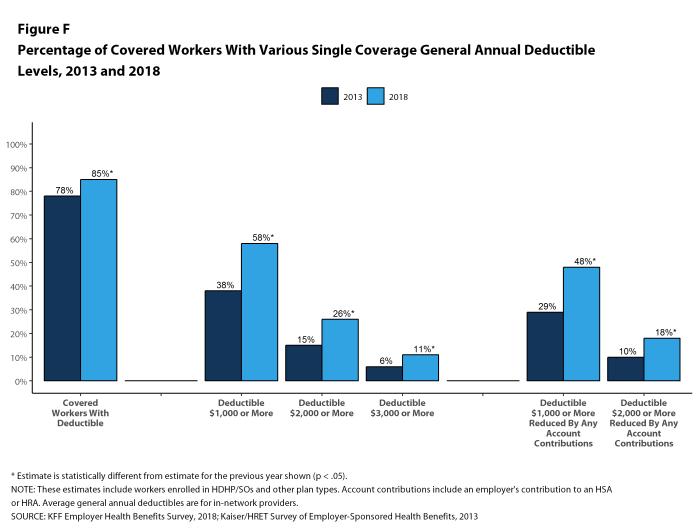
Most covered workers must pay a share of the cost when they use health care services. Eighty-five percent of covered workers have a general annual deductible for single coverage that must be met before most services are paid for by the plan, an increase from last year [Figure F]. Even workers without a general annual deductible often face other types of cost sharing when they use services, such as copayments or coinsurance for office visits and hospitalizations.
Among covered workers with a general annual deductible, the average deductible amount for single coverage is $1,573, similar to the average deductible last year. The average deductible for covered workers is higher in small firms than large firms ($2,132 vs. $1,355).
Assigning a zero deductible amount to those in plans without a general annual deductible, the average deductible among all covered workers is $1,350, an increase from the amount last year ($1,221). Over the past five years, the average annual deductible among all covered workers has increased 53%. Forty-two percent of covered workers in small firms and 20% of covered workers in large firms are in a plan with a deductible of at least $2,000 for single coverage, similar to the percentages last year.
Deductibles have increased in recent years due to higher deductibles within plan types and higher enrollment in HDHP/SOs. While growing deductibles in PPOs and other plan types generally increase enrollee out-of-pocket liability, the shift in enrollment to HDHP/SOs does not necessarily do so because most HDHP/SO enrollees receive an account contribution from their employers. Eight percent of covered workers in an HDHP with a Health Reimbursement Arrangement (HRA) and 2% of covered workers in a Health Savings Account (HSA)-qualified HDHP receive an account contribution for single coverage at least equal to their deductible, while another 37% of covered workers in an HDHP with an HRA and 26% of covered workers in an HSA-qualified HDHP receive account contributions that, if applied to their deductible, would reduce their deductible to less than $1,000.
Whether they face a general annual deductible or not, a large share of covered workers also pay a portion of the cost when they visit an in-network physician. For primary care, 66% of covered workers have a copayment (a fixed dollar amount) when they visit a doctor and 24% have coinsurance (a percentage of the covered amount). For specialty care, 64% face a copayment and 27% face coinsurance. The average copayments are $25 for primary care and $40 for specialty care. The average coinsurance is 18% for both primary and specialty care. These amounts are similar to those in 2017.
Most workers also face additional cost sharing for a hospital admission or outpatient surgery. After any general annual deductible is met, 68% of covered workers have coinsurance and 11% have a copayment for hospital admissions. The average coinsurance rate for a hospital admission is 19% and the average copayment is $284 per hospital admission. The cost-sharing provisions for outpatient surgery follow a similar pattern to those for hospital admissions.
While almost all (99%) covered workers are in plans with a limit on in-network cost sharing (called an out-of-pocket maximum) for single coverage, there is considerable variation in the actual dollar limits. Fourteen percent of covered workers in plans with an out-of-pocket maximum for single coverage have an out-of-pocket maximum of less than $2,000, while 20% have an out-of-pocket maximum of $6,000 or more.
AVAILABILITY OF EMPLOYER-SPONSORED COVERAGE
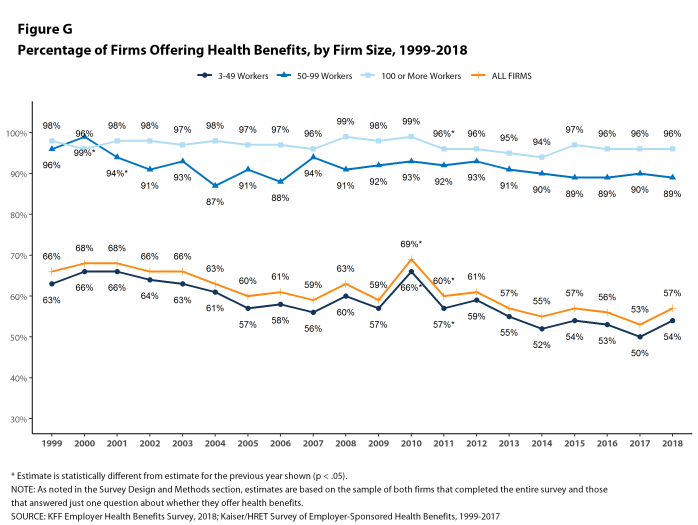
Fifty-seven percent of firms offer health benefits to at least some of their workers, similar to the percentage last year [Figure G]. The likelihood of offering health benefits differs significantly by firm size; for example, only 47% of firms with 3 to 9 workers offer coverage, while virtually all firms with 1,000 or more workers offer coverage.
While the vast majority of firms are small, most workers work for large firms that offer coverage. In 2018, 90% of workers are employed by a firm that offers health benefits to at least some of its workers.
Even in firms that offer health benefits, some workers are not eligible to enroll (e.g., waiting periods or part-time or temporary work status) and others who are eligible choose not to enroll (e.g., they feel the coverage is too expensive or they are covered through another source). In firms that offer coverage, 79% of workers are eligible for the health benefits offered, and of those eligible, 76% take up the firm’s offer, resulting in 60% of workers in offering firms enrolling in coverage through their employer. All of these percentages are similar to 2017.
Looking across workers both in firms that offer and those that do not offer health benefits, 53% of workers are covered by health plans offered by their employer, similar to the percentage last year.
Coverage for Family Members. Among firms offering health benefits, 97% of small firms and 99% of large firms offer coverage to spouses of eligible workers. Similarly, 95% of small firms and 100% of large firms offering health benefits offer coverage to other dependents of their eligible workers, such as children.
Inducements Not to Enroll. Among all firms that offer health benefits, 13% provide additional compensation or benefits to employees if they enroll in a spouse’s plan, and 16% provide additional compensation or benefits to employees if they do not participate in the firm’s health benefits.
HEALTH AND WELLNESS PROGRAMS
Firms continue to show considerable interest in programs that help workers identify health issues and manage chronic conditions, including health risk assessments, biometric screenings, and health promotion programs.
Health Risk Assessments. Among firms offering health benefits, 37% of small firms and 62% of large firms provide workers the opportunity to complete a health risk assessment. A health risk assessment includes questions about a person’s medical history, health status, and lifestyle. Fifty-one percent of large firms with a health risk assessment program offer an incentive to encourage workers to complete the assessment. Incentives may include: gift cards, merchandise or similar rewards; lower premium contributions or cost sharing; and financial rewards, such as cash, contributions to health-related savings accounts, or avoiding a payroll fee.
Biometric Screenings. Among firms offering health benefits, 21% of small firms and 50% of large firms provide workers the opportunity to complete a biometric screening. A biometric screening is an in-person health examination that measures a person’s risk factors, such as body mass index (BMI), cholesterol, blood pressure, stress, and nutrition. We do not consider preventive health services covered by the plan to be biometric screening. Sixty percent of large firms with biometric screening programs offer workers an incentive to complete the screening, similar to the incentives for completing health risk assessments.
Additionally, among large firms with biometric screening programs, 15% reward or penalize workers based on achieving specified biometric outcomes (such as meeting a target BMI). The size of these incentives varies considerably: among large firms offering a reward or penalty for meeting biometric outcomes, the maximum reward is valued at $150 or less in 15% of firms and more than $1,000 in 19% of firms.
Health and Wellness Promotion Programs. A majority of firms offering health benefits offer programs to help workers identify health risks and unhealthy behaviors, and improve their lifestyles. Fifty-three percent of small firms and 82% of large firms offer a program in at least one of these areas: smoking cessation; weight management; and behavioral or lifestyle coaching. Among large firms offering at least one of these programs, 35% offer workers an incentive to participate in or complete the program.
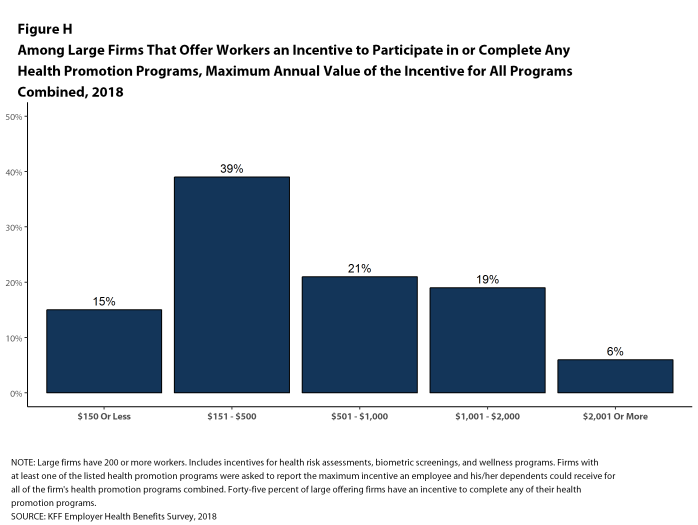
As health screenings and wellness programs have become more complex, incentives have become more sophisticated and may involve participating in or meeting goals in different programs (e.g., completing an assessment and participating in a health promotion activity). To better understand the combined incentives or penalties facing program participants, we asked large firms that had any incentives for health risk assessments, biometric screenings, or the specified health and wellness promotion programs what the maximum incentive was for a worker for all of their programs combined. Among large firms with any type of incentive, 15% have a maximum incentive of 150 or less; 39% have a maximum incentive between $151 and $500; 21% have a maximum incentive between $501 and $1,000; 19% have a maximum incentive between $1,001 and $2,000; and 6% have a maximum incentive of more than $2,000 [Figure H].
SITES OF CARE
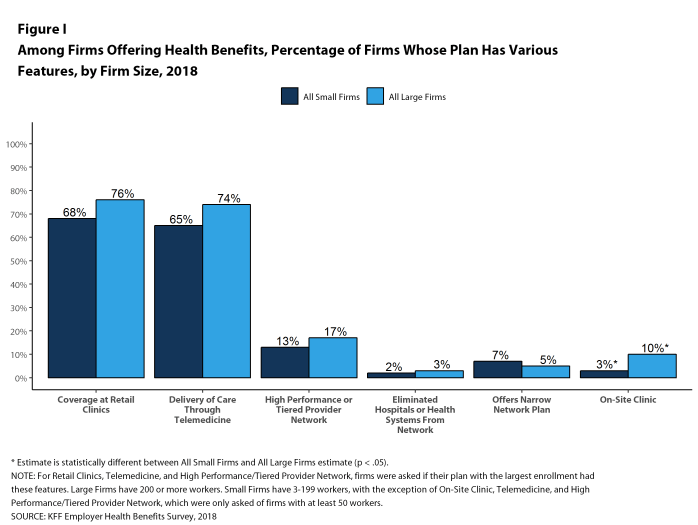
Telemedicine. Seventy-four percent of large firms offering health benefits cover the provision of health care services through telemedicine in their largest health plan [Figure I]. Telemedicine is the delivery of health care services through telecommunications to a patient from a provider who is at a remote location, including video chat and remote monitoring. Firms with 1,000 or more workers are more likely to cover services provided through telemedicine than smaller firms.
Retail Health Clinics. Seventy-six percent of large firms offering health benefits cover health care services received in retail clinics, such as those located in pharmacies, supermarkets and retail stores, in their largest health plan [Figure I]. These clinics are often staffed by nurse practitioners or physician assistants and treat minor illnesses and provide preventive services.
On-Site Health Clinics Only 10% of large firms offering health benefits have an on-site health clinic for their employees at one or more of their major locations. A large share of these firms report that employees can receive treatment for non-work-related illnesses at their on-site clinics.
PROVIDER NETWORKS
High Performance or Tiered Networks. Seventeen percent of large firms that offer health benefits include a high-performance or tiered provider network in their health plan with the largest enrollment, a similar percentage to last year [Figure I]. These arrangements identify providers that are more efficient and generally provide financial or other incentives for enrollees to use the selected providers. Firms with 1,000 or more workers are more likely than smaller firms to incorporate a high-performance or tiered network into their largest plan.
Narrow Networks. Five percent of large firms offering health benefits offer a plan they consider to be a narrow network plan, similar to the percentages for the past two years [Figure I]. Narrow network plans limit the number of providers who can participate in order to reduce costs, and are generally more restrictive than standard HMO networks. Firms with 5,000 or more workers offering health benefits are more likely than firms of other sizes to offer at least one plan with a narrow network.
Eliminated Hospitals or Health Systems. Only 3% of large firms report that they or their health plan eliminated a hospital or health system in the past year in order to reduce the costs of their plan, similar to the percentage reported last year [Figure I]. Firms with 5,000 or more workers offering health benefits are more likely to say that either they or their insurer eliminated a hospital or health system from a provider network to reduce costs than firms of other sizes.
REPEAL OF TAX PENALTY FOR INDIVIDUALS WITHOUT HEALTH INSURANCE
The 2017 tax law eliminated the tax penalty for people who do not have health insurance (sometimes called the ‘individual mandate’) beginning in 2019. Nine percent of small firms and 24% of large firms report that they expect fewer employees and dependents to participate in their health plans as result of the change. Additionally, 5% of small firms and 10% of large firms said that they expect to change the benefit options for at least some employees as a result of the change.
CONCLUSION
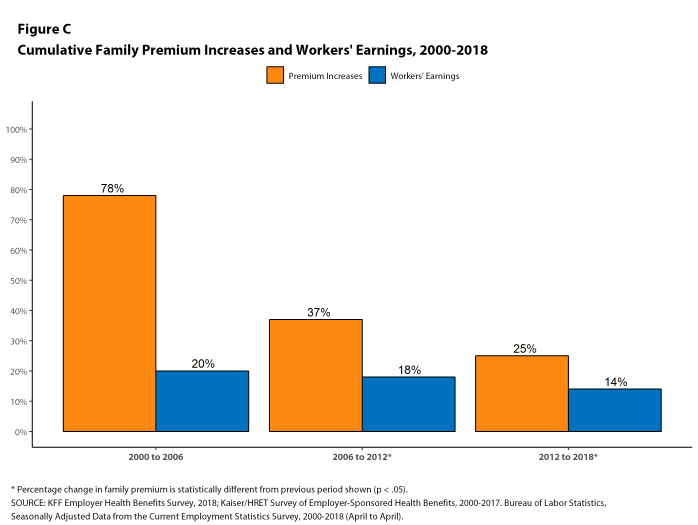
This year continues a period of stability and relatively low cost growth for employer-provided coverage. While premium growth continues to exceed increases in earnings and inflation, the differences are small compared to recent periods which, along with low underlying health spending growth, may help explain the apparent reluctance of employers and plans to make many changes in the market [Figure C].
The one area where we have seen change is higher deductibles – the average deductible for single coverage among all workers increased 53% since 2013, driven in part by a 50% increase in HDHP/SO enrollment over that period. Higher deductibles have helped to keep premium increases relatively low, but it is unclear how long that trend will continue. Given the importance of health benefits to workers and prospective workers, employers may find it increasingly difficult to impose higher cost sharing in what is essentially a full employment economy. The growth in HDHP/SO enrollment has stalled over the past three years, which may be a sign of employer reluctance to rock the benefit boat for their workers. If underlying health care prices and service use begin to grow as part of stronger economic growth, employer and health plans may need to look for tools other than higher cost sharing to address the pressures that would lead to higher premium growth.
METHODOLOGY
The Kaiser Family Foundation 2018 Employer Health Benefits Survey reports findings from a telephone survey of 2,160 randomly selected non-federal public and private employers with three or more workers. Researchers at NORC at the University of Chicago and the Kaiser Family Foundation designed and analyzed the survey. National Research, LLC conducted the fieldwork between January and July 2018. In 2018, the overall response rate is 32%, which includes firms that offer and do not offer health benefits. Among firms that offer health benefits, the survey’s response rate is also 32%. To improve estimates for small firms, the 2018 survey had a significantly larger sample than in previous years; the increased sample size led to both more firms completing the survey and a lower response rate than in years past. Unless otherwise noted, differences referred to in the text and figures use the 0.05 confidence level as the threshold for significance. Values below 3% are not shown on graphical figures to improve the readability of those graphs.
For more information on the survey methodology, please visit the Survey Design and Methods section at http://ehbs.kff.org/.
Filling the need for trusted information on national health issues, the Kaiser Family Foundation is a nonprofit organization based in San Francisco, California.
- Kaiser Commission on Medicaid and the Uninsured. The uninsured: A primer – Key facts about health insurance and the uninsured in the era of health reform: Supplemental Tables. Washington (DC): The Commission; 2017 Dec (cited 2018 Jul 23). https://files.kff.org/attachment/Supplemental-Tables-The-Uninsured-A-Primer-Key-Facts-about-Health-Insurance-and-the-Uninsured-Under-the-Affordable-Care-Act. See Table 1: 271.1 million nonelderly people, 56.2% of whom are covered by employer-sponsored insurance.↩
- Inflation values are not seasonally adjusted. Bureau of Labor Statistics. Consumer Price Index – All Urban Consumers (April to April): Department of Labor; 2018 (cited 2018 Jul 20). https://beta.bls.gov/dataViewer/view/timeseries/CUUR0000SA0. Wage data are from the Bureau of Labor Statistics and based on the change in total average hourly earnings of production and nonsupervisory employees. Employment, hours, and earnings from the Current Employment Statistics survey: Department of Labor; 2018 (cited 2018 July 20). https://beta.bls.gov/dataViewer/view/timeseries/CES0500000008↩
- This threshold is based on the twenty-fifth percentile of workers’ earnings, using data for 2017 (April to April). Bureau of Labor Statistics. May 2017 National Occupational Employment and Wage Estimates: United States. Washington (DC): BLS; (last modified 2018 Apr 27; cited 2018 Jul 23). Available from: http://www.bls.gov/oes/current/oes_nat.htm↩

