2018 Employer Health Benefits Survey
Section 14: Employer Practices and Health Plan Networks
Employers play a major role in financing and arranging for health insurance coverage, so their opinions and experiences are important factors in health policy discussions. In recent years, employers have included new providers and sites of care, such as retail clinics, and some have pursued changes to their networks to reduce costs or improve quality.
SHOPPING FOR HEALTH COVERAGE
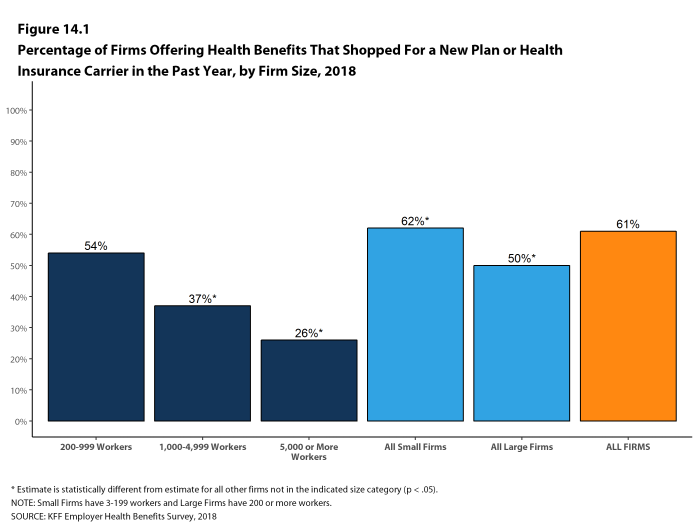
Sixty-one percent of firms offering health benefits reported shopping for a new health plan or a new insurance carrier in the past year, similar to the percentage last year. Small firms were more likely to shop for coverage (62%) while firms with 1,000-4,999 workers and firms with 5,000 or more workers were less likely to shop for coverage (37% and 26%, respectively) than firms in other size categories [Figure 14.1].
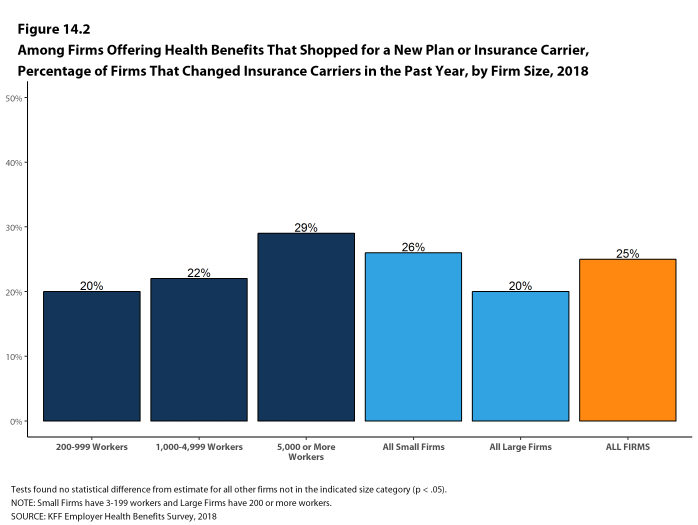
- Among firms that offer health benefits and who shopped for a new plan or carrier in the past year, 25% changed insurance carriers [Figure 14.2].
Figure 14.1: Percentage of Firms Offering Health Benefits That Shopped for a New Plan or Health Insurance Carrier In the Past Year, by Firm Size, 2018
PROVIDER NETWORKS
Firms and health plans can structure their networks of providers and their cost sharing to encourage enrollees to use providers who are lower cost or who provide better care.
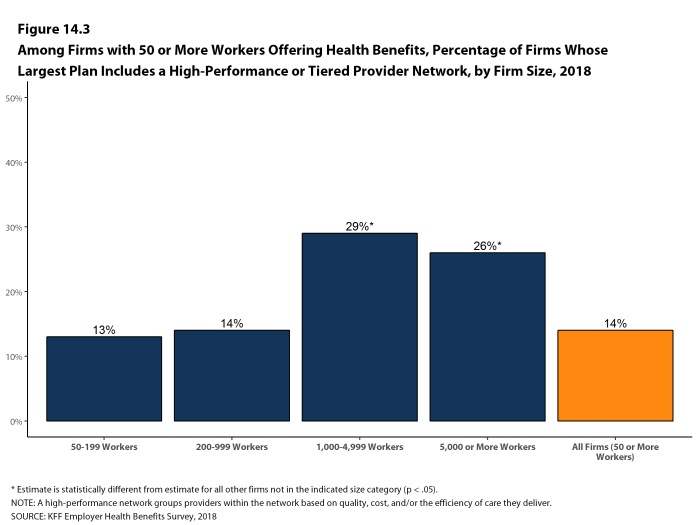
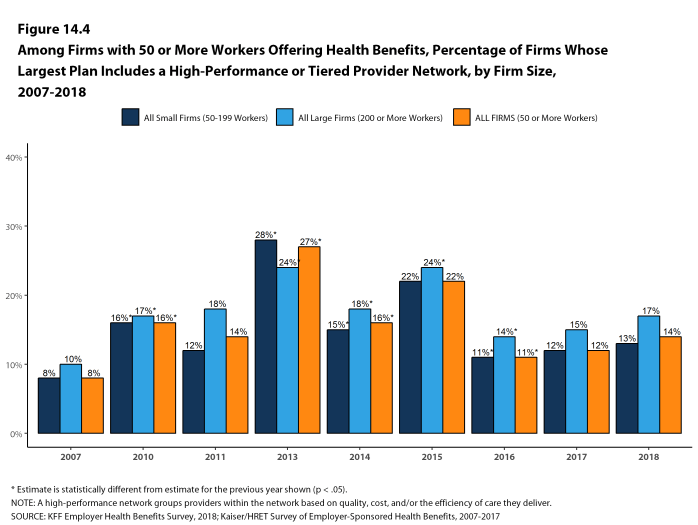
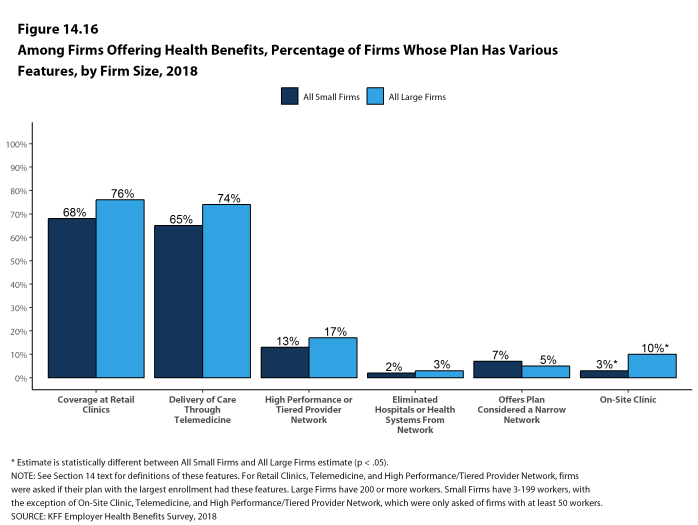
- A tiered or high-performance network groups providers in the network based on the cost, quality and/or efficiency of the care they deliver. These networks encourage enrollees to visit preferred doctors by either restricting networks to efficient providers, or by having different cost-sharing requirements based on the provider’s tier. Fourteen percent of firms with 50 or more workers that offer health benefits include a high-performance or tiered provider network in their health plan with the largest enrollment, similar to last year [Figures 14.3 and 14.4].
- Firms with 1,000 or more workers are more likely than smaller firms to incorporate a high-performance or tiered network into their largest plan.
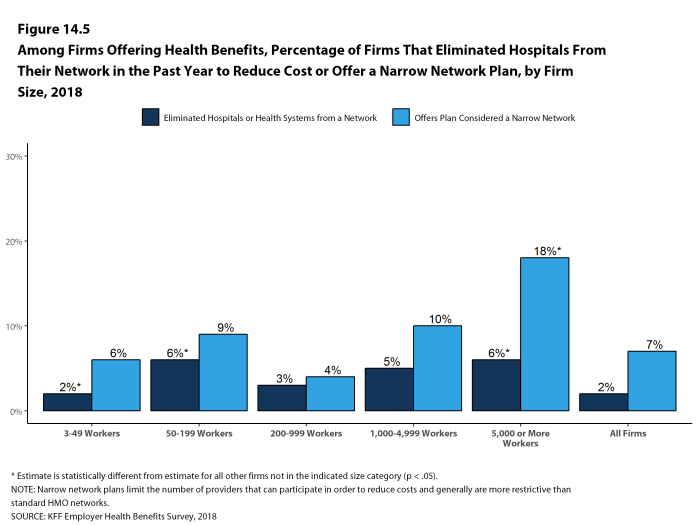
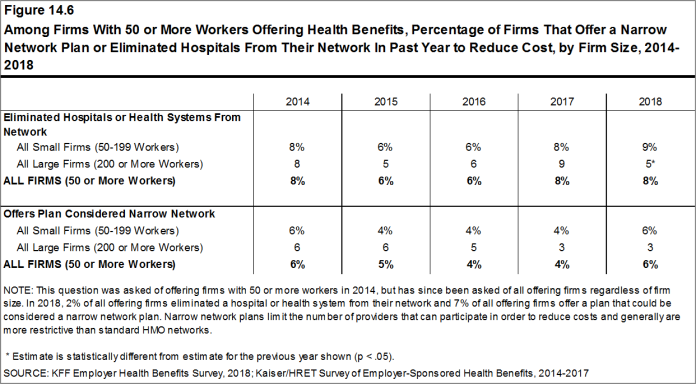
- Narrow network plans limit the number of providers that can participate in order to reduce costs and generally are more restrictive than standard HMO networks. Seven percent of firms offering health benefits report that they offer a plan that they considered to be a narrow network plan, similar to the percentages reported the past two years [Figures 14.6].
- Firms with 5,000 or more workers offering health benefits are more likely than firms of other sizes to offer at least one plan with a narrow network [Figure 14.5].
- Only 2% of firms offering health benefits say that either they or their insurer eliminated a hospital or health system from a provider network during the past year in order to reduce the plan’s cost [Figure 14.5].
- Firms with 50-199 workers and firms with 5,000 or more workers offering health benefits are more likely than firms of other sizes to say that either they or their insurer eliminated a hospital or health system from a provider network to reduce costs [Figure 14.5].
Figure 14.3: Among Firms With 50 or More Workers Offering Health Benefits, Percentage of Firms Whose Largest Plan Includes a High-Performance or Tiered Provider Network, by Firm Size, 2018
Figure 14.4: Among Firms With 50 or More Workers Offering Health Benefits, Percentage of Firms Whose Largest Plan Includes a High-Performance or Tiered Provider Network, by Firm Size, 2007-2018
Figure 14.5: Among Firms Offering Health Benefits, Percentage of Firms That Eliminated Hospitals From Their Network In the Past Year to Reduce Cost or Offer a Narrow Network Plan, by Firm Size, 2018
ALTERNATIVE CARE SETTINGS: TELEMEDICINE, ONSITE CLINICS, AND RETAIL CLINICS
Many firms provide coverage for health services delivered outside typical provider settings.
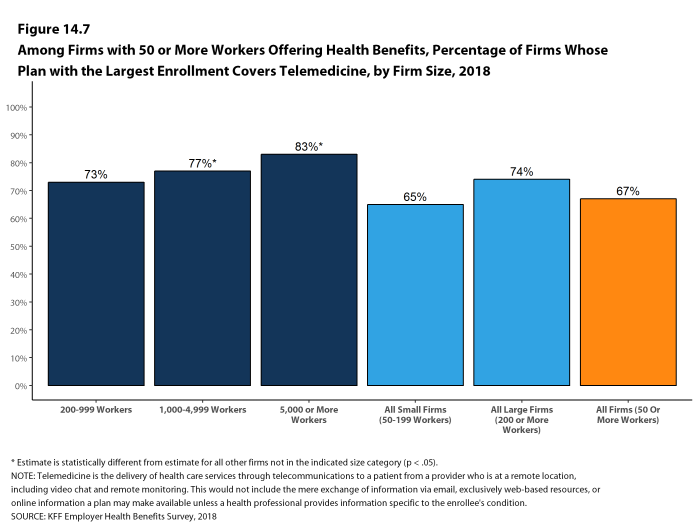
- Telemedicine is the delivery of health care services through telecommunications to a patient from a provider who is at a remote location, including video chat and remote monitoring. This would not include the mere exchange of information via email, exclusively web-based resources, or online information a plan may make available unless a health professional provides information specific to the enrollee’s condition. Sixty-seven percent of firms with 50 or more workers who offer health benefits cover the provision of some health care services through telemedicine in their largest health plan [Figure 14.7]. Firms with 1,000 or more workers are more likely than smaller firms to cover services provided through telemedicine.
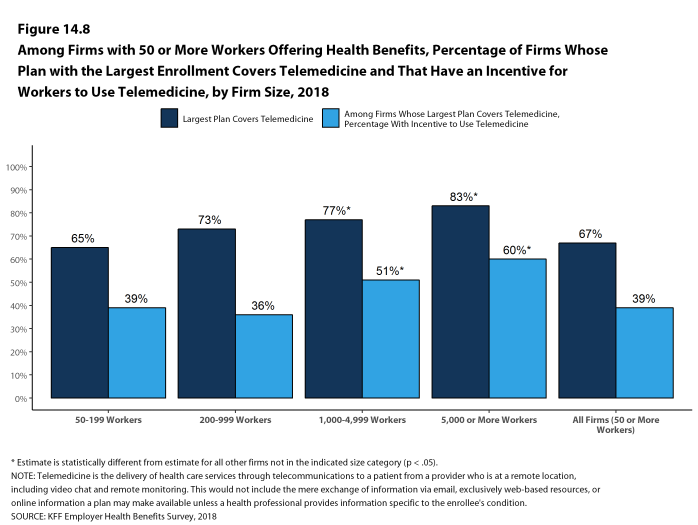
- Among firms with 50 or more workers with plans that cover health services through telemedicine, 39% provide a financial incentive for workers to use telemedicine instead of visiting a traditional physician’s office in-person, higher than the percentage in 2017 [Figure 14.8].
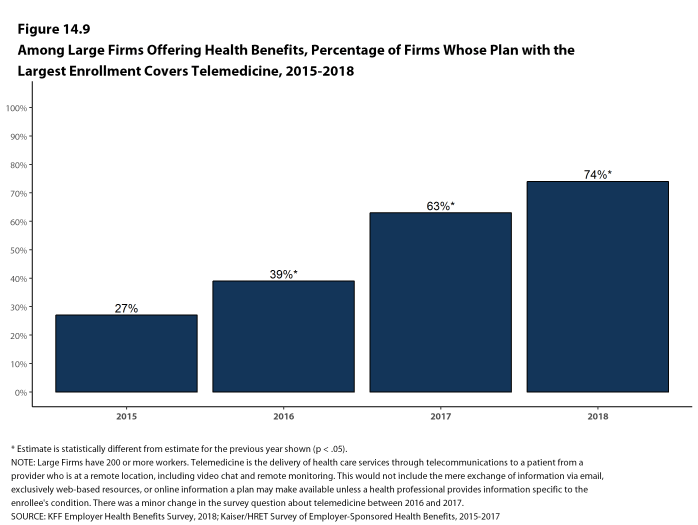
- The percentage of large firms reporting that they cover services through telemedicine increased from 63% last year to 74% this year [Figure 14.9].
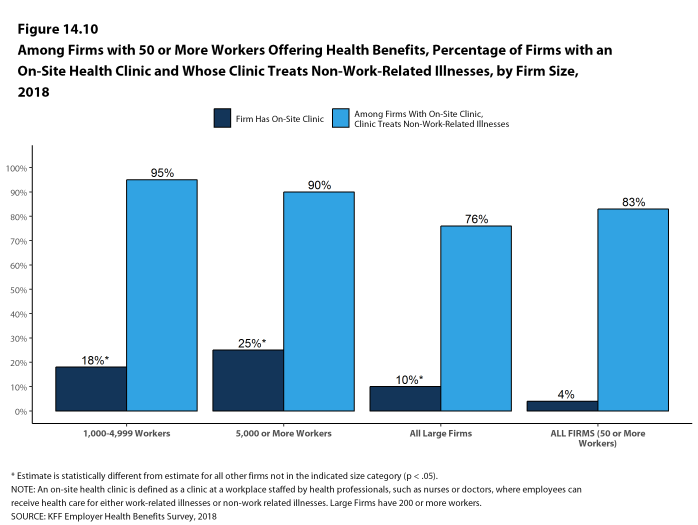
- Among large firms offering health benefits, 10% have an on-site health clinic for their employees at one or more of their major locations. A large share of these firms report that employees can receive treatment for non-work-related illnesses at their on-site clinics [Figure 14.10].
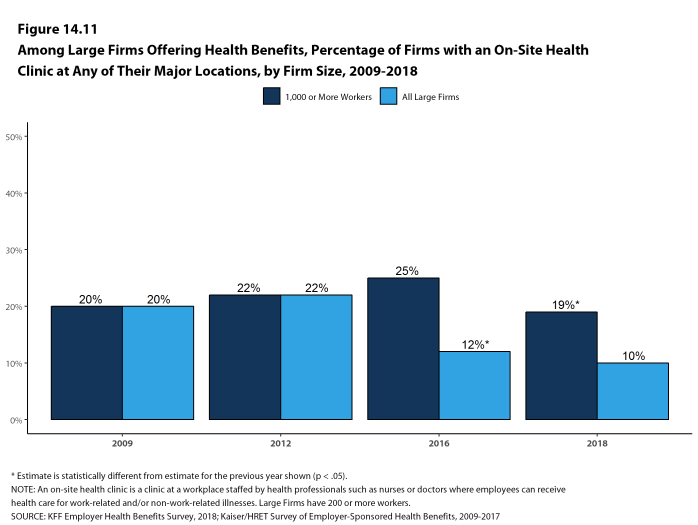
- Firms with 1,000 or more workers are more likely than other large firms to have an on-site health clinic at one or more of their major locations [Figure 14.11].
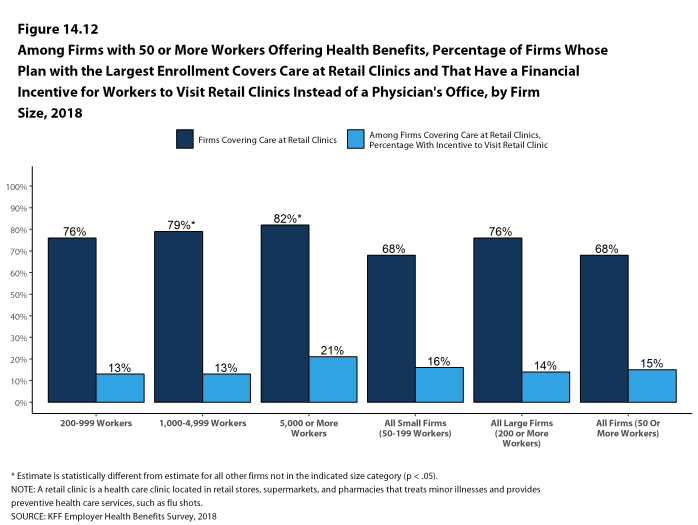
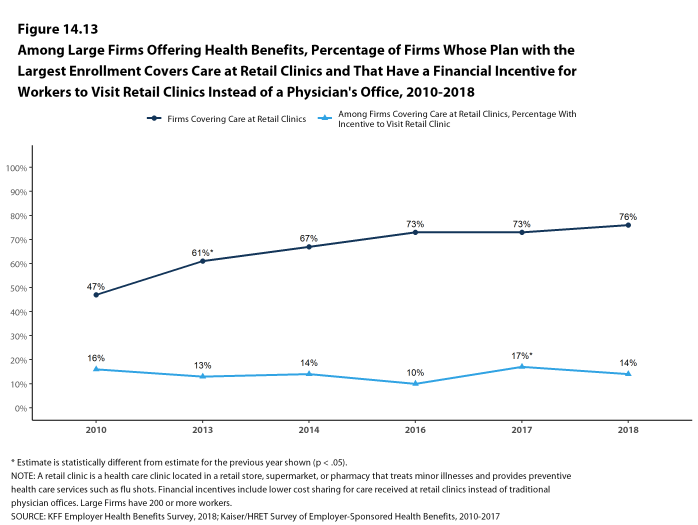
- Sixty-eight percent of firms that offer health benefits cover health care services received in retail clinics, such as those located in pharmacies, supermarkets and retail stores, in their largest health plan [Figure 14.12]. These clinics are often staffed by nurse practitioners or physician assistants and treat minor illnesses and provide preventive services.
- Among firms with plans that cover health services received in retail clinics, 15% provide a financial incentive for workers to use a retail health clinic instead of visiting a traditional physician’s office [Figure 14.12].
Figure 14.7: Among Firms With 50 or More Workers Offering Health Benefits, Percentage of Firms Whose Plan With the Largest Enrollment Covers Telemedicine, by Firm Size, 2018
Figure 14.8: Among Firms With 50 or More Workers Offering Health Benefits, Percentage of Firms Whose Plan With the Largest Enrollment Covers Telemedicine and That Have an Incentive for Workers to Use Telemedicine, by Firm Size, 2018
Figure 14.9: Among Large Firms Offering Health Benefits, Percentage of Firms Whose Plan With the Largest Enrollment Covers Telemedicine, 2015-2018
Figure 14.10: Among Firms With 50 or More Workers Offering Health Benefits, Percentage of Firms With an On-Site Health Clinic and Whose Clinic Treats Non-Work-Related Illnesses, by Firm Size, 2018
Figure 14.11: Among Large Firms Offering Health Benefits, Percentage of Firms With an On-Site Health Clinic at Any of Their Major Locations, by Firm Size, 2009-2018
Figure 14.12: Among Firms With 50 or More Workers Offering Health Benefits, Percentage of Firms Whose Plan With the Largest Enrollment Covers Care at Retail Clinics and That Have a Financial Incentive for Workers to Visit Retail Clinics Instead of a Physician’s Office, by Firm Size, 2018
EMPLOYERS OFFERING LIMITED BENEFIT PLANS
Some employers offer their employees more limited benefit plans, sometimes called skinny health plans or minimum essential coverage plans. These arrangements, which have fewer benefits and lower costs than traditional employer-provided plans, satisfy the ACA’s requirement that employers offer a health plan to employees, but not typically minimum value standards. If an employee enrolls in one of these plans, however, the employee meets his or her individual requirement to have health coverage, and because they are enrolled in an employer-provided plan, they are ineligible to receive a premium tax credit if they enroll in an individual plan through the federal or a state marketplace.
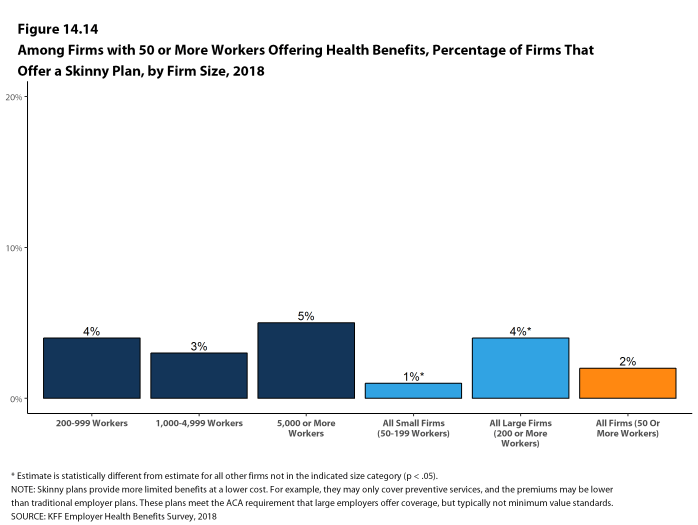
- In 2018, 4% of large firms offering health benefits report that they offer a skinny health plan to at least some of their workers [Figure 14.14].
REPEAL OF TAX PENALTY FOR INDIVIDUALS WITHOUT HEALTH INSURANCE
The 2017 tax law eliminated the tax penalty for people who do not have health insurance (sometimes called the ‘individual mandate’) beginning in 2019. We asked employers offering health benefits how the change might affect their health benefit offerings.
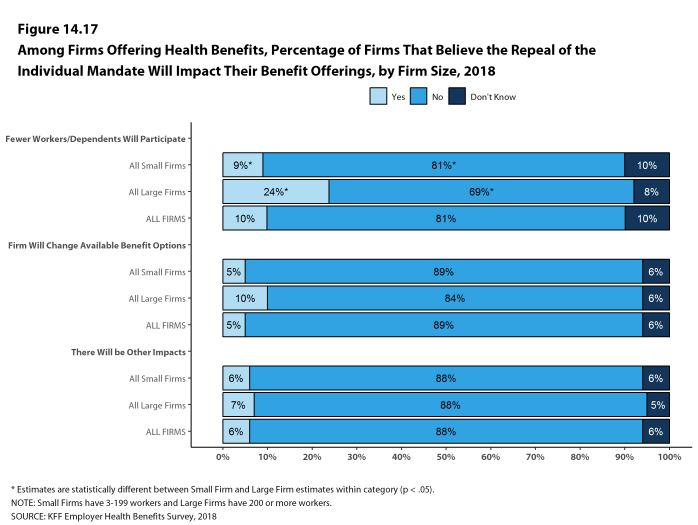
- Nine percent of small firms and 24% of large firms expect fewer employees and dependents to participate in their health plans as as result of the change [Figure 14.17].
- Five percent of small firms and 10% of large firms expect to change their benefit options for at least some employees as a result of the change [Figure 14.17].
EXCISE TAX ON HIGH COST HEALTH PLANS
The high-cost plan tax, sometimes called the “Cadillac Tax”, is an excise tax on health benefit plans with premiums and other costs that exceed specified thresholds. The tax was scheduled to take effect in 2018, but its effective date has been delayed several times, most recently in the 2017 tax bill, and is now scheduled to take effect in 2022. The tax is 40% of the amount by which plan costs exceed the specified thresholds, and is calculated with respect to each employee based on the combinations of health benefits received by that employee, including the employer and employee share of health plan premiums (or premium equivalents for self-funded plans), Flexible Spending Account (FSA) contributions, and employer contributions to health savings accounts and health reimbursement arrangement contributions.
- Employers appear to be aware of the pending implementation of the high cost plan tax, although they have some uncertainty as to whether it will take effect as scheduled.
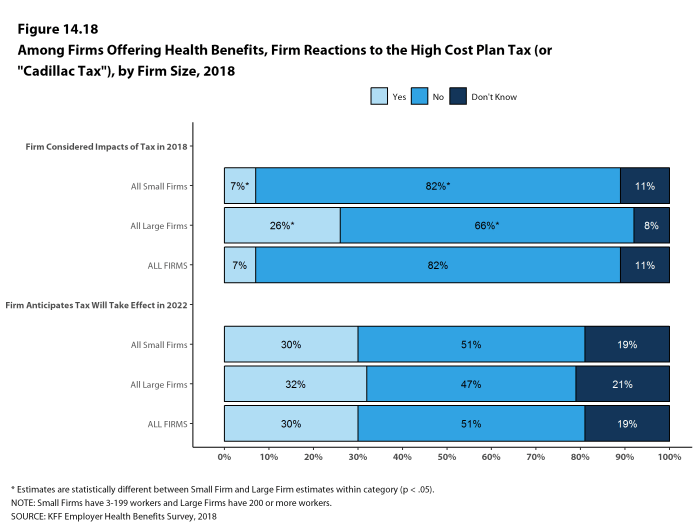
- Among firms offering health benefits, 7% of small firms and 26% of large firms say they considered the potential impact of the upcoming tax when they made their benefit decisions for 2018 [Figure 14.18].
- Less than one-third (30%) of firms offering health benefits anticipate that the high cost plan tax will take effect as scheduled in 2022 [Figure 14.18]. Fifty-one percent of offering firms anticipate the tax will not take effect in 2022, while 19% say they do not know. Responses are similar across small and large firms.
FLEXIBLE SPENDING ACCOUNTS
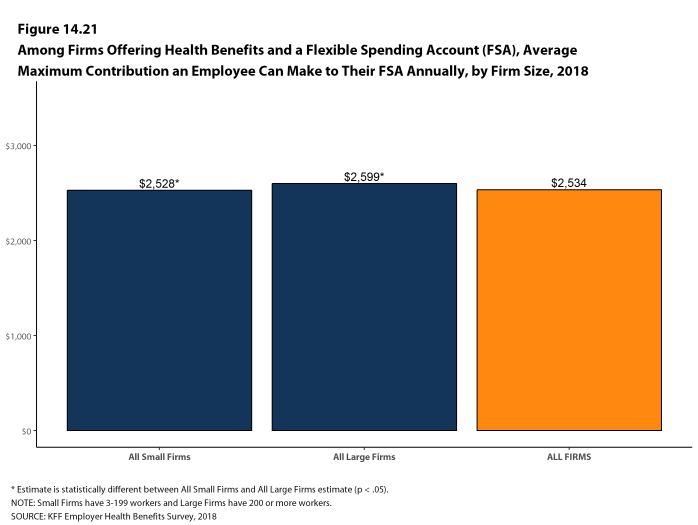
Flexible spending accounts (FSAs) allow employees to set aside funds on a pre-tax basis to pay for medical expenses not covered by health insurance. The legal maximum contribution for employee FSA contributions for 2018 is $2,650, although employers may establish a lower limit.
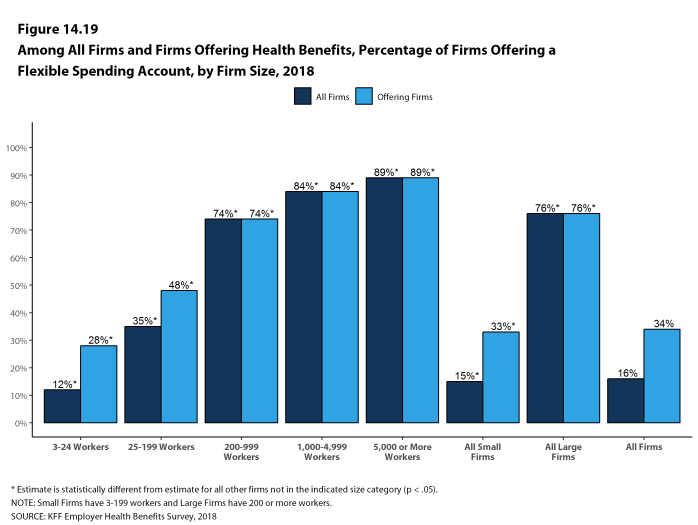
- Among firms offering health benefits, 33% of small firms and 76% of large firms offer their employees a health FSA [Figure 14.19]. Very few firms that do not offer health benefits offer an FSA for their employees. The average maximum employee contributions are $2,528 in small firms and $2,599 in large firms [Figure 14.21].
Figure 14.19: Among All Firms and Firms Offering Health Benefits, Percentage of Firms Offering a Flexible Spending Account, by Firm Size, 2018
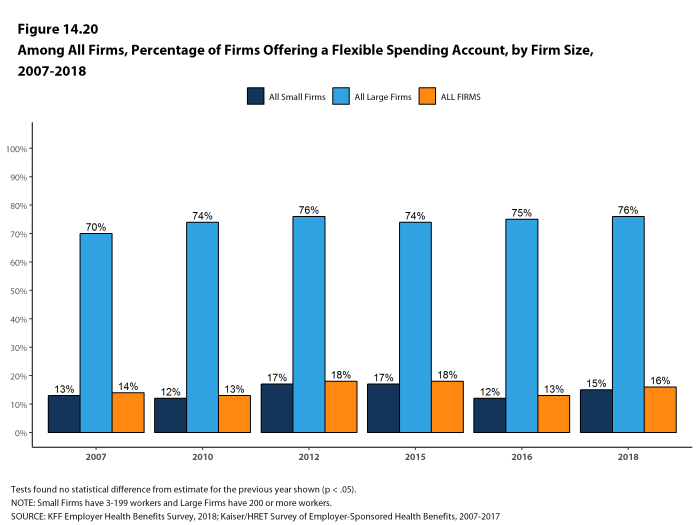
Figure 14.20: Among All Firms, Percentage of Firms Offering a Flexible Spending Account, by Firm Size, 2007-2018
PRIVATE EXCHANGES AND DEFINED CONTRIBUTIONS
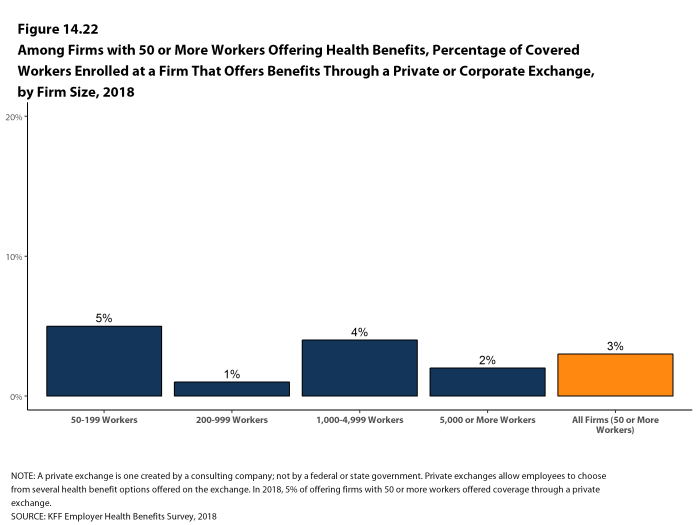
A private exchange is a virtual market that allows employers to provide their workers with a choice of several different health benefit options, often including supplemental or ancillary benefits options. Private exchanges generally are created by consulting firms, insurers, or brokers, and are different than the public exchanges run by the states or the federal government. There is considerable variation in the types of exchanges currently offered: some exchanges allow workers to choose between multiple plans offered by the same carrier while in other cases multiple carriers participate. Private exchanges have been operating for several years, but enrollment remains modest.
- Five percent of firms offering health benefits with 50 or more workers offer coverage through a private exchange. These firms provide coverage to 3% of covered workers in firms with 50 or more workers [Figure 14.22]. These percentages are similar to those in 2017.

