Current and Historical Public Opinion on Medicare-for-All and Other National Health Plan Proposals
For many years, KFF has been tracking public opinion on the idea of a national health plan, including questions specifically about “Medicare-for-all” since 2017. This 2026 midterm election cycle, some progressive Democratic candidates have been campaigning on their support for Medicare-for-all, in which all Americans would get their insurance from a single government plan. As U.S. adults struggle to afford their health costs, many are looking for changes to the health care system. This data note summarizes current and historical KFF polling on Medicare-for-all and other national health proposals.
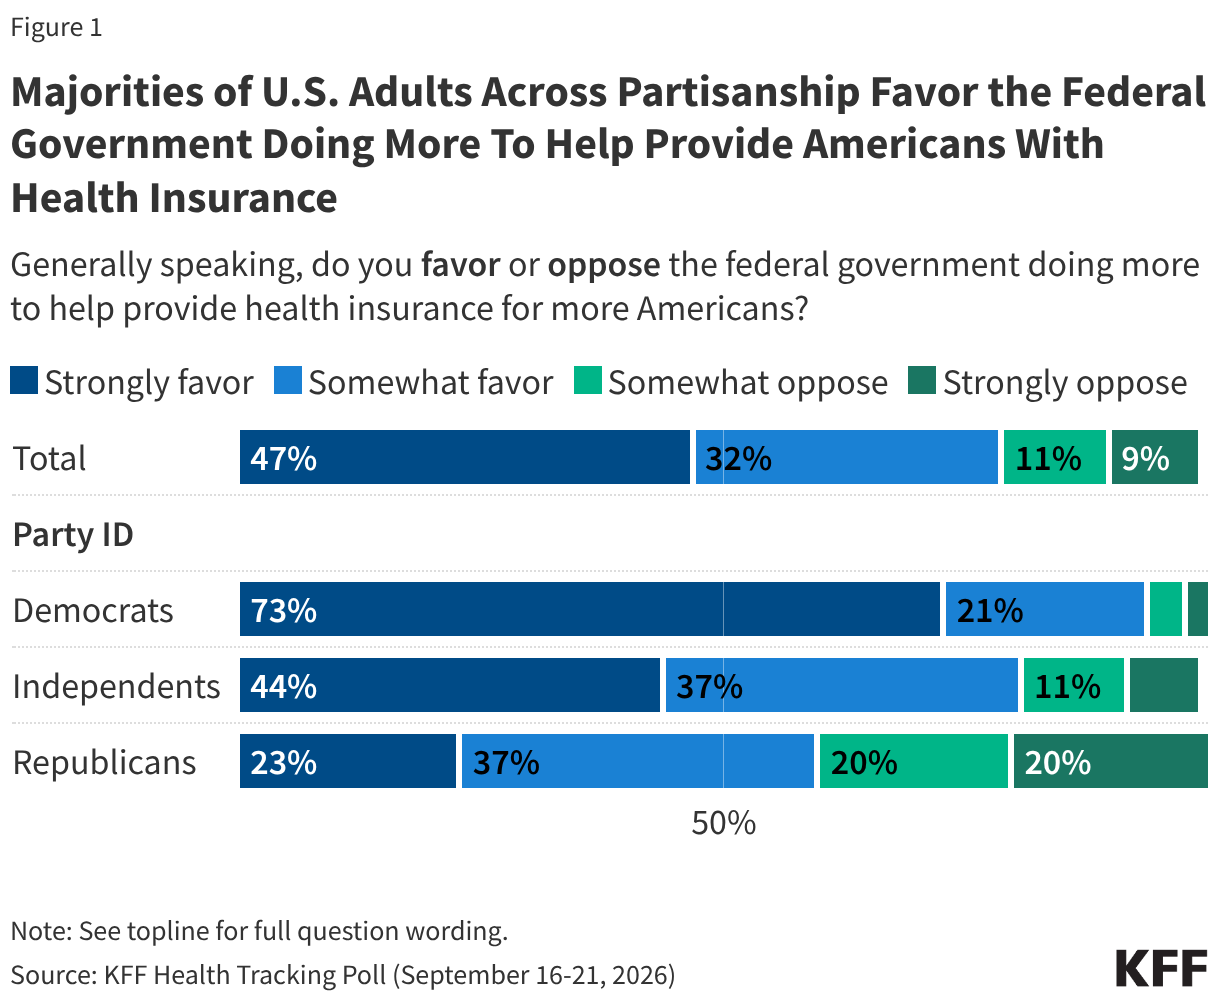
Views on Medicare-for-all are related to the broader question of the role of the federal government in providing access to health insurance, which has wide support among the public. Eight in ten (79%) adults say they favor the federal government doing more to help provide health insurance for more Americans, while one in five oppose a larger role for the federal government. Support for a larger federal role is bipartisan, including nearly all Democrats (94%) and eight in ten independents (82%). A smaller majority of Republicans (61%) favor a larger role for government.
This sentiment is not new. In fact, since KFF began polling on this question in 2006, three-quarters of U.S. adults or more have favored the federal government doing more to help provide health insurance to more Americans.
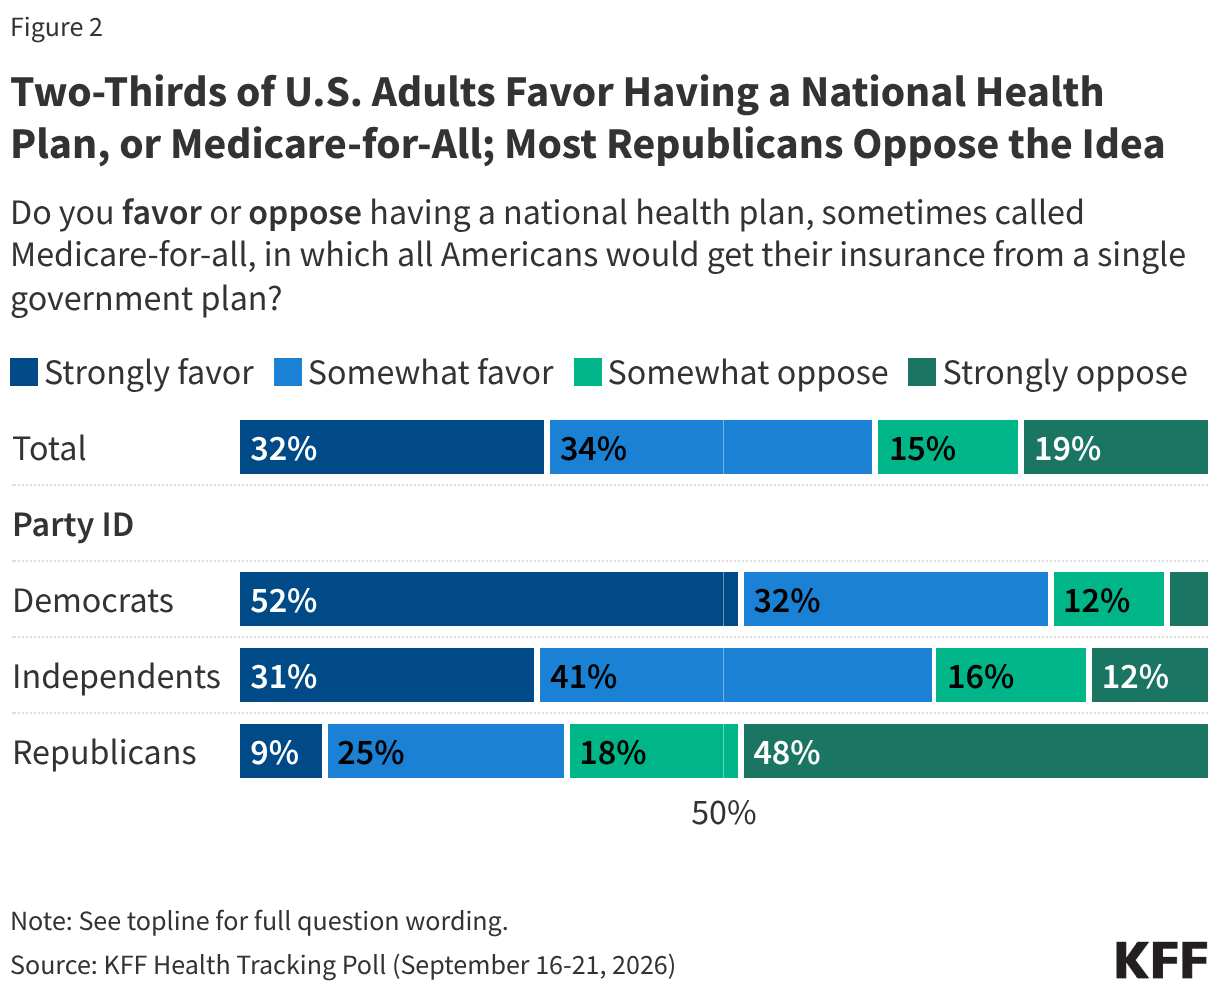
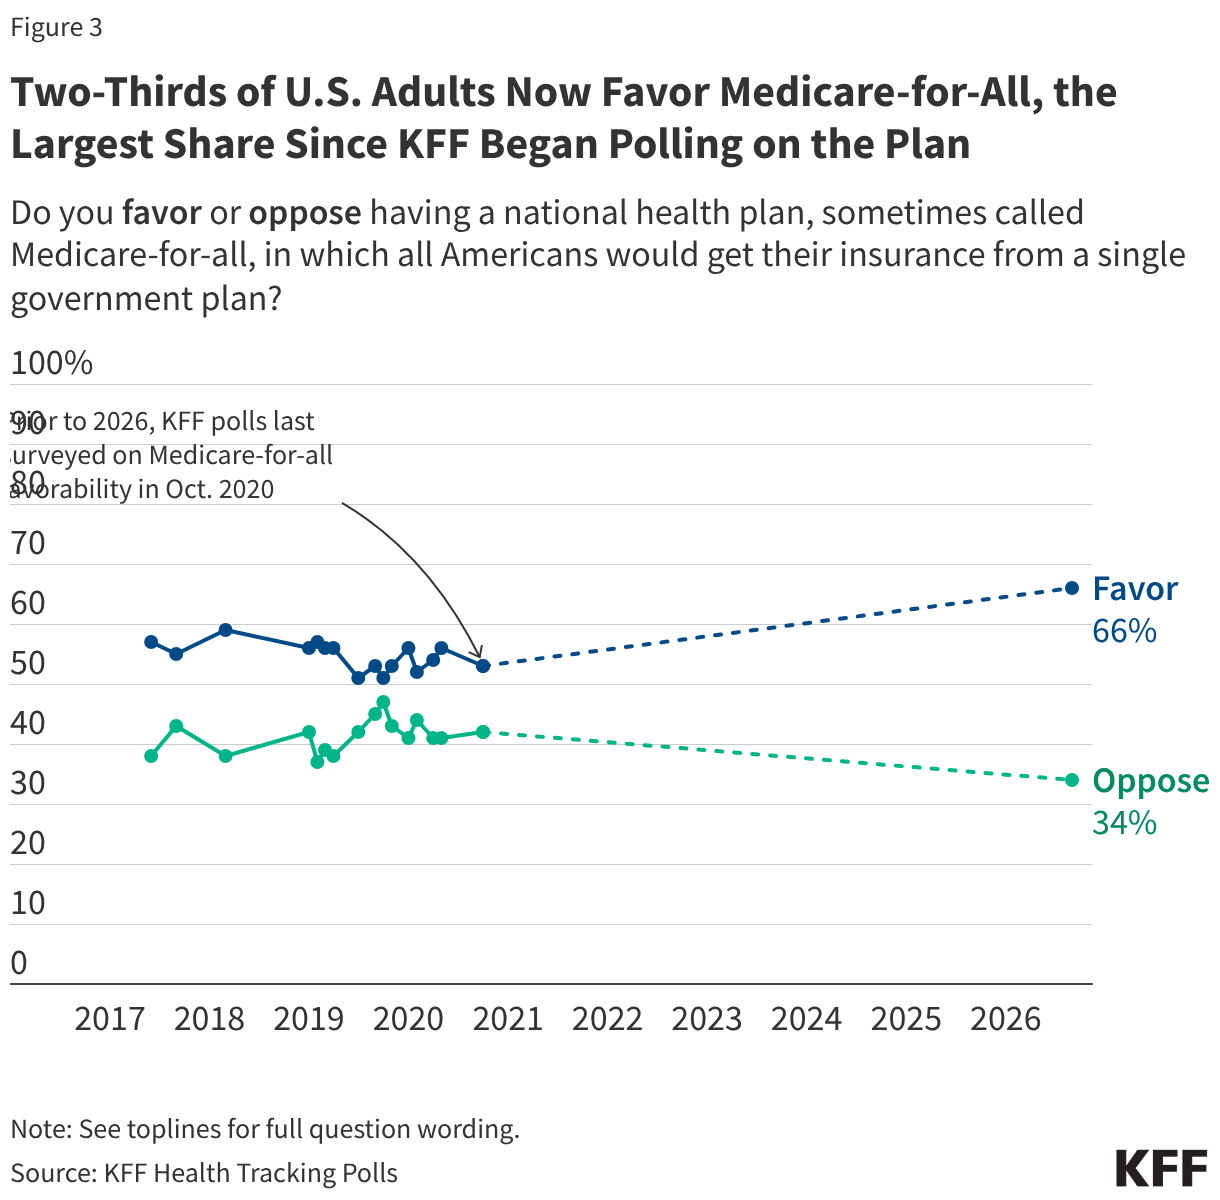
Medicare-for-all has reentered Democratic debates in the 2026 midterm elections, with several progressive candidates making it a central part of their campaigns. A September 2026 KFF Health Tracking Poll finds that two-thirds (66%) of the public say they favor having a national health plan, sometimes called Medicare-for-all, in which all Americans would get their insurance from a single government plan. This includes about eight in ten Democrats (84%) and seven in ten independents (72%). Most Republicans, however, oppose the proposal (66%), including about half (48%) who “strongly oppose” it.
From 2017 to 2020, views of Medicare-for-all were relatively stable, with at least half of adults consistently favoring the proposal and between four in ten and just under half opposing it. Opposition rose slightly in 2019, coinciding with debate over Medicare-for-all during the Democratic presidential primary, and when KFF asked the question in October 2020, about half (53%) were in favor and about four in ten (42%) opposed.
The latest KFF poll from September 2026 marks a new high, with two-thirds (66%) of the public favoring the proposal, while the share opposed has fallen to about a third (34%).
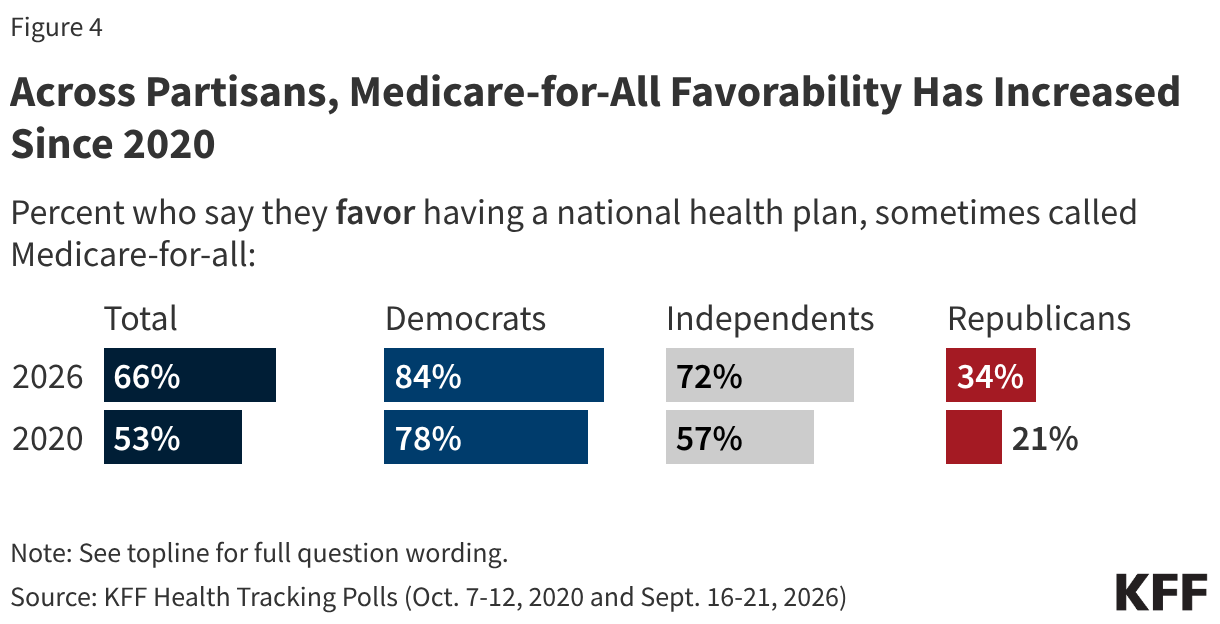
Support for Medicare-for-all increased across partisans between 2020 and 2026. Most notably, about seven in ten independents (72%) now favor the proposal, up from fewer than six in ten (57%) six years ago. While most Republicans oppose the plan, one-third (34%) now favor it, up from one in five (21%) in 2020. About eight in ten Democrats (84%) now favor Medicare-for-all, similar to the share who said so in 2020 (78%).
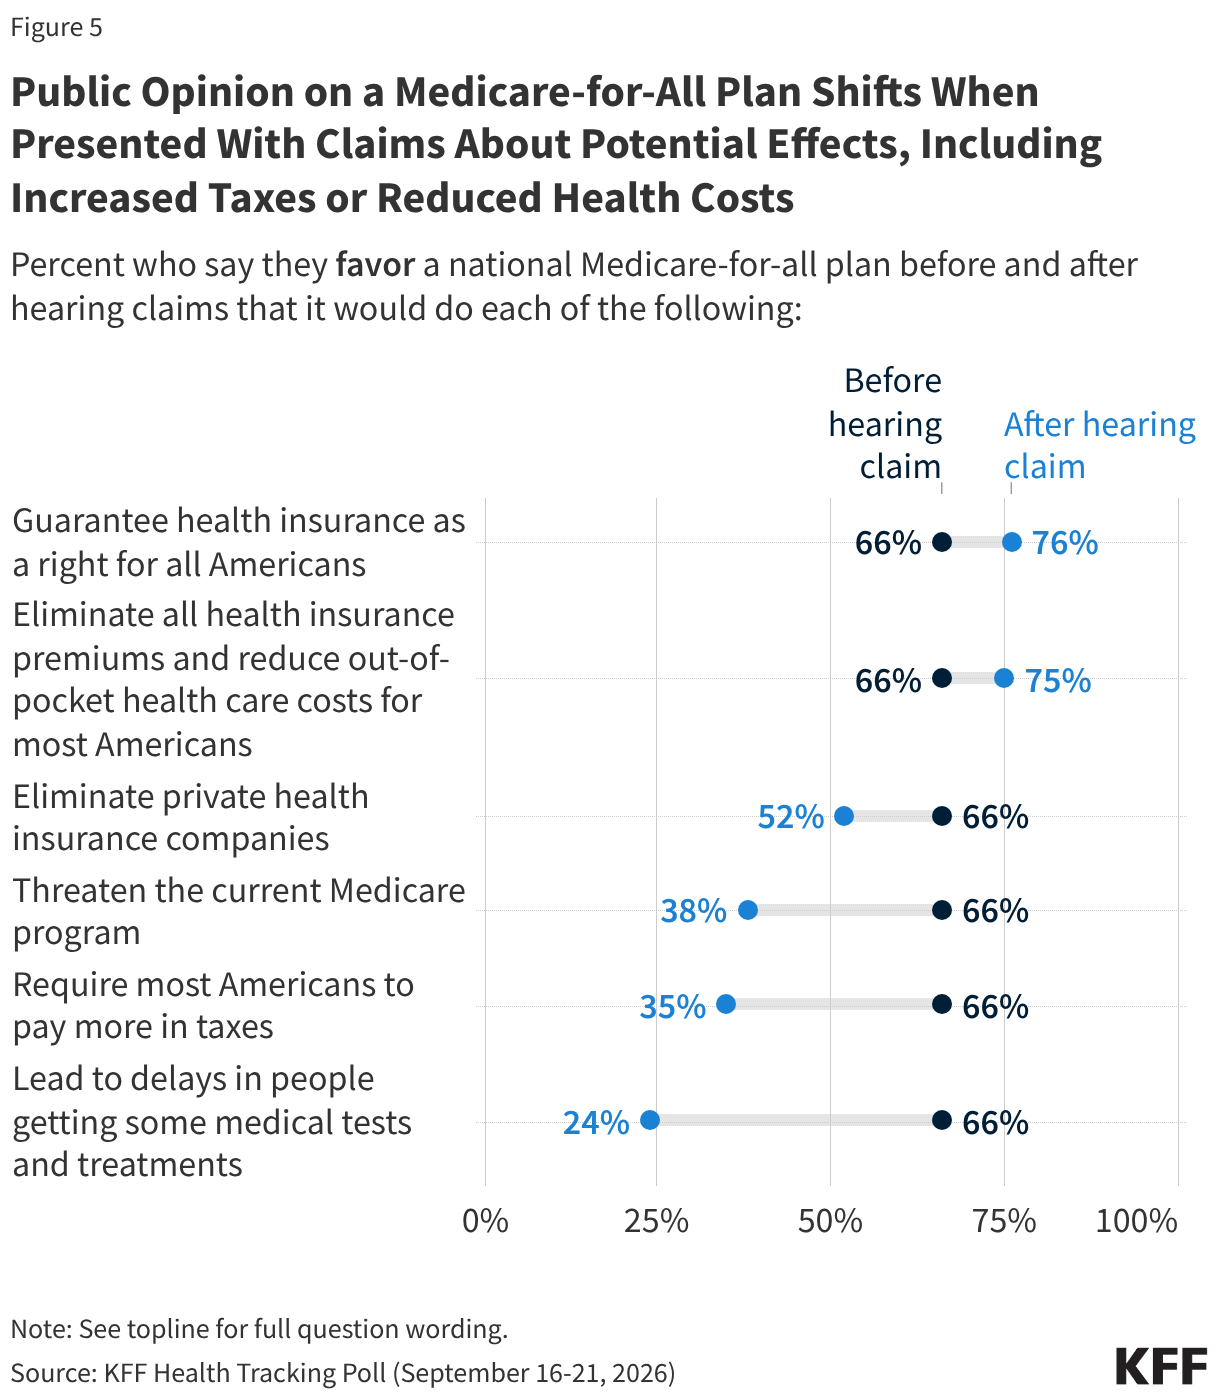
KFF polling has consistently found that public opinion on Medicare-for-all can shift substantially when people hear about potential effects of such a plan that are likely to be raised in a national debate. The share who favors such a plan rises to as much as three-quarters when people hear it would guarantee health insurance as a right for all Americans or eliminate all health insurance premiums and reduce out-of-pocket health care costs. On the other hand, favorability falls to as low as one in four when people hear it could lead to delays in getting medical tests or treatment, to about one-third when they hear it could raise taxes, and to about four in ten when they hear it could threaten the current Medicare program.
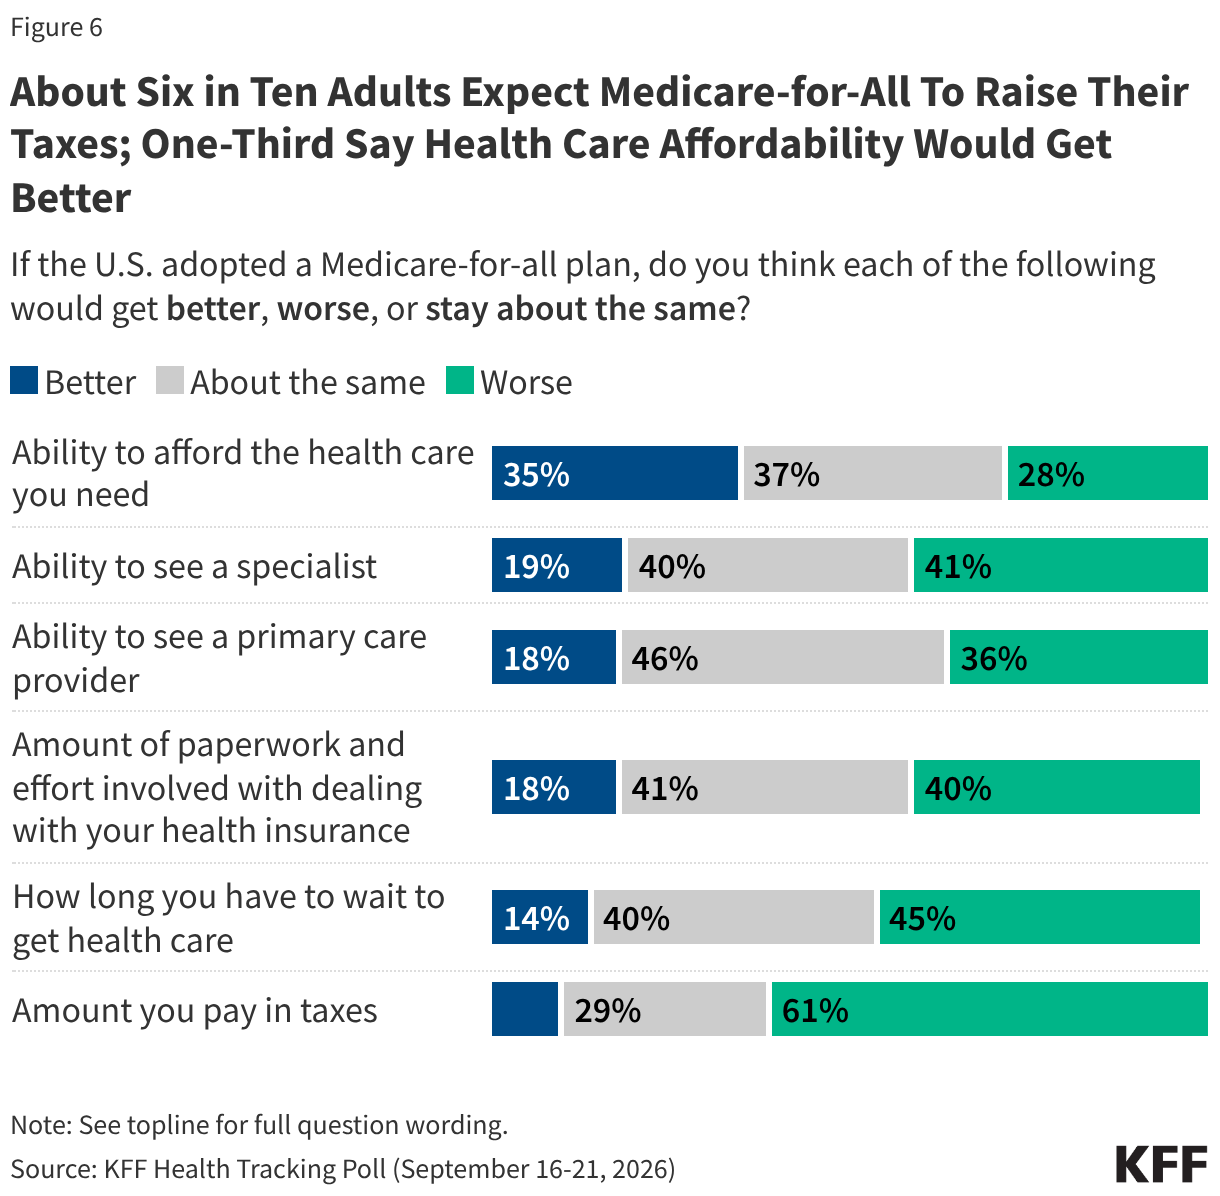
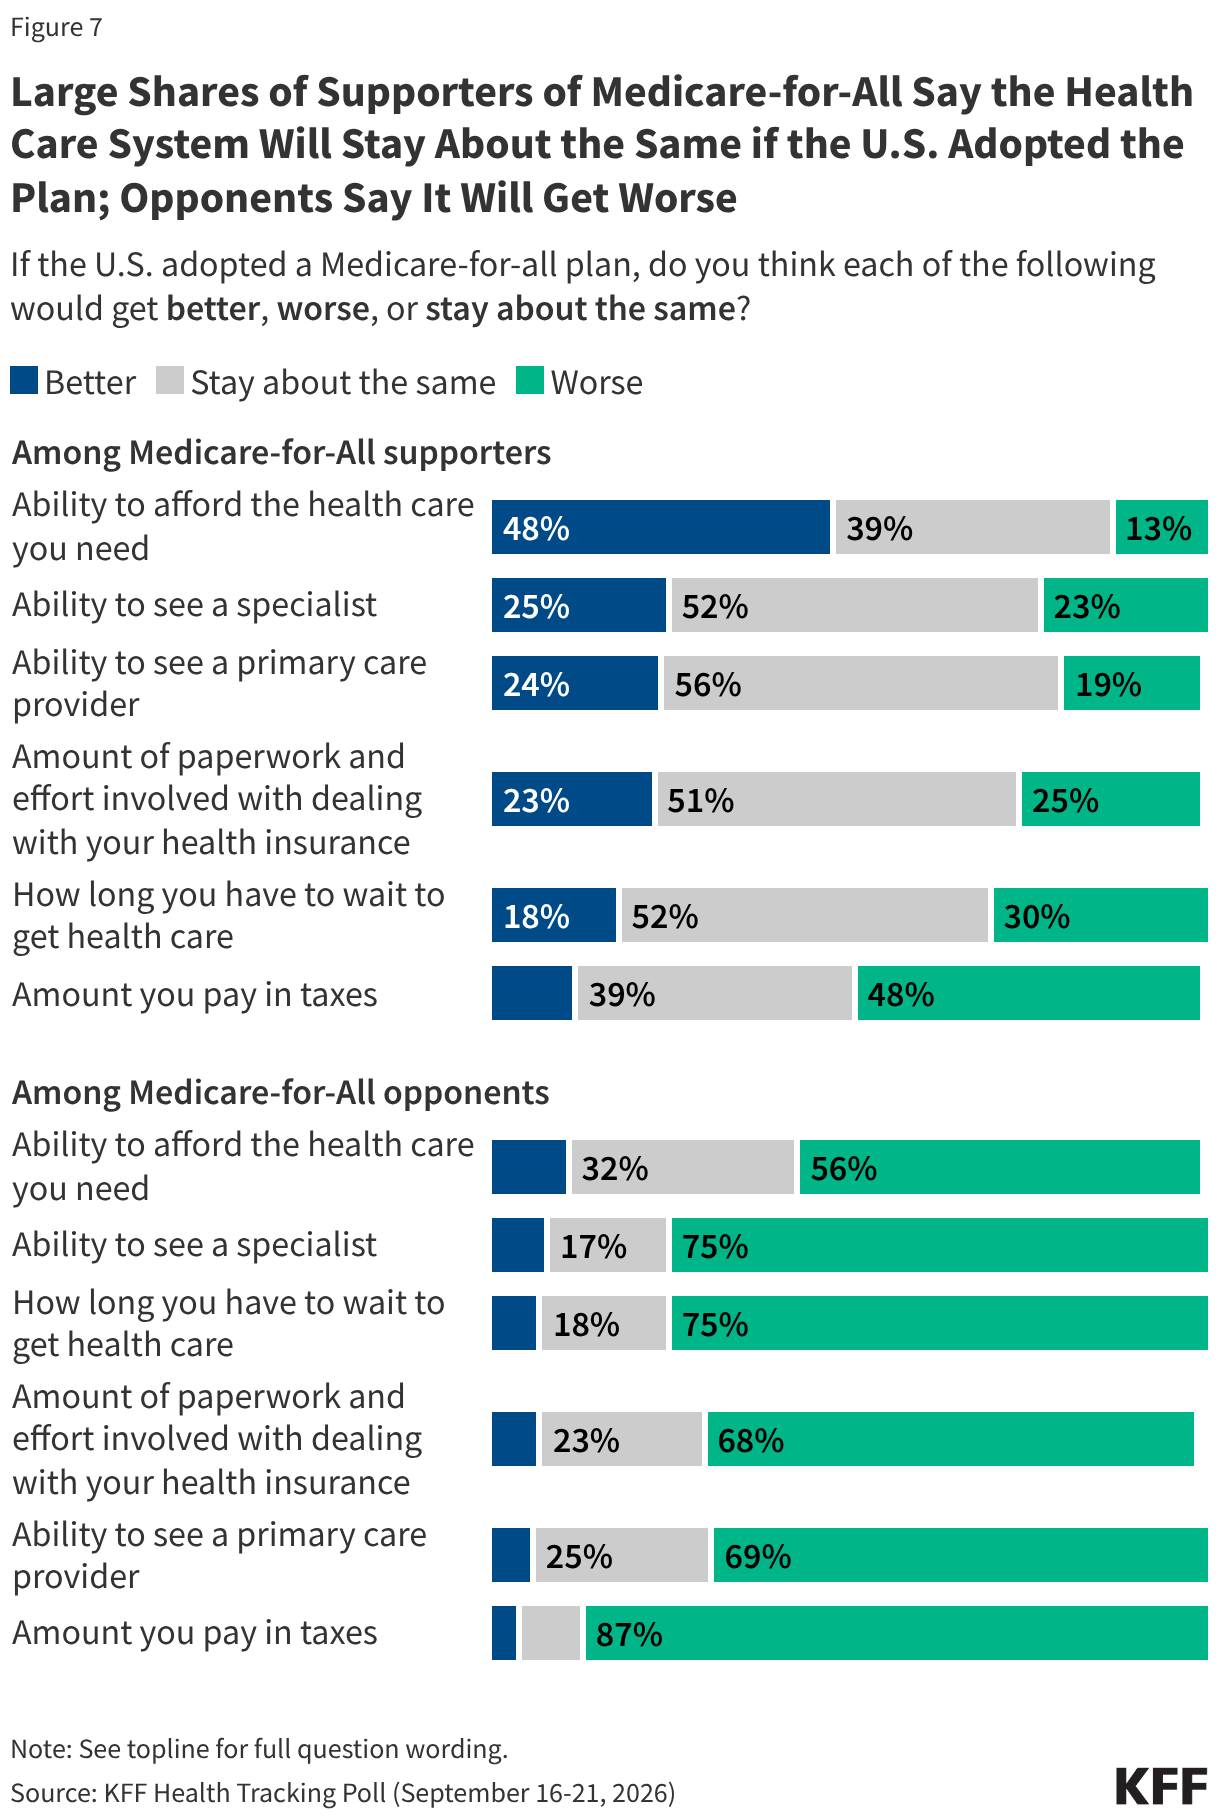
The public has mixed expectations about how a Medicare-for-all plan would affect them personally, but these expectations generally lean more negative than positive. About one-third (35%) say their ability to afford the health care they need would get better if the U.S. adopted Medicare-for-all, while 28% say it would get worse and 37% say it would stay about the same. On other aspects of their care, more U.S. adults expect things to get worse or stay about the same. The largest share, about six in ten (61%) adults, expect the amount they pay in taxes to be “worse” under a Medicare-for-all plan, while one in ten say this would be “better” and three in ten (29%) say it would be “about the same.”
Notably, adults who favor Medicare-for-all appear to support such a plan despite having mixed views on how it would impact them personally. While about half (48%) of Medicare-for-all supporters say their ability to afford the health care they need would get better under such a plan, the same share (48%) expects the amount they pay in taxes to get worse. At the same time, at least half of those who support Medicare-for-all say their own access to providers, wait times, and insurance paperwork would remain about the same. Medicare-for-all opponents are more unified, with majorities saying each of these things would get worse under such a system.
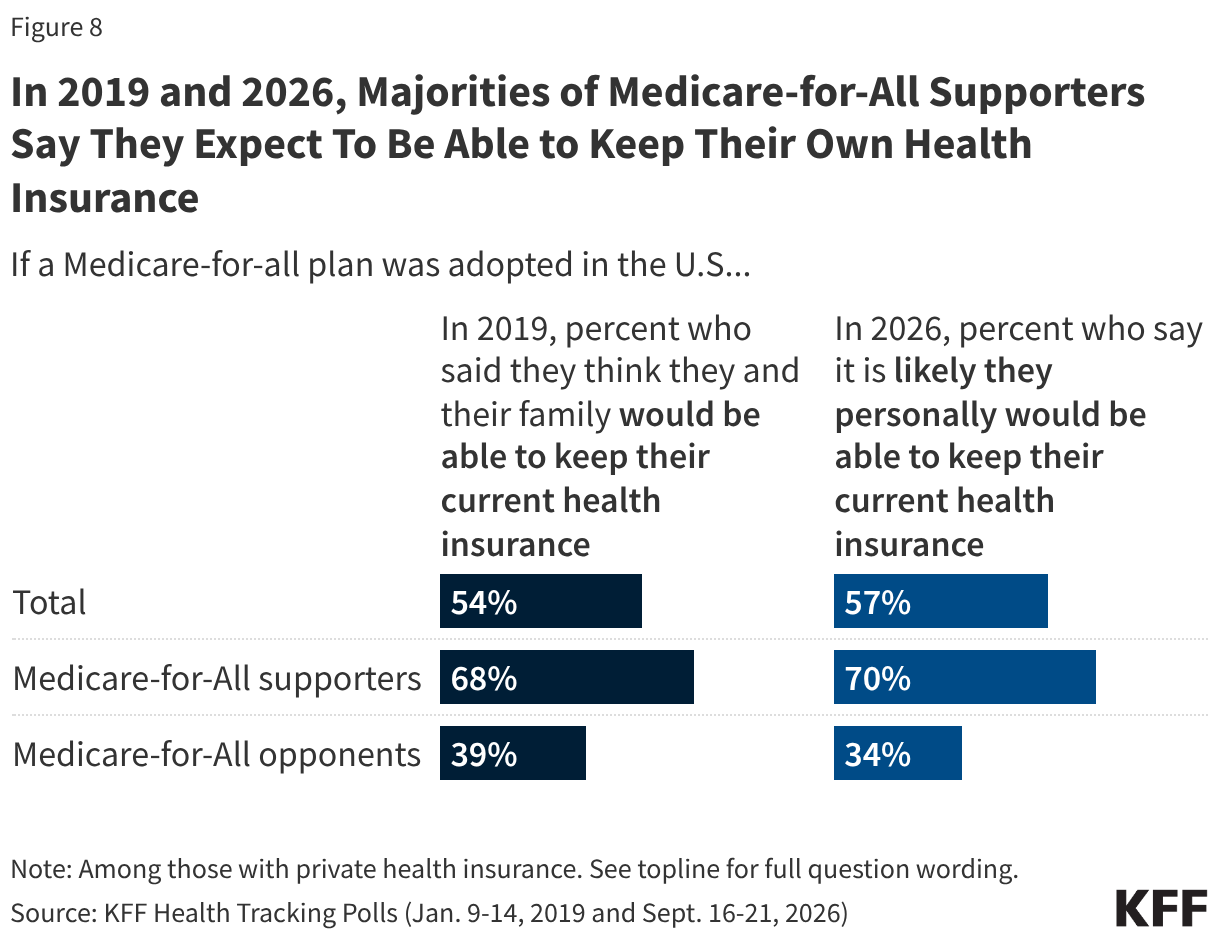
Most U.S. adults with private health insurance think they would be able to keep their current coverage under a Medicare-for-all plan. About six in ten (57%) adults with private health insurance, either through an employer or purchased themselves, say it is likely they would be able to keep their current health insurance if the U.S. adopted Medicare-for-all, including seven in ten privately insured adults who favor Medicare-for-all.
This misconception is not new. In a KFF poll from 2019, as Medicare-for-all was debated in the Democratic presidential primary, most adults with private health insurance incorrectly said they would likely be able to keep their own insurance under a national plan. Notably, most Medicare-for-all proposals, including legislation introduced by Sen. Bernie Sanders in 2017, would replace most current private health insurance with a single government plan.
A Historical Look at National Health Plan Polling
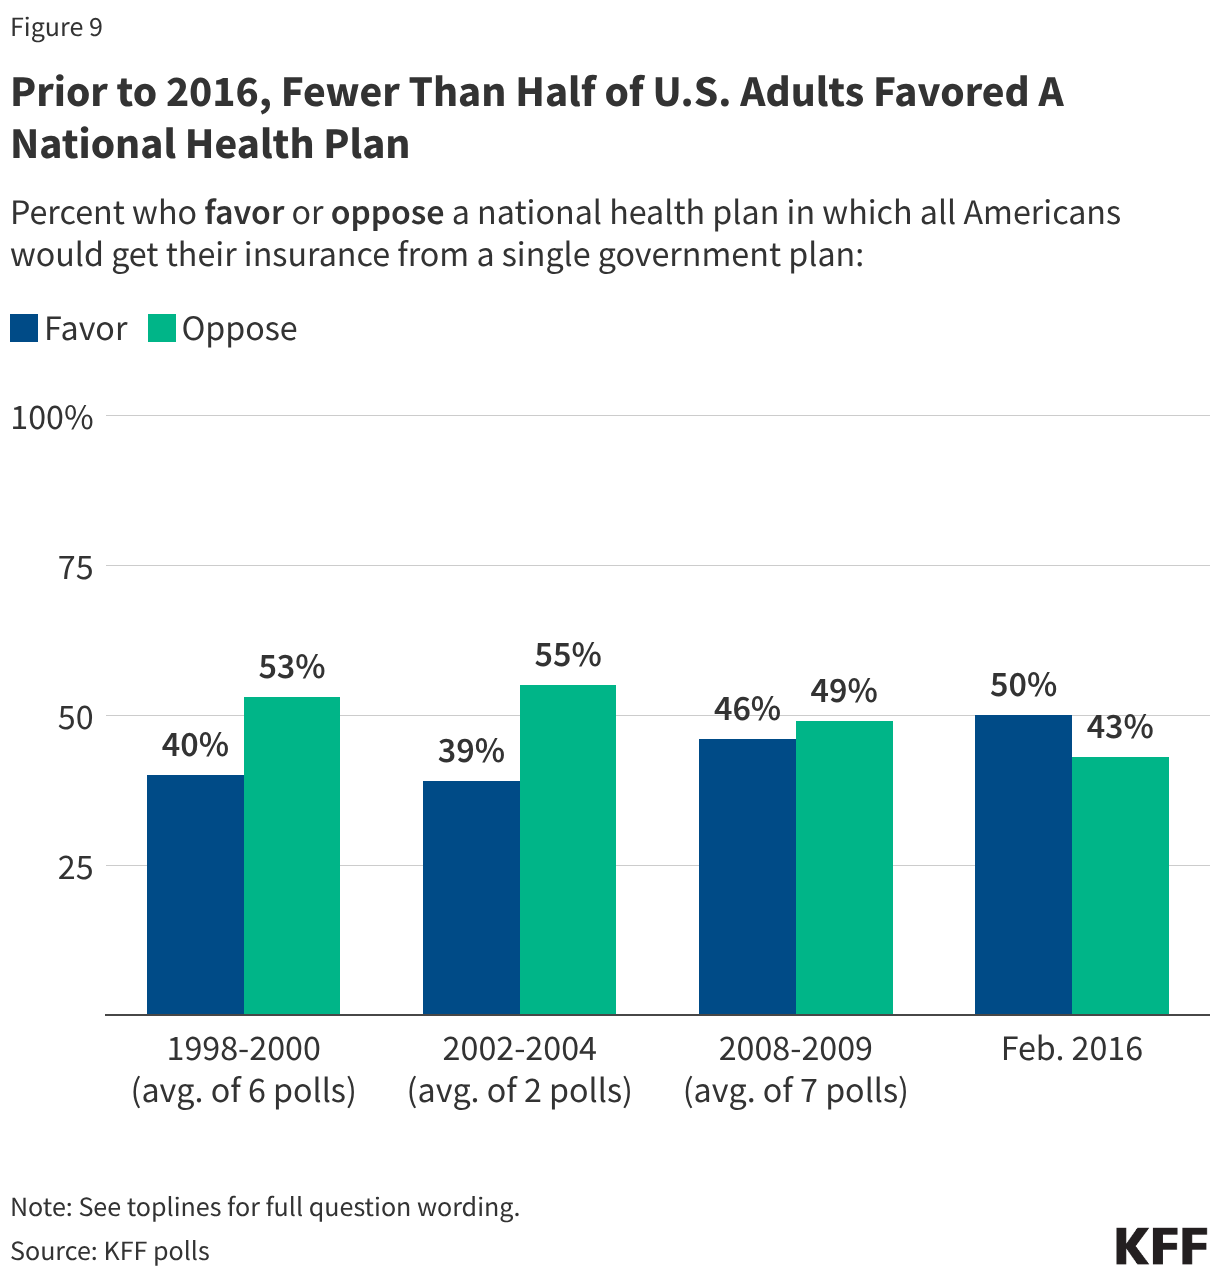
Prior to the focus on Medicare-for-all in 2017, KFF polls tracked questions about support for a single-payer health plan back to 1998. These polls showed that fewer than half of adults supported a national health plan until 2016, when it became a focus of the Democratic presidential primary with Sen. Bernie Sanders’ campaign. In KFF polls conducted from 1998 to 2004, about four in ten adults favored a national health plan while a majority opposed it. During the 2008-2009 health reform debate, an average of seven KFF polls shows just under half of adults supported the plan (46%) and about half opposed it (49%). By February 2016, half of adults favored a national health plan while about four in ten (43%) opposed it.
Phrasing the Question
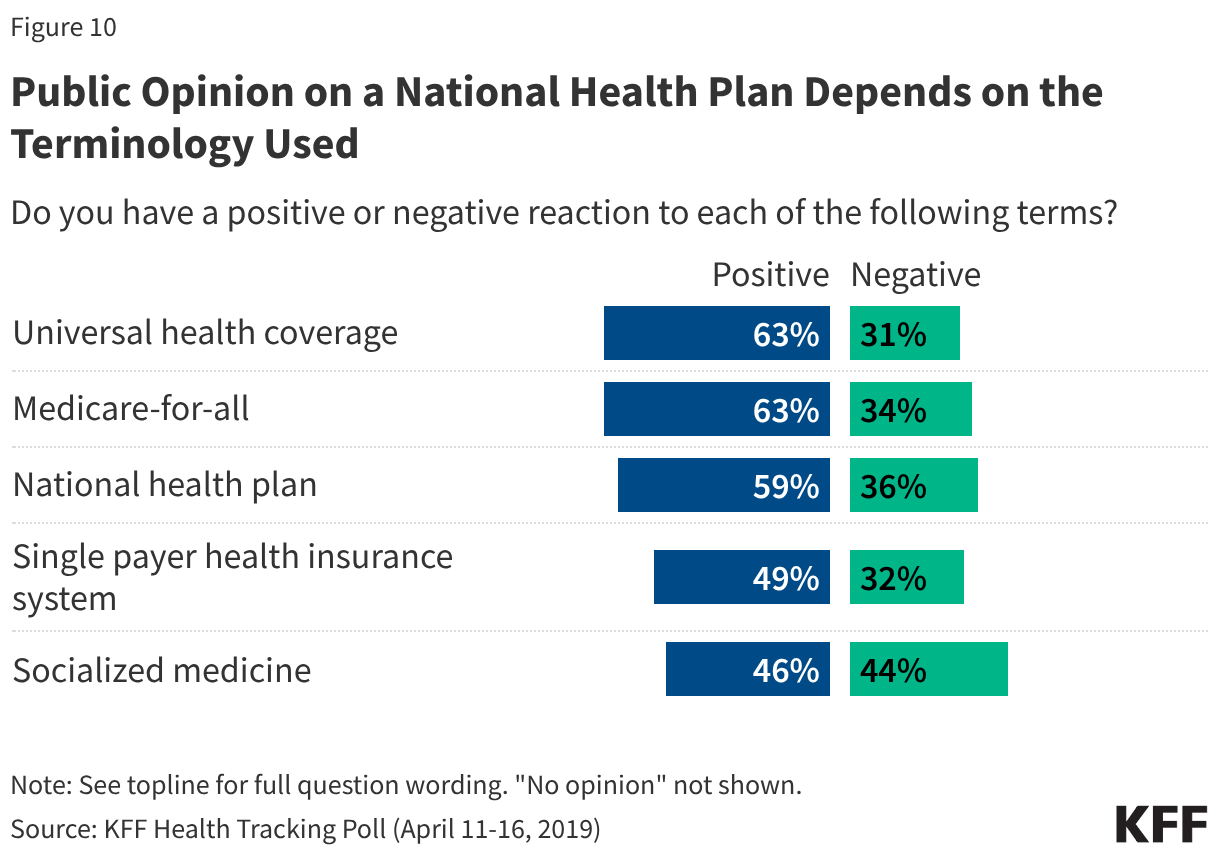
Polling shows that the terminology used affects public opinion on a national health plan. A KFF Health Tracking Poll from April 2019 found that majorities of adults had positive reactions to the terms “universal health coverage” (63%), “Medicare-for-all” (63%), and “national health plan” (59%). Fewer had positive reactions to “single-payer health insurance system” (49%), a term for which about one in five did not offer an opinion. In addition, public opinion was split on “socialized medicine” (46% positive, 44% negative).
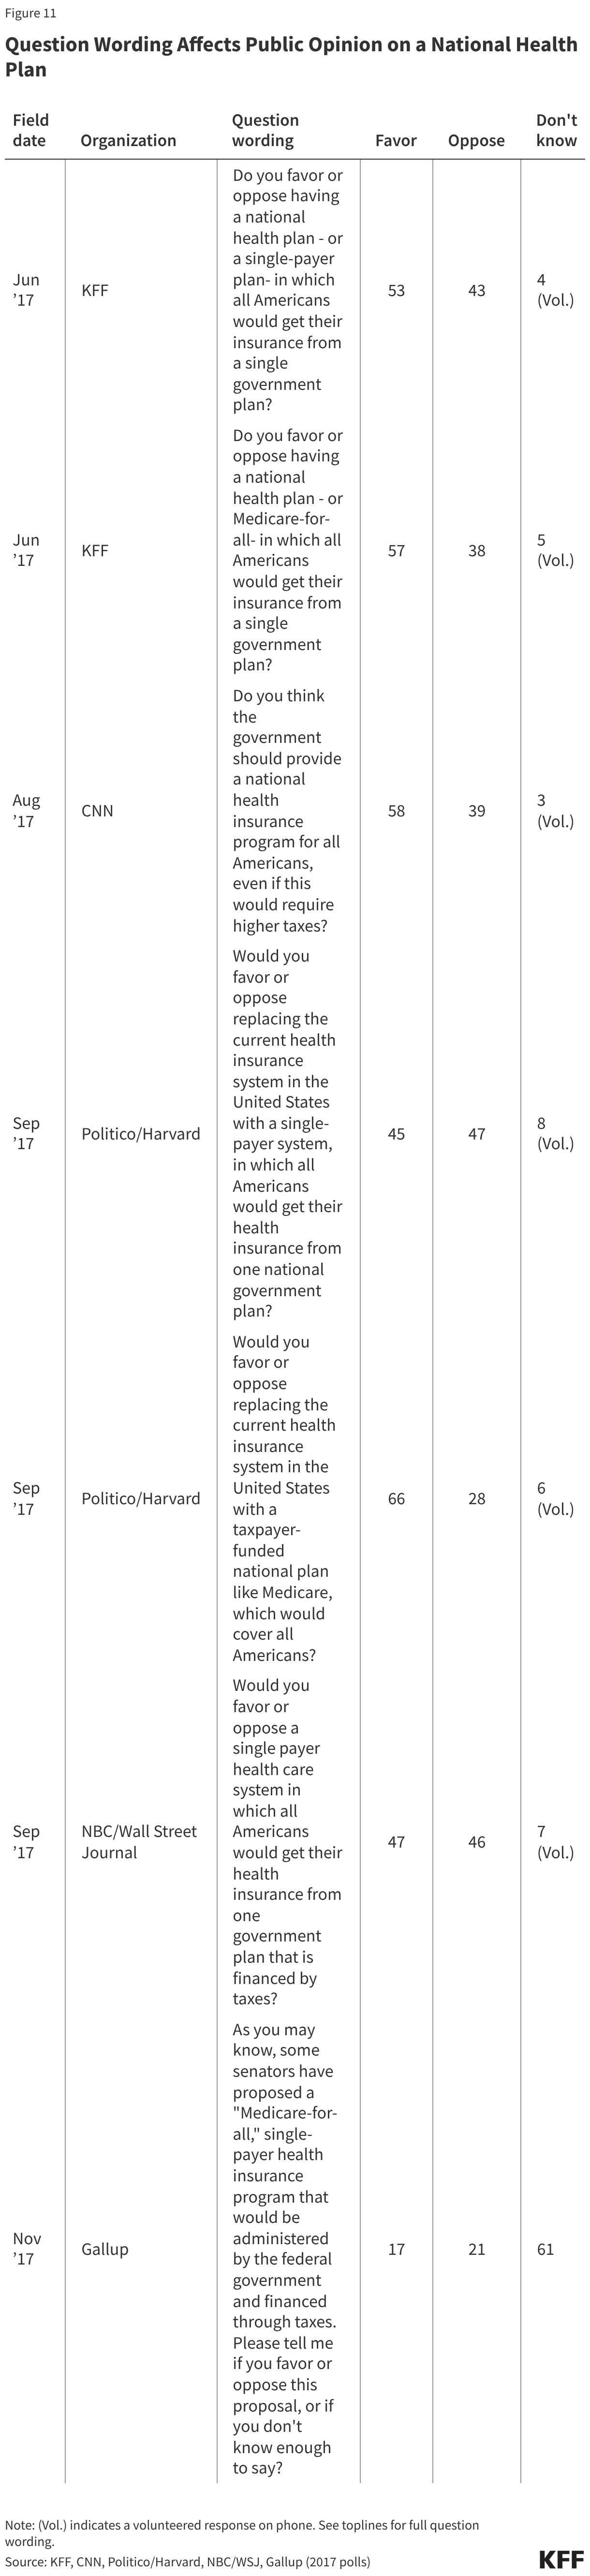
Additionally, question wording itself can impact the level of support measured for a national health plan. Polls from 2017 show that the term used, whether financing through taxes is mentioned, and whether respondents are offered the option to say they don’t know enough can all affect measured support. For example, a September 2017 Politico/Harvard poll found that fewer than half (45%) favored replacing the current health insurance system with a “single-payer system,” while two-thirds (66%) favored replacing it with a “taxpayer-funded national plan like Medicare.” Polls that mention financing through taxes have found support ranging from an even split in a 2017 NBC/Wall Street Journal poll (47% favor, 46% oppose) to a majority in favor in a CNN poll in 2017 (58%). And when a November 2017 Gallup poll explicitly offered the option to say they didn’t know enough, only about one in five said they favored (17%) or opposed (21%) a Medicare-for-all proposal, with six in ten (61%) saying they did not know enough to say.