2024 Medical Loss Ratio Rebates
The Medical Loss Ratio (MLR) provision of the Affordable Care Act (ACA) limits the amount of premium income that insurers can keep for administration, marketing, and profits. Insurers that fail to meet the applicable MLR threshold are required to pay back excess profits or margins in the form of rebates to individuals and employers that purchased coverage.
In the individual and small group markets, insurers must spend at least 80% of their premium income on health care claims and quality improvement efforts, leaving the remaining 20% for administration, marketing expenses, and profit. The MLR threshold is higher for large group insurers, which must spend at least 85% of their premium income on health care claims and quality improvement efforts. MLR rebates are based on a 3-year average, meaning that rebates issued in 2024 will be calculated using insurers’ financial data in 2021, 2022 and 2023 and will go to people and businesses who bought health coverage in 2023.
This analysis, using preliminary data reported by insurers to state regulators and compiled by Mark Farrah Associates, finds that insurers estimate they will issue a total of about $1.1 billion in MLR rebates across all commercial markets in 2024. Since the ACA began requiring insurers to issue these rebates in 2012, a total of $11.8 billion in rebates have already been issued to individuals and employers, and this analysis suggests the 2012-2024 total will rise to about $13 billion when rebates are issued later this year.
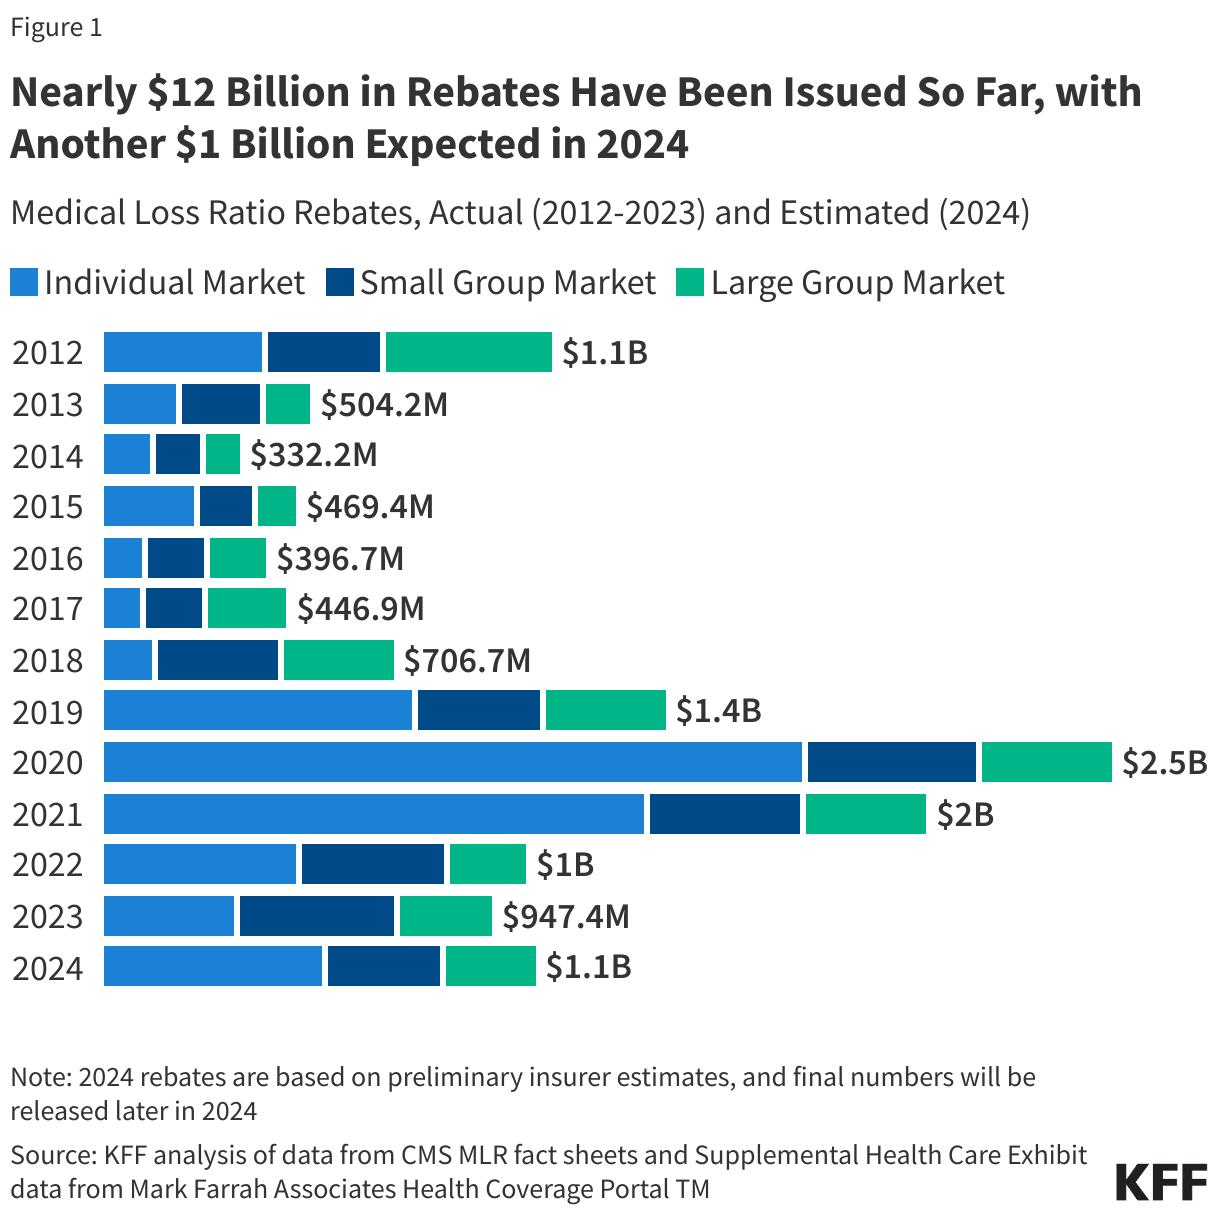
Estimated total rebates across all commercial markets in 2024 ($1.1 billion) are similar to total rebates issued in 2022 ($1.0 billion) and in 2023 ($950 million). In 2023, rebates were issued to 1.7 million people with individual coverage and 4.1 million people with employer coverage. In the individual market, the 2023 average rebate per person was $196, while the average rebates per person for the small group market and the large group market were $201 and $104, respectively (though enrollees could receive only a portion of this as rebates may be shared between the employer and employee or be used to offset premiums for the following year).
The estimated $1.1 billion in rebates to be issued later this year will be larger than those issued in most prior years but fall far short of recent record-high rebate totals of $2.5 billion issued in 2020 and $2.0 billion issued in 2021, which coincided with the onset of the pandemic.
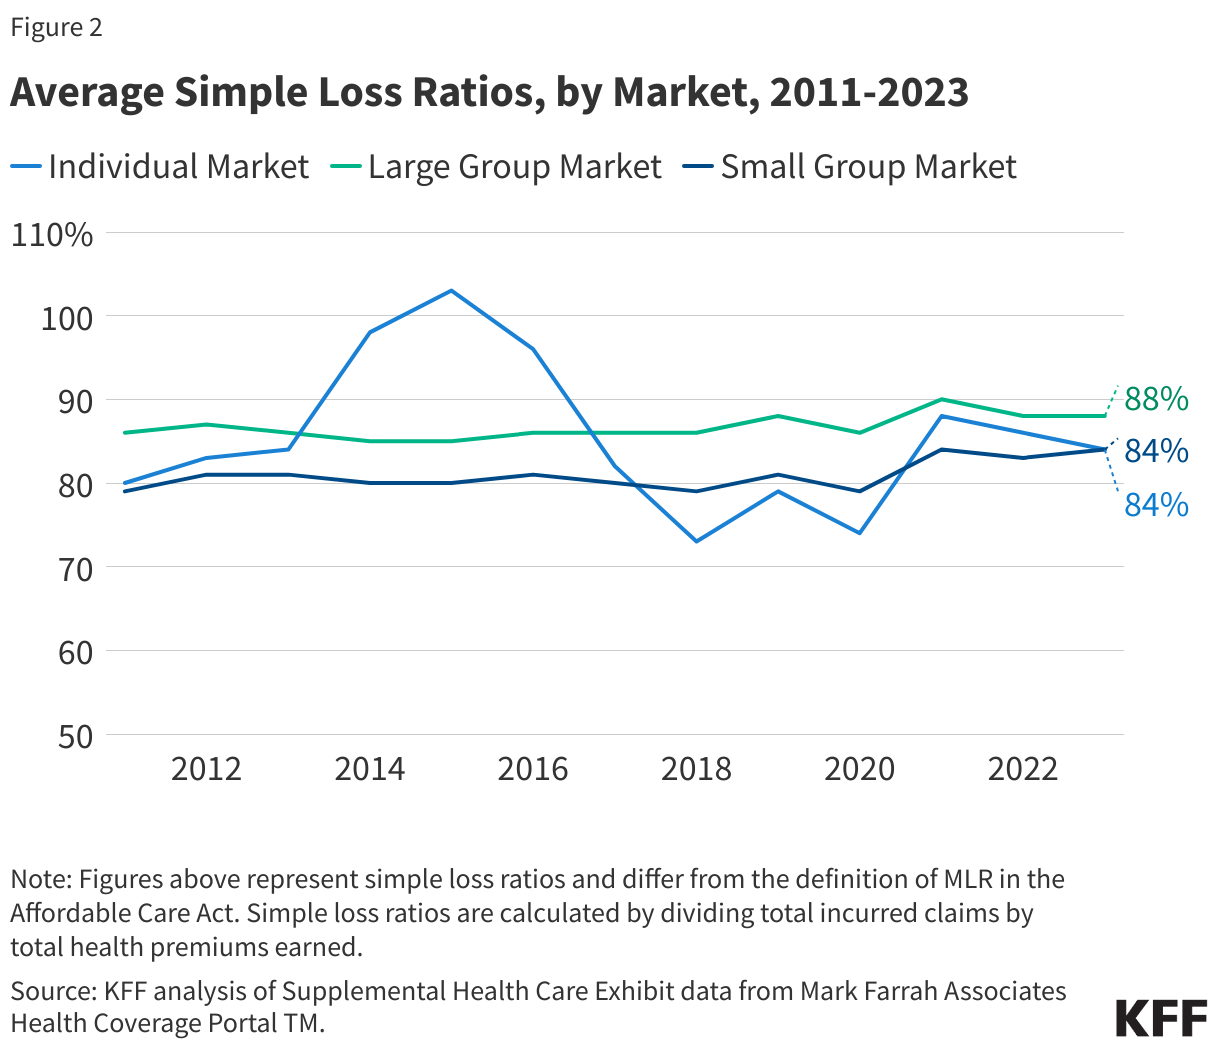
In 2023, the average individual market simple loss ratio (meaning that there’s no adjustment for quality improvement expenses or taxes and therefore, don’t align perfectly with ACA MLR thresholds) was 84%, meaning these insurers spent an average of 84% of their premium income in the form of health claims in 2023. However, rebates issued in 2024 are based on a three-year average of insurers’ experience in 2021-2023. Consequently, even insurers with high loss ratios in 2023 may expect to owe rebates if they were highly profitable in the prior two years.
In the small and large group markets, 2023 average simple loss ratios were 84% and 88%, respectively. Only fully-insured group plans are subject to the ACA MLR rule; about two thirds of covered workers are in self-funded plans, to which the MLR threshold does not apply.
Rebate Payment Logistics
The 2024 rebate amounts in this analysis are still preliminary. Rebates or rebate notices are mailed out by the end of September and the federal government will post a summary of the total amount owed by each issuer in each state later in the year.
Insurers in the individual market may either issue rebates in the form of a check or premium credit. For people with employer coverage, the rebate may be shared between the employer and the employee depending on the way in which the employer and employee share premium costs.
If the amount of the rebate is exceptionally small (less than $5 for individual rebates and less than $20 for group rebates), insurers are not required to process the rebate, as it may not warrant the administrative burden required to do so.
Methods |
| This analysis is based on insurer-reported financial data from Health Coverage Portal TM, a market database maintained by Mark Farrah Associates, which includes information from the National Association of Insurance Commissioners. The Supplemental Health Care Exhibit dataset analyzed in this report does not include data from California HMOs regulated by California’s Department of Managed Health Care. All individual market figures in this analysis are for major medical insurance plans sold both on and off exchange. Simple loss ratios are calculated as the ratio of the sum of total incurred claims to the sum of health premiums earned.
Rebates for 2024 are based on preliminary estimates from insurers. In some years, final rebates are higher than expected and in other years, final rebates are lower. |