Medicare Patients’ Access to Physicians: A Synthesis of the Evidence
For many people, having good access to health care means having a regular doctor, being able to schedule timely appointments with that doctor, and being able to find new ones when needed. Good access to doctors is especially important for people with Medicare—seniors and adults with permanent disabilities—because they are significantly more likely than others to need health care services. Media reports over the last several years have periodically raised the question of whether Medicare beneficiaries have trouble finding a doctor who will see them.1 Indeed, looming threats of significant Medicare payment cuts for physician services due to the Sustainable Growth Rates (SGR) system (a payment formula that has been in law, but repeatedly overridden by Congress) continues to generate news stories of doctors not taking Medicare patients.2
This issue brief examines the evidence on Medicare patients’ access to physicians to assess the extent to which these concerns are supported by findings from multiple patient surveys, physician surveys, published studies, and new physician data from Medicare. .
Main findings:
- On a national level, Medicare patients have good access to physicians. The vast majority (96%) of Medicare beneficiaries report having a usual source of care, primarily a doctor’s office or doctor’s clinic.
- Most people with Medicare—about 90 percent—are able to schedule timely appointments for routine and specialty care. Medicare seniors are more likely than privately insured adults age 50-64 to report “never” having to wait longer than they want for timely routine care appointments.
- A small share of Medicare beneficiaries say they looked for a new physician in the past year, and only 2 percent of seniors with Medicare report problems finding one when needed—comparable to rates reported by privately insured adults age 50-64.
- Medicare seniors report foregoing medical care at similar or lower rates than privately insured adults age 50-64. Certain subgroups of the Medicare population are more likely than others to report not seeing a doctor when they thought they needed to during the year, particularly beneficiaries who: are under age 65 and qualify for Medicare because of a permanent disability; have either Medicaid (dually eligible for Medicare and Medicaid) or no supplemental coverage; are Black; have lower incomes; are in fair or poor health, and/or have five or more chronic conditions. Even within these vulnerable subgroups, however, the majority do not report foregoing doctor visits when needed.
- According to recently-released physician survey data, the majority (91%) of non-pediatric physicians accept new Medicare patients—the same rate that accept new patients with private non-capitated insurance. This correlation persists generally across states, indicating that physician acceptance of new Medicare patients may be more related to local market factors than issues unique to Medicare overall.
- According to new physician data from Medicare, less than 1 percent of physicians in clinical practice have formally “opted-out” of the Medicare program, with psychiatrists accounting for the largest share (42%).
These findings show that according to national patient and physician surveys (described in the text box on page 11) and other data sources, most Medicare beneficiaries enjoy good access to physician services, comparable to the experiences of privately insured patients.
Most physicians accept new Medicare patients, and relatively few have formally opted out of the Medicare program. More granular analysis is needed to examine access problems that may be more evident in local markets and the consequences for beneficiaries in those areas. In addition, greater attention is needed to assess and address access concerns, to the extent they occur, among beneficiaries with the greatest needs and vulnerabilities.
The majority of Medicare patients have a usual source of health care
Multiple national surveys find that the vast majority of people with Medicare have a usual source of care for when they are sick or seeking medical advice. This key indicator of access to care is particularly important for Medicare beneficiaries because they tend to have more chronic conditions and medical needs than others.
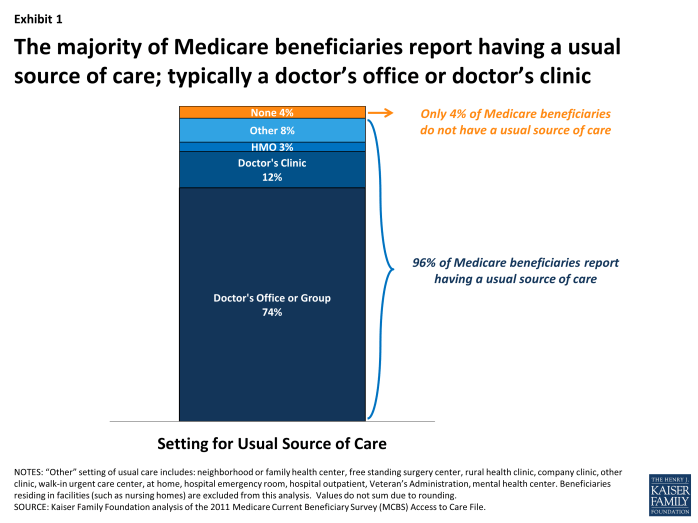
Overall, 96 percent of Medicare beneficiaries say they have a usual source of care, with most (86%) reporting that it is either a doctor’s office or a doctor’s clinic, according analysis of the Medicare Current Beneficiary Survey (MCBS) (Exhibit 1).3 Similarly high rates of having a usual source of care among Medicare seniors are documented in other surveys, ranging from 92 percent to 98 percent, as found in the 2010 Medical Expenditure Panel Survey (MEPS) and the 2011 National Health Interview Survey (NHIS).4 In fact, Medicare beneficiaries are more likely than younger adults (age 18-65) with private insurance to report having a usual source of care, according to both MEPS and NHIS.
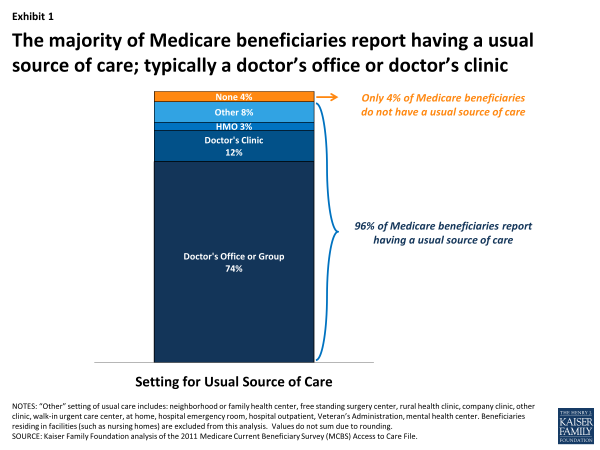
Exhibit 1. The majority of Medicare beneficiaries report having a usual source of care; typically a doctor’s office or doctor’s clinic
While just 4 percent of all Medicare beneficiaries report having no usual source of care, certain vulnerable subgroups of the Medicare population are more at risk for lacking a usual source of care. For example, 12 percent of Medicare beneficiaries without any supplemental coverage (such as Medigap, or Medicaid) report having no usual source of care. Other vulnerable groups who report not having a usual source of care at slightly higher rates than the overall Medicare population include Hispanic beneficiaries, beneficiaries with Medicaid, beneficiaries with lower incomes, and beneficiaries under age 65 with a permanent disability (Appendix Table 1).
Most Medicare patients report always or usually being able to schedule timely doctor appointments
In addition to having a regular physician, being able to schedule timely medical appointments is another marker of good access to care. On this measure, most beneficiaries appear to be able to schedule appointments fairly easily. For example, when quantifying access by the number of days that beneficiaries say they must wait for appointments, about half (51%) of beneficiaries report that they are able to get appointments within three days and only 12 percent report that they have to wait 19 days or more to get an appointment, according to our analysis of the MCBS (not shown).
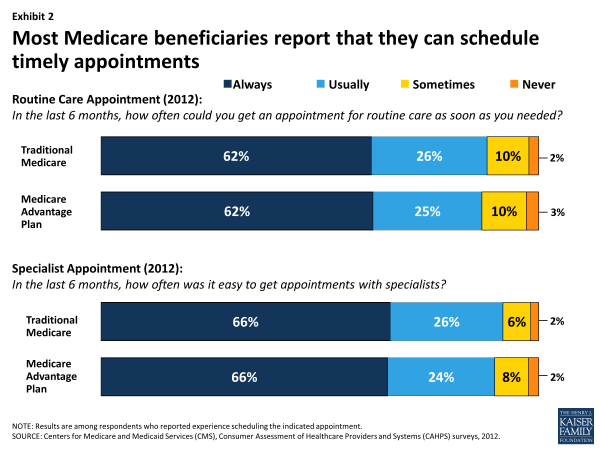
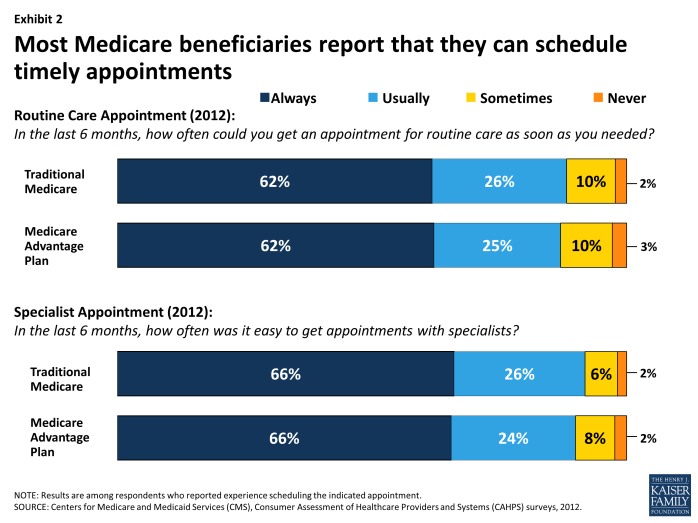
When asked about scheduling timely appointments, beneficiaries in traditional Medicare and those in Medicare Advantage report similar experiences. Specifically, 88 percent of beneficiaries in traditional Medicare and 87 percent of beneficiaries in Medicare Advantage report either “usually” or “always” being able to schedule timely appointments for routine care, according to the 2012 Consumer Assessment of Health Providers and Systems (CAHPS) surveys (Exhibit 2). Rates for scheduling specialist appointments are even higher, with 92 percent of beneficiaries in traditional Medicare and 90 percent in Medicare Advantage reporting that it is “always” or “usually” easy to get appointments with specialists.
Seniors on Medicare report similar experiences as younger privately insured adults age 50-64 when it comes to waiting for an appointment to see a doctor for routine medical care. According to the 2012 Medicare Payment Advisory Commission (MedPAC) patient survey, 77 percent of Medicare seniors and 72 percent of privately insured adults age 50-64 report “never” having to wait longer than they wanted to get an appointment for routine care.5
In every state and DC, a very small share of beneficiaries—less than 5 percent in both traditional Medicare and Medicare Advantage—report that they encounter major problems and are “never” able to schedule timely appointments with a doctor for either routine care or specialty care, according to the CAHPS surveys (Appendix Tables 2 and 3). Among beneficiaries in traditional Medicare, the share who report either “never” or only “sometimes” being able to schedule timely appointments for routine care ranges from 8.4 percent in Oregon to 16.5 percent in New Mexico. With regard to specialty care, the percentage of beneficiaries who report that it is either “never” or only “sometimes” easy to get appointments with specialists ranges from 3.8 percent in Nebraska to 13.5 percent in New Mexico. Further analysis is needed to assess the causes and effects of variations observed across states, and to examine within-state variations at a more granular level to assess the extent to which access problems vary by local health markets.
Most Medicare beneficiaries are able to find a new doctor when they need one, but a small share encounter problems
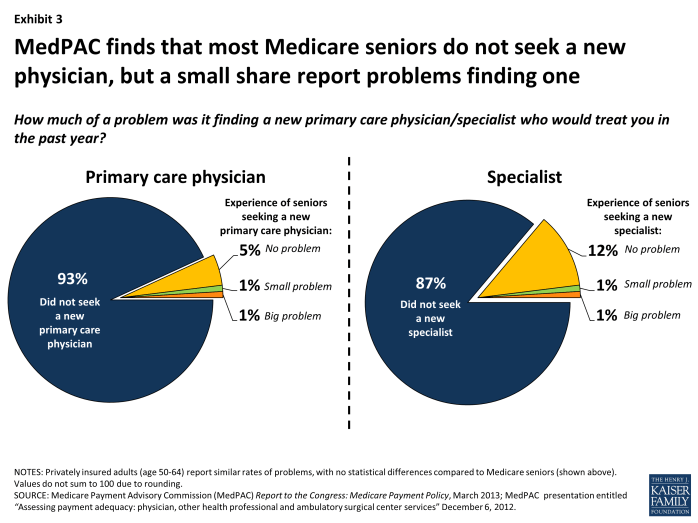
Most beneficiaries have a usual source of care and say they have not needed to look for a new primary care doctor or specialist in the past year. Among the small share of seniors who have looked for a new physician—perhaps because of a new medical problem, their doctor retired, or they moved—most report being able to find one, but a small number report experiencing problems.6 The MedPAC survey and the NHIS show similar experiences among seniors with Medicare and younger adults with private insurance when it comes to finding new physicians. For both Medicare seniors and privately insured individuals, problems are a little more likely to occur when looking for a primary care physician compared with a specialist.
Finding a primary care physician. Among Medicare seniors, a very small share (1.8%) report problems finding a primary care physician, similar to the rate observed among privately insured adults age 50 to 64 (1.6%) according to the 2012 MedPAC patient survey (Exhibit 3). A main reason for this low rate among the Medicare beneficiary population is that only 7 percent of Medicare beneficiaries report looking for a new primary care physician during the year. Another national survey, the 2011 NHIS, similarly shows that 2.4 percent of Medicare seniors and 1.7 percent of privately insured adults age 18-64 had trouble finding a general doctor or provider in the past year, with 0.4 percent of Medicare beneficiaries ages 65 and older and 0.5 percent of privately insured individuals saying that they were unable to find one.
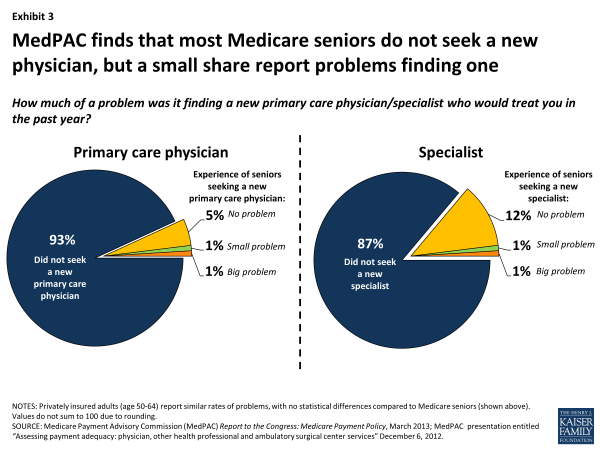
Exhibit 3. MedPAC finds that most Medicare seniors do not seek a new physician, but a small share report problems finding one
A 2008 Kaiser Family Foundation survey similarly found that 12 percent of Medicare beneficiaries under age 65 reported problems finding a doctor who accepts Medicare, compared with 4 percent among their older Medicare counterparts.7
Finding a specialist. A very small share of seniors with Medicare (1.6%) report having a problem finding a new specialist, a share comparable to privately insured adults age 50 to 64 (2.4%), as reported on the MedPAC survey. Of note, this survey also found that among seniors with Medicare and privately insured adults age 50 to 64, nonwhites are more likely to report problems finding a new specialist (data not shown).8
Only 4 percent of the overall Medicare population report being either “very dissatisfied” or “dissatisfied” with the availability of specialists, but certain subgroups of people with Medicare are more likely to report dissatisfaction at these levels, according to our analysis of the MCBS. These include beneficiaries in poor and fair health (11% and 6% respectively), beneficiaries under age 65 who qualify for Medicare because of a disability (8%), beneficiaries who do not live in metropolitan areas (6%), beneficiaries with 5 or more chronic conditions (6%), and beneficiaries with lower incomes (5%) (Appendix Table 4).
Most Medicare beneficiaries report that they see a doctor when needed
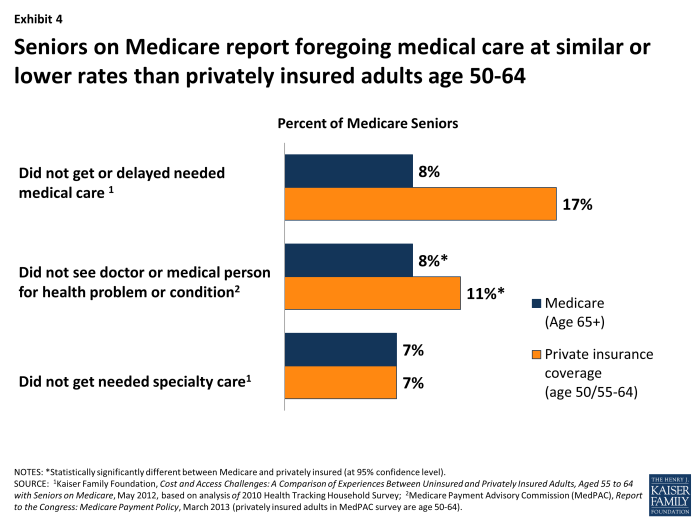
Looking at patient access to physicians more broadly, most Medicare beneficiaries report that they are able to see a doctor for a medical problem or condition when they think they need to, with less than 10 percent reporting delaying or foregoing medical care in the previous year (Exhibit 4). Compared with privately insured individuals (age 50 to 64), Medicare seniors have lower rates of forgoing medical care. Among people needing specialty care, equal percentages (7%) of Medicare seniors and privately insured 55 to 64 year olds report not getting specialty care when they needed it, according to the Health Tracking Household Survey (HTHS) conducted by the Center on Health Systems Change.9
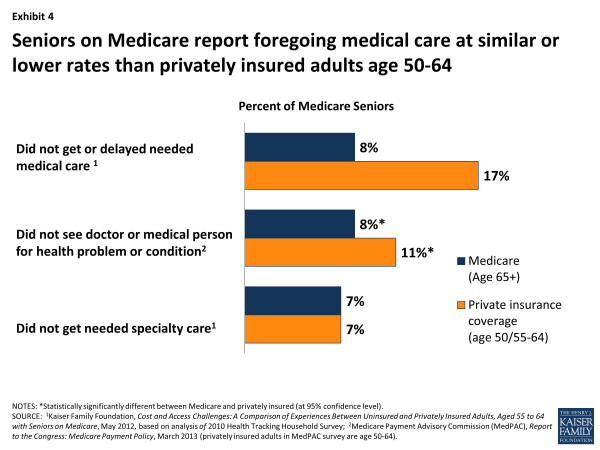
Exhibit 4. Seniors on Medicare report foregoing medical care at similar or lower rates than privately insured adults age 50-64
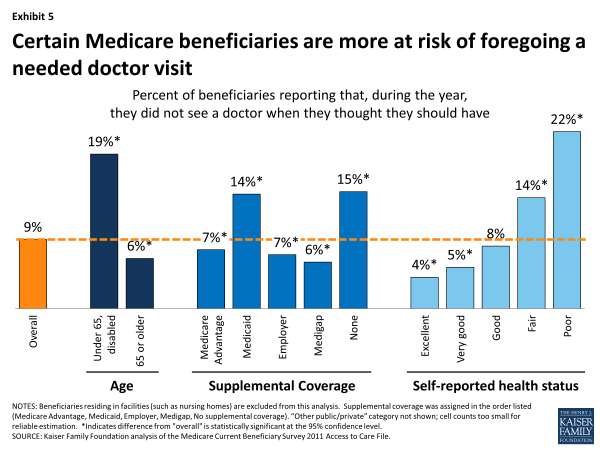
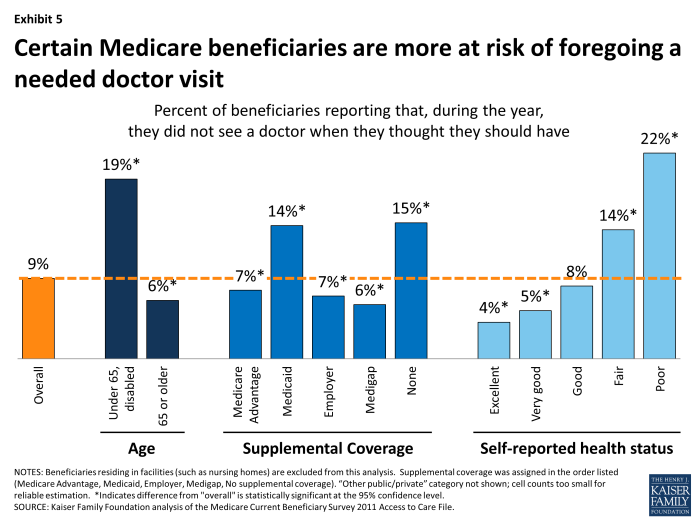
Although most people with Medicare see physicians when they think they need to, certain subgroups report foregoing care more frequently—particularly those who are more likely to use health care due to ongoing medical conditions. Medicare beneficiaries under age 65 with permanent disabilities report that they did not see a doctor when they thought they should have at more than three times the rate of Medicare seniors (19% vs. 6%) (Exhibit 5, Appendix Table 5). Also at higher risk of foregoing physician visits include beneficiaries who: are in poor or fair health (22% and 14% respectively), have at least five chronic conditions (16%), have no supplemental coverage (15%) or Medicaid (14%), are Black (12%), and/or have lower incomes (11%).
Among the 9 percent of beneficiaries who said that they did not see a doctor for a medical problem in the MCBS survey, 8 percent (equivalent to less than 1% of the total Medicare population) attribute the reason to having trouble finding a doctor (not shown); 2 percent of the 9 percent who did not see a doctor when needed said that the problem was due to doctors not accepting their insurance—with no statistically significant difference between Medicare Advantage and beneficiaries in traditional Medicare. More common reasons cited by patients include that the medical problem was not serious or the cost was too high.10
The Commonwealth Fund reports similar findings from its 2010 Health Insurance Survey. Results from this survey show that Medicare seniors are less likely than younger adults with employer-sponsored coverage to report a variety of access problems related to medical costs.11 Also, this survey shows that across all insurance types, including but not limited to Medicare, adults who are more likely to experience cost-related access problems are those who have low incomes, are in poor health, or have chronic health conditions.
Most doctors are accepting new Medicare patients—with some variation by state and clinical specialty
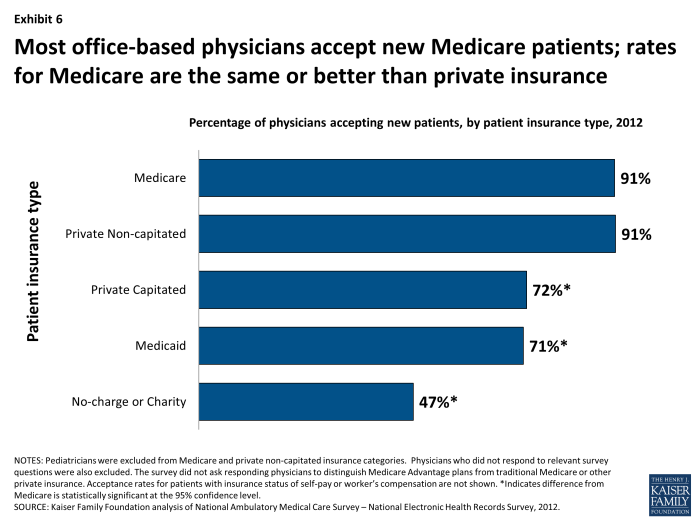
Most office-based physicians (91%) report that they accept new Medicare patients into their practice, according to analysis of the 2012 National Ambulatory Medical Care Survey (NAMCS)-National Electronic Health Records Survey (Exhibit 6).12 This acceptance rate for new Medicare patients is the same as for new patients with private non-capitated insurance (91%), but is higher than for new patients with private capitated insurance (72%), Medicaid (71%), and no charge/charity care (47%).13 For both Medicare and Medicaid, the NAMCS does not distinguish insurance coverage provided under private health plans (such as Medicare Advantage or Medicaid managed care plans) versus traditional Medicare or Medicaid.
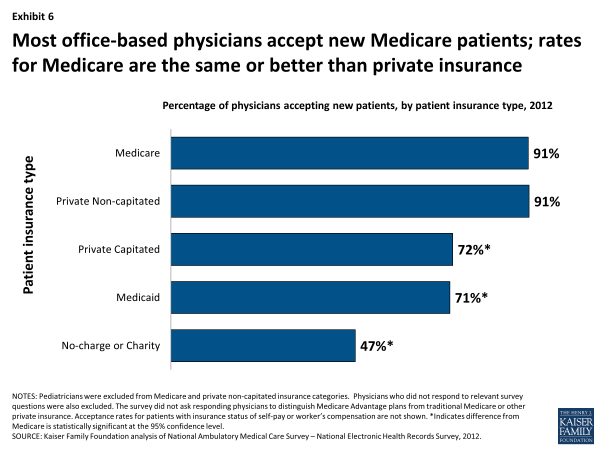
Exhibit 6. Most office-based physicians accept new Medicare patients; rates for Medicare are the same or better than private insurance
Most physicians (97%) report having open practices, with the remaining small share of physicians indicating that they have closed practices and are not accepting any new patients, regardless of insurance type. While most physicians are in open practices, the NAMCS does not inquire about the degree to which physicians in open practices are taking all, most, or just some new patients. Therefore, among the 91 percent of physicians reporting that they are accepting new Medicare patients, it is unknown from this survey to what degree these physicians are accepting all or some new Medicare patients who seek an appointment with them, but they have not closed their practice entirely to new Medicare patients. A helpful modification to the NAMCS would be to ask physicians with open practices whether they take some or all new patients, by insurance type.
Results from the NAMCS are similar to those found in other national surveys, such as the 2008 Health Tracking Physician Survey (HTPS), conducted by the Center for Studying Health Systems Change.14 The HTPS survey found, for example, that among physicians with more than 25 percent of their revenue coming from Medicare (likely excluding pediatricians, predominantly), only 4 percent reported that they were not accepting any new Medicare patients—the same rate as for new privately insured patients. Additionally, a 2012 survey conducted by the Physicians Foundation found that 8.6 percent of physicians reported that “time or cost constraints compelled them to close their practice to Medicare patients”; and 27 percent reported doing the same for Medicaid patients.15
While overall rates of physicians accepting new Medicare patients is high, there is some variation by physicians’ specialty, state, size of practice, and sex, but no significant differences by other characteristics such as age, type of area (rural/urban), or type of medical degree (Appendix Table 6).
Variation by specialty. Almost all surgical specialists (98%) accept new Medicare patients, but rates are lower among both primary care physicians and other medical specialists (both 88%), (Appendix table 6). Similar differences by specialty are observed in the acceptance of new patients with non-capitated private insurance. That is, surgeons, medical specialists and primary care doctors are as likely to accept new Medicare patients as they are patients with private non-capitated insurance. Overall, primary care physicians are slightly more likely to have closed practices—in which they are not taking any new patients, regardless of insurance—compared with specialists.
Among all physician specialties, psychiatrists are least likely to accept new Medicare patients, with only 64 percent reporting that they accept new Medicare patients in their practice, similar to the rate reported by psychiatrists for new patients with private non-capitated insurance (Appendix Table 6). Smaller shares of psychiatrists are willing to take new patients with private capitated insurance (53%), Medicaid (44%) and no charge/charity (39%). Consistent with these findings, in physician focus groups conducted for MedPAC, psychiatry was the specialty that physicians cited most frequently as difficult for obtaining patient referrals, noting specific problems finding psychiatrists who are accepting new Medicare patients.16
However, among psychiatrists who already have Medicare patients in their current caseload (comprising at least 10 percent of their practice revenue), a considerably higher share (95%) accept new Medicare patients, according to further analysis of the NAMCS-NEHS (not shown). This higher rate suggests that beneficiary access to psychiatrists is concentrated among a relatively smaller subset of psychiatrists who already see Medicare patients, with a significant portion not seeing any Medicare patients.
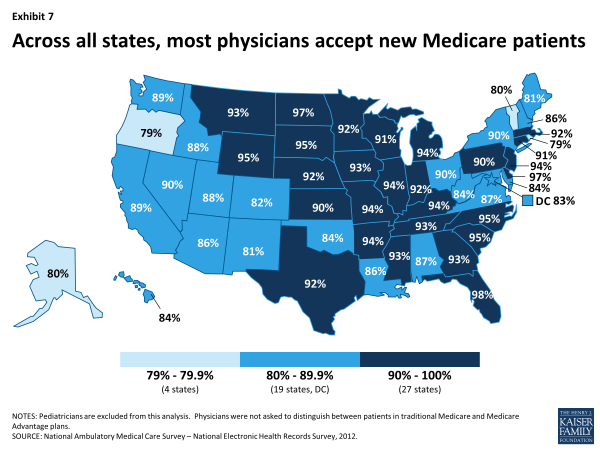
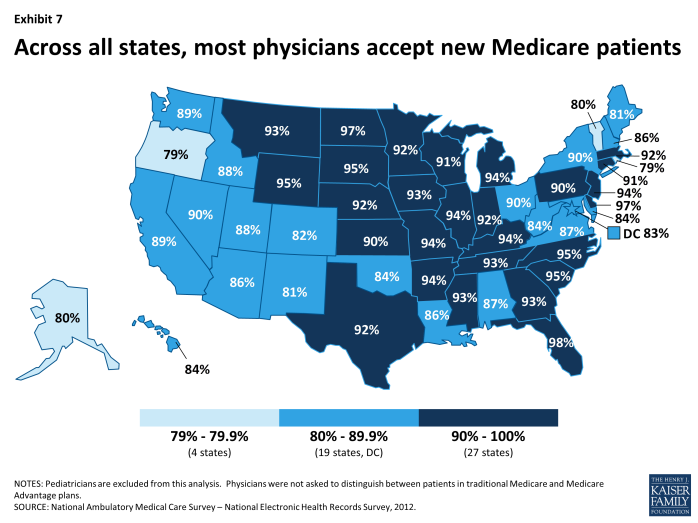
Variation by State. In every state, the majority of physicians accept new Medicare patients, but there is some variation among states—ranging from 79 percent of physicians in Oregon and Rhode Island to 98 percent in Florida (Exhibit 7). In more than half of all states, at least 90 percent of physicians accept new Medicare patients. Additionally, more than half of all Medicare beneficiaries (58%) live in states where at least 90 percent of office-based physicians accept new Medicare patients (not shown).17
Across states, physicians’ acceptance of new Medicare patients is generally correlated with acceptance of new private non-capitated patients and to rates of physicians in open practices, though there are some exceptions. This suggests that in most states, physician acceptance of new Medicare patients may be more related to local market factors than issues unique to Medicare overall (Appendix Table 7).
Acceptance rates, by state, are helpful, but do not provide enough granularity to assess the extent to which certain markets may be more affected than others by physicians choosing not to accept new Medicare patients. Local market conditions play a significant role in physicians’ decisions to participate (or not) with different insurers, often not captured in state-level data.18 For example, the ability of physician practices to leverage higher rates with insurers in any given market could influence participation decisions by physicians, with larger groups exerting greater influence over smaller groups.
The number of physicians seeing Medicare patients is growing, with few formally “opting-out” of Medicare
On a national level, the number of physicians billing Medicare has continued to rise at the same rates as growth in the beneficiary population. From 2009 to 2011, the number of physicians billing Medicare grew from 525,000 to 549,000 maintaining a steady ratio of about 12.3 physicians per 1,000 Medicare beneficiaries.19 The ratios for primary care physicians and specialists per 1,000 beneficiaries have remained steady at 3.8 and 8.5 respectively over those three years, according to MedPAC analysis. These national counts, however, do not address the geographic distribution of physicians and concerns that physician supply, relative to the population, tends to be lower in communities with higher rates of minority and low-income residents who, on average, have greater medical needs than others.20
As has been the case for the past decade, almost all physicians and clinical professionals (96%) who have registered with Medicare have signed “participation” agreements with Medicare, which means that they accept Medicare’s fee-schedule rates as payment-in-full for all services they provide to Medicare patients.21 “Non-participating” physicians may charge beneficiaries higher fees up to a specified maximum, but there are several incentives in the Medicare program for physicians to sign participation agreements, attributing to its high rate across the country.
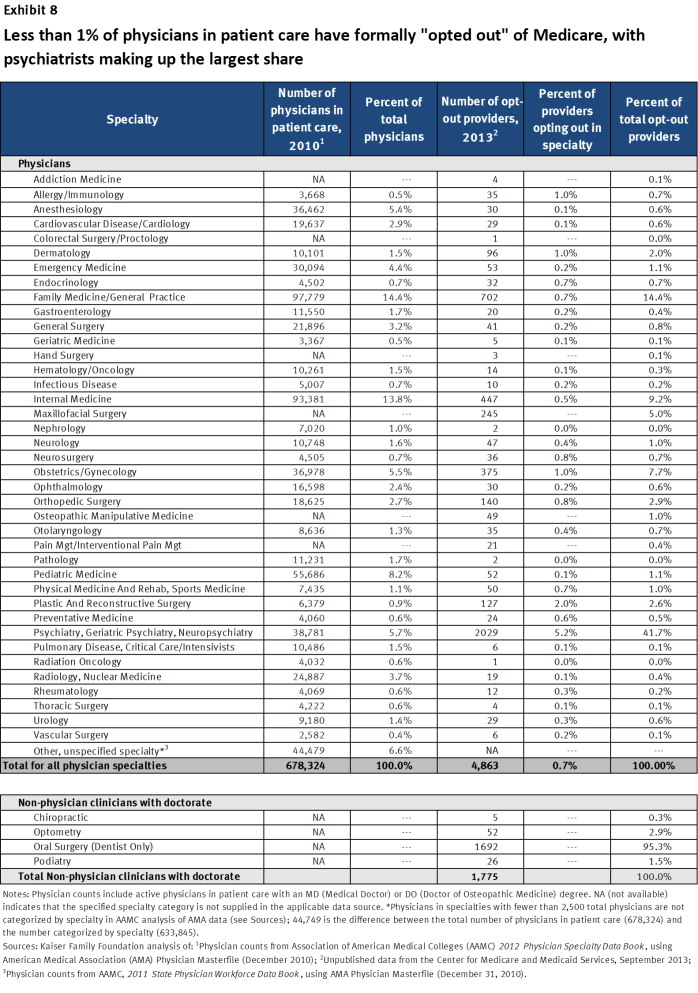
As of September 2013, among all U.S. physicians in clinical practice, less than 1 percent (4,863) have signed affidavits with Medicare indicating that they have “opted out” of the Medicare program entirely, according to new, unpublished data released by the Center for Medicare and Medicaid Services (Exhibit 8).22 Physicians who have opted out of Medicare contract privately with any and all of their Medicare patients for whatever agreed-upon fee they choose. Medicare does not reimburse either the physician or the Medicare patient for any services provided by physicians who have opted out of the Medicare program. Opt-out physicians must tell their Medicare patients that they have opted out of Medicare and provide them with a document stating that Medicare will not reimburse either the physician or the patient for any services furnished by opt-out physicians. Medicare patients must sign this document to signify their understanding of it.
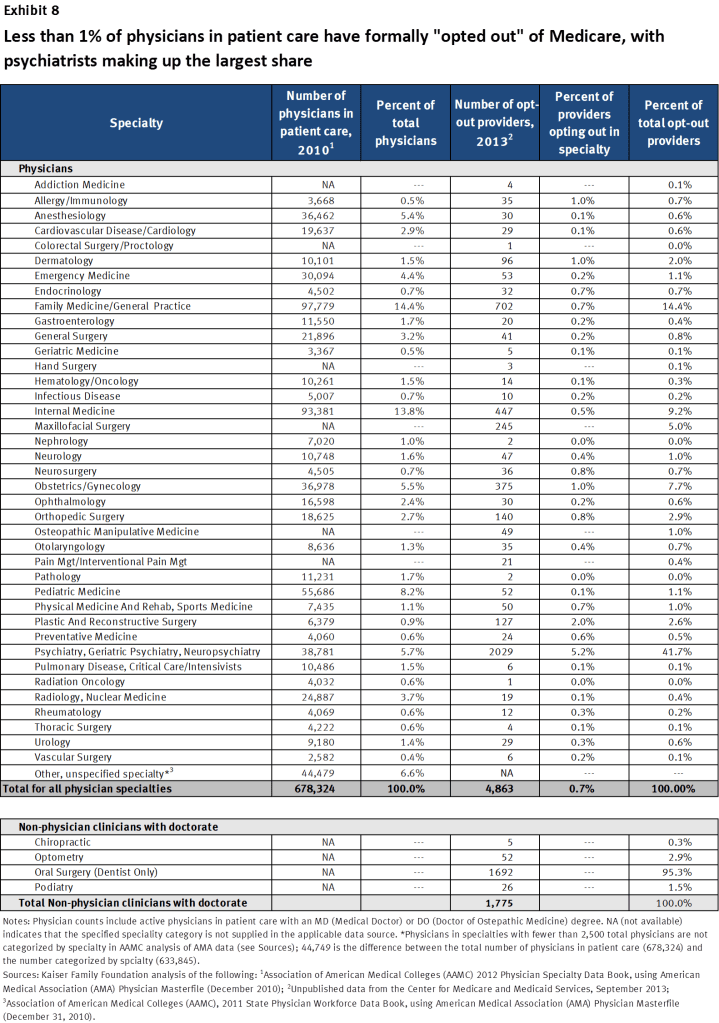
Exhibit 8. Less than 1% of physicians in patient care have formally “opted out” of Medicare, with psychiatrists making up the largest share
Psychiatrists are disproportionately represented among the 0.7 percent of physicians who have opted out of Medicare—comprising 42 percent of all physicians who have opted out. This finding is likely related to data presented earlier in this brief showing that psychiatrists are less likely than other physician specialties to accept new Medicare patients or new privately-insured patients—suggesting a tendency in psychiatry towards requiring payment directly from patients, rather than seeking reimbursement through insurance.
In addition to these 4,863 physicians, another 1,775 clinical professionals with non-physician doctorate degrees (i.e. chiropractors, oral surgeon dentists, podiatrists, and optometrists) also have opted-out of the Medicare program. Dentists who are oral surgeons comprise the majority of this group.
By age, older doctors are considerably more likely to opt out of Medicare, with those over the age of 50 comprising more than 70 percent of the doctors who have opted out of Medicare (not shown). Geographically, in all states except the District of Columbia, less than 2 percent of doctors in each state have opted out of the Medicare program. New York (1.5%) and Connecticut (1.2%) have the next highest rates of physicians who have opted out of Medicare, after DC (6.0%) (Appendix Table 8). Though representing only a fraction of physicians, further research would be helpful to examine opt-out rates in local markets, such as in certain metropolitan areas where rates may be higher, as they are in DC.
Conclusions and further considerations
Nationally, patient and physician surveys and Medicare’s administrative data show that most Medicare patients enjoy good access to physicians and most physicians are accepting new Medicare patients. Moreover, survey findings reveal that Medicare beneficiaries and adults with private insurance report similar access to physicians.
While the majority of Medicare beneficiaries report having a usual source of care and do not forego needed physician visits, certain subgroups of Medicare beneficiaries have higher rates of access problems that warrant close attention. These include beneficiaries with no supplemental insurance or Medicaid, beneficiaries under age 65 living with a permanent disability, beneficiaries in fair and poor health, beneficiaries with four or more chronic conditions, and beneficiaries with lower incomes. For the most part, however, even among these subgroups, most do not report significant problems securing access to medical care when needed.
Physician surveys and Medicare data tell a complementary story to the patient surveys. Overall 91 percent of physicians report taking new Medicare patients—comparable to the rate for new private non-capitated patients. About 1 percent of physicians have formally opted-out of the Medicare program to contract privately with all their Medicare patients, with psychiatrists comprising the largest share. Factors that influence physician decisions about acceptance of new patients can be strongly influenced by local health market circumstances that cannot be ascertained from state-level data. Further research is needed at a more local level to understand how access is affected by other factors including provider supply, other insurer interactions, changes in group practice dynamics, and patient demand for medical services. Survey instruments could be improved to determine if doctors in open practices access some or all new patients, by type of insurance.
While this paper focuses mostly on physicians, the number of other health professionals who provide care to Medicare patients—such as nurse practitioners and physician assistants—has grown rapidly over the past decade.23 Approximately 30 percent of Medicare beneficiaries report having seen a physician assistant or a nurse practitioner for some or all of their primary care, with rural beneficiaries twice as likely as their urban counterparts to have seen these health professionals.24 Access to nurse practitioners and physician assistants may help to ease the caseloads of physician practices, particularly for primary care.
Finally, with the Medicare population aging and growing by 2 million each year, and with an expected influx of newly insured younger adults following implementation of the Affordable Care Act, ongoing efforts will be needed to monitor access issues for Medicare beneficiaries overtime. While some have raised concerns that the supply of physicians in the United States will not keep pace with demand, others have noted that improvements in coordinated, team-based care, and greater reliance on other practitioners, may help mitigate or address this concern.25 Further work is needed to assess the extent to which access problems may be a concern in certain communities, among patients needing certain types of treatment, and among certain populations, but for now, the preponderance of evidence is clear, and consistent: the majority of people with Medicare have good access to physician care.
Surveys Cited In This Issue BriefGovernment SurveysConsumer Assessment of Healthcare Providers and Systems (CAHPS) Surveys The CAHPS is a set of national surveys that provides information on consumers’ experiences with health care, focusing on quality from the patient perspective, such as the ease of access to health care services, and the communication skills of providers. There are separate CAHPS surveys for enrollees in Medicare Advantage (MA) plans and for beneficiaries in traditional Medicare. The Fee-for-Service CAHPS survey has a sample size of 275,000 beneficiaries in traditional Medicare. The CAHPS surveys were first launched in 1995, with a focus on assessment of health plans, and are generally conducted annually. Medical Expenditure Panel Survey (MEPS) Household Component MEPS Household Component is an interview-based survey of households drawn from a nationally representative sample of respondents in the prior year’s National Health Interview Survey. MEPS collects information for each person in the household on the following: demographic characteristics, health conditions, health status, use of medical services, charges and source of payments, access to care, satisfaction with care, health insurance coverage, income, and employment. Respondents are interviewed multiple times during a two-year period. The sample size for 2012 was about 31,200 individuals (12,400 households), including 3,700 people age 65 and over. MEPS is administered by the Agency for Healthcare Research and quality, and began in 1996. Data from the survey are released annually. Medicare Current Beneficiary Survey (MCBS) The MCBS is a continuous survey of a nationally representative sample of the Medicare population, including those who are aged, disabled, residing in the community, and residing in long-term care facilities. The beneficiary survey is focused on health care utilization, costs, and sources of payment for services. Respondents are surveyed multiple times per year over 3-4 years. The sample size for a given year of reported responses is approximately 12,000 beneficiaries. Data files for the MCBS are divided into two sets: the MCBS Access to Care file (detailing beneficiaries access to health care, satisfaction with care, and usual source care) and the MCBS Cost and Use file (which links Medicare claims to survey-reported events and offers complete expenditure and source of payment data on all health care services, including those not covered by Medicare). The Centers for Medicare & Medicaid Services (CMS) has administered the MCBS since 1991. Medicare Payment Advisory Commission (MedPAC) survey MedPAC’s patient survey is a nationally representative annual telephone survey of Medicare beneficiaries age 65+ and privately insured persons aged 50-64. The survey asks about a variety of health care access issues, including ability to make medical appointments and find physicians. The sample size for this survey has grown to 8,000 respondents—half Medicare beneficiaries, half privately insured individuals age 50-64. MedPAC, an independent Congressional agency, has administered this survey since 2003. National Ambulatory Medical Care Survey (NAMCS) The NAMCS is a nationally representative annual survey that examines the utilization and provision of ambulatory medical care services based on a systematic random sample of patient visits to non-federally employed office-based physicians primarily engaged in direct patient care. Data are obtained on physician practice characteristics, patient demographics, patients’ symptoms, physicians’ diagnoses, and medications ordered or provided. For 2012, the sample of eligible physicians completing the in-person or mail survey was approximately 5,000 physicians. The National Center for Health Statistics has administered the NAMCS since 1989, in addition to several other prior years. National Health Interview Survey (NHIS) The NHIS is a nationally representative, cross-sectional household interview survey that provides health status, health care access, and health service utilization information for the civilian non-institutionalized population. The annual sample size is approximately 35,000 households (approximately 87,500 persons). The NHIS is administered annually by the National Center for Health Statistics and was initiated in 1957, under a different name. Non-Government SurveysCommonwealth Fund Biennial Health Insurance Survey The Commonwealth Fund Health Insurance Survey is a nationally representative telephone survey of adults age 19 and over. It inquires about experience with and access to health care, demographic characteristics, and insurance status. The 2010 survey oversampled adults expected to have low incomes. The sample size is 4,005 adults, with 3,033 age 19-64 and 940 age 65 and older. In general, this survey has been conducted every two years since 1999, with prior surveys conducted in partnership with the Kaiser Family Foundation. This survey of Medicare beneficiaries, both nonelderly adults with disabilities and seniors, was conducted in 2008. The survey, conducted by mail and telephone, examines demographic characteristics, service use, and access to care among nonelderly and elderly Medicare beneficiaries. To identify and obtain an adequate sample of nonelderly disabled Medicare beneficiaries, the survey sample was drawn from administrative data provided by the Centers for Medicare and Medicaid Services. Responses were weighted to be nationally representative of the non-institutional beneficiary population. The total sample size is 3,913 beneficiaries, comprised of 2,288 people ages 18-64 with permanent disabilities and 1,625 age 65 and older. Health Tracking Household Survey (HTHS) The HTHS is a periodic, national household survey that collects information on changes in health care access, utilization, coverage, costs and other experiences with the health care system. It is representative of the civilian non-institutionalized population, nationwide. HTHS is conducted by Mathematica Policy Research for the Center for Studying Health System Change. The 2010 survey, conducted by telephone, included 9,200 families (approximately 17,000 individuals). HTHS was first conducted in 1996; plans for future rounds of this survey are unknown. Health Tracking Physician Survey (HTPS) The HTPS is a periodic, nationally representative survey of physicians who provide direct patient care. The survey focuses on inquiries about sources of practice revenue and compensation, practice arrangements, quality of care, patient referrals, information technology, and problems they face in practicing medicine. The 2008 survey was conducted by mail and included a sample of 4,700 physicians. Previous rounds of the survey had larger sample sizes and were administered by telephone interviews. The first HTPS survey was fielded in 2004; plans for future rounds of this survey are unknown. The Physicians Foundation Survey of America’s Physicians The Physicians Foundation Survey of America’s Physicians is an email survey sponsored by the Physicians Foundation—a nonprofit organization “founded to advance the work and development of physicians.” The survey includes topics such as professional satisfaction and morale, health system trends, career plans, and the medical practice environment. The sample size for the 2012 survey was 13,575 physician respondents. |

