Medicare Advantage Quality Bonus Payments Will Total at Least $11.8 Billion in 2024
The quality bonus program, established by the Affordable Care Act, increases Medicare payments to Medicare Advantage plans based on a five-star rating system. Plans may, but are not required to, use the additional payments to cover the cost of supplemental benefits, including reduced cost sharing, extra benefits not covered by traditional Medicare (e.g., vision, hearing and dental), and lowering Part B and/or Part D premiums. The quality bonus program is intended to help consumers make informed decisions when choosing among Medicare Advantage plans and encourage plans to compete based on quality. However, the Medicare Payment Advisory Commission (MedPAC) and others have observed that the star ratings incorporate too many measures, do not adequately account for social risk factors, and may not be a useful indicator of quality because star ratings are reported at the contract rather than the plan level.
This analysis examines trends in bonus payments to Medicare Advantage plans, enrollment in plans in bonus status (plans that qualify for a benchmark increase based on their quality star rating), and how these measures vary across plan types and firms using publicly available information on Medicare Advantage enrollment, payment rates, and quality ratings.
In 2024, more than half of eligible Medicare beneficiaries are enrolled in a Medicare Advantage plan and enrollment is projected to continue to grow throughout the next decade. At the same time, analysis by MedPAC has found that payments to Medicare Advantage plans are $83 billion (or 22%) more than spending for similar beneficiaries in traditional Medicare. As Medicare Advantage enrollment continues to climb, understanding the effects of the quality rating system and associated bonus payments, including the impact on Medicare spending and how it is distributed across different types of plans, is helpful in assessing the implications of the program. (See box at the end of the brief for more detail on Medicare Advantage payment, star ratings, and the quality bonus program.)
Key Takeaways:
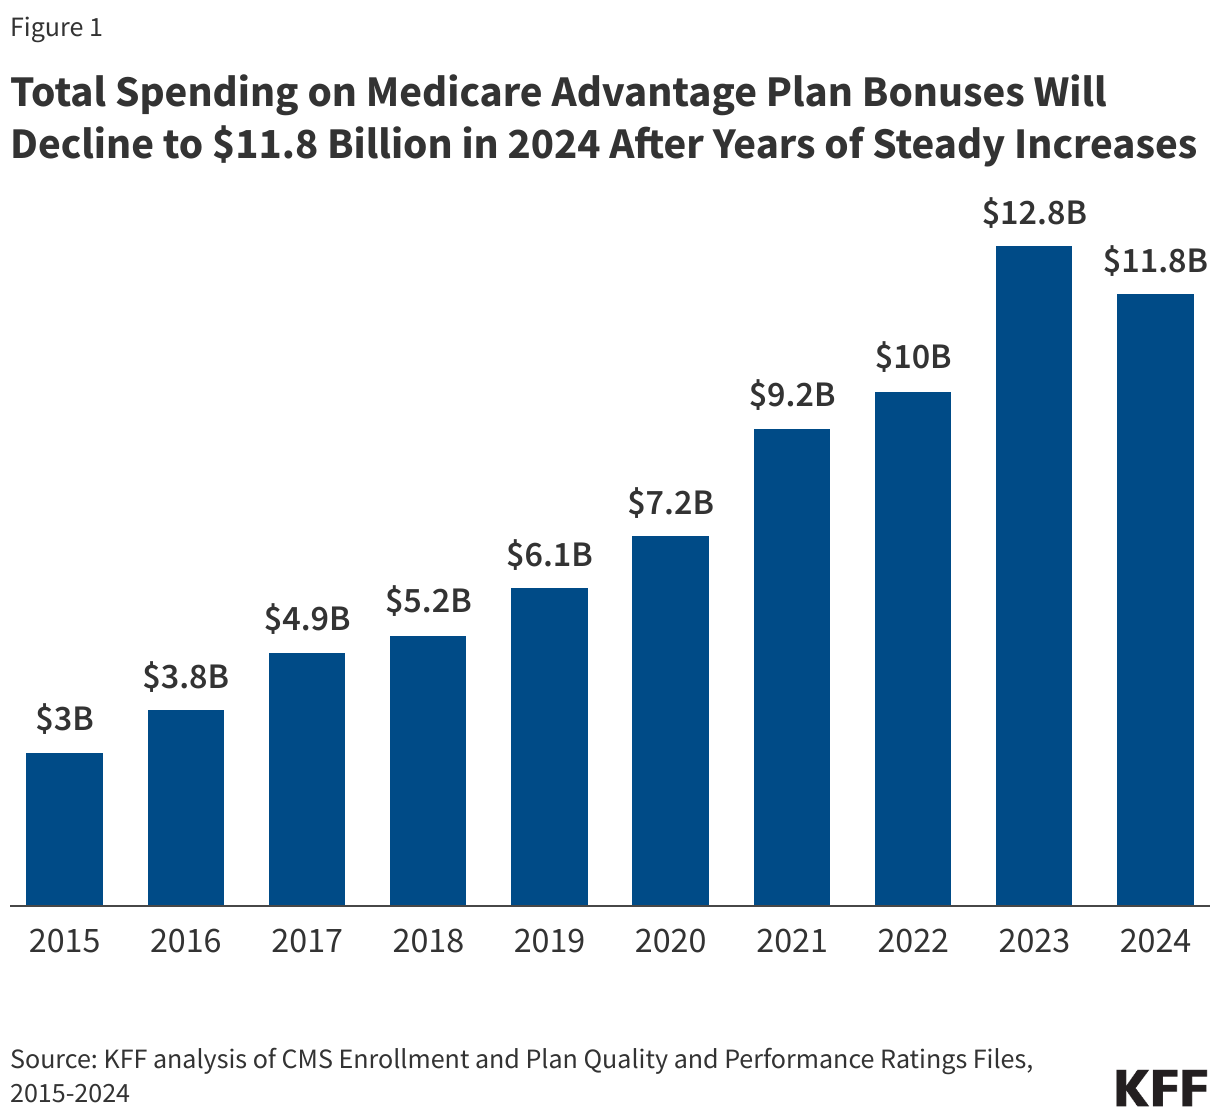
- After increasing by more than 400% between 2015 and 2023, federal spending on Medicare Advantage bonus payments will decline by $1 billion (8%) to $11.8 billion in 2024, following the expiration of pandemic-era policies that temporarily increased star ratings for some plans. Despite the decline, total spending on Medicare Advantage plan bonuses is higher in 2024 than in every year between 2015 and 2022.
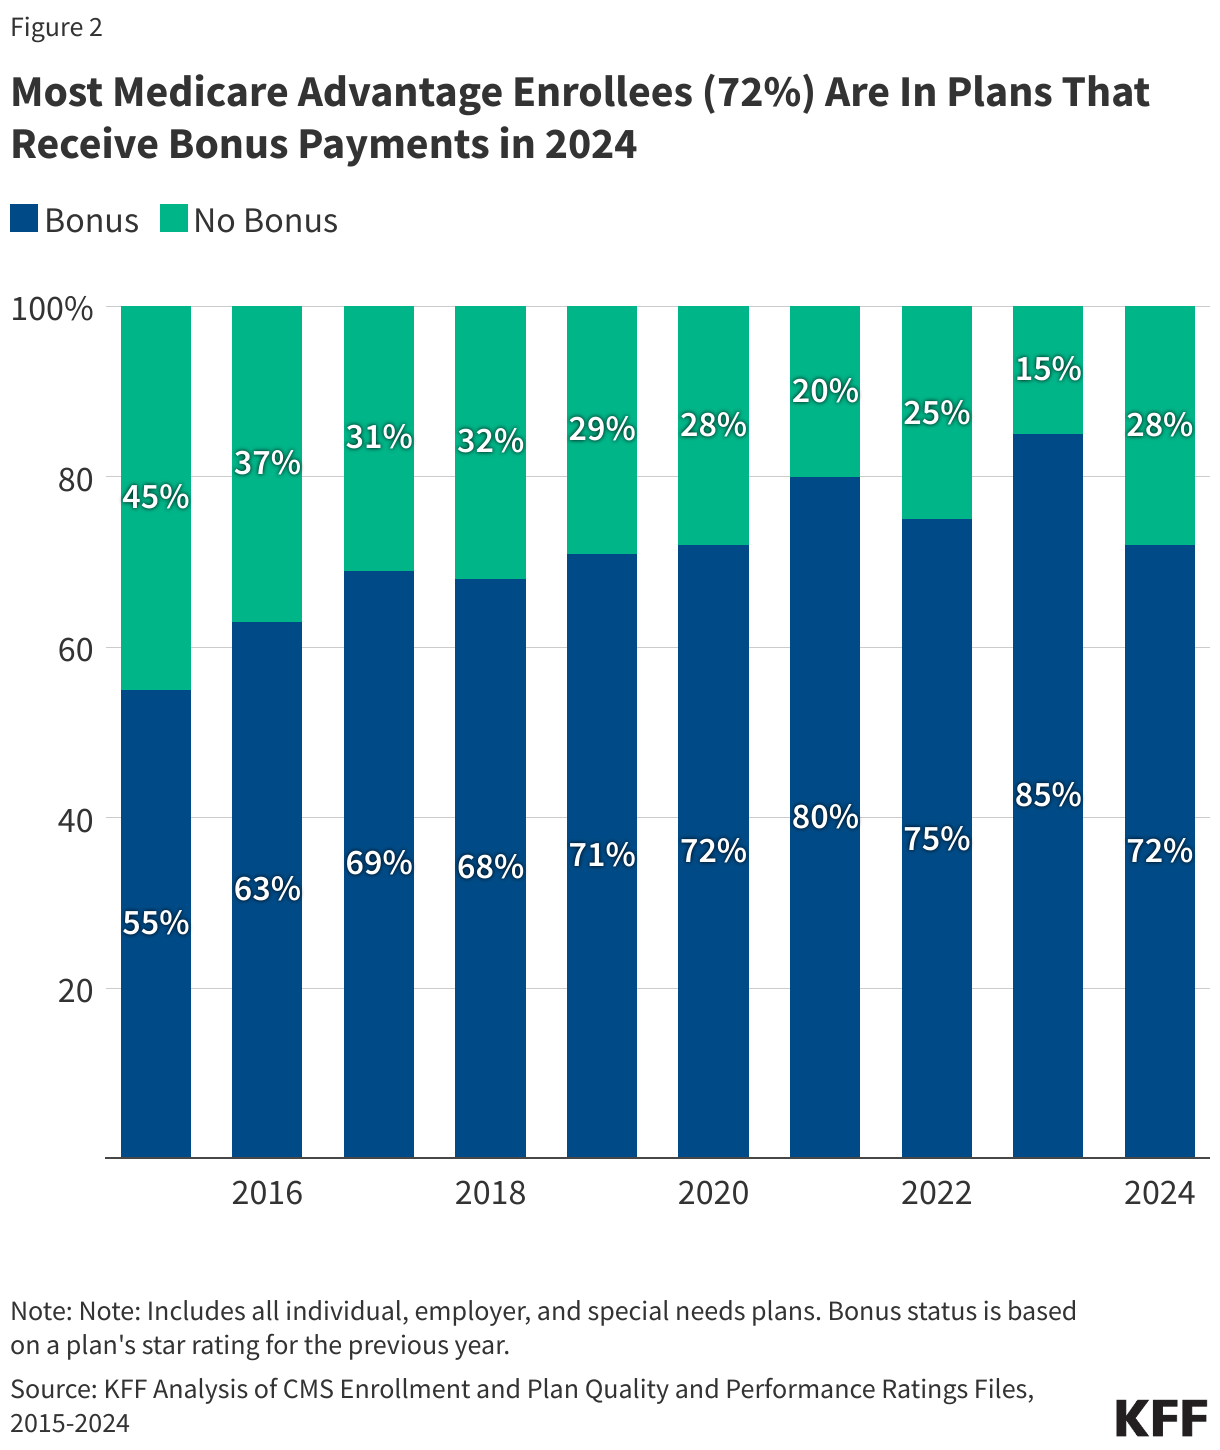
- Most Medicare Advantage enrollees (72%) are in plans that are receiving bonus payments in 2024. Though the share declined from 2023 (85%), it is similar to the share observed in 2022 (75%).
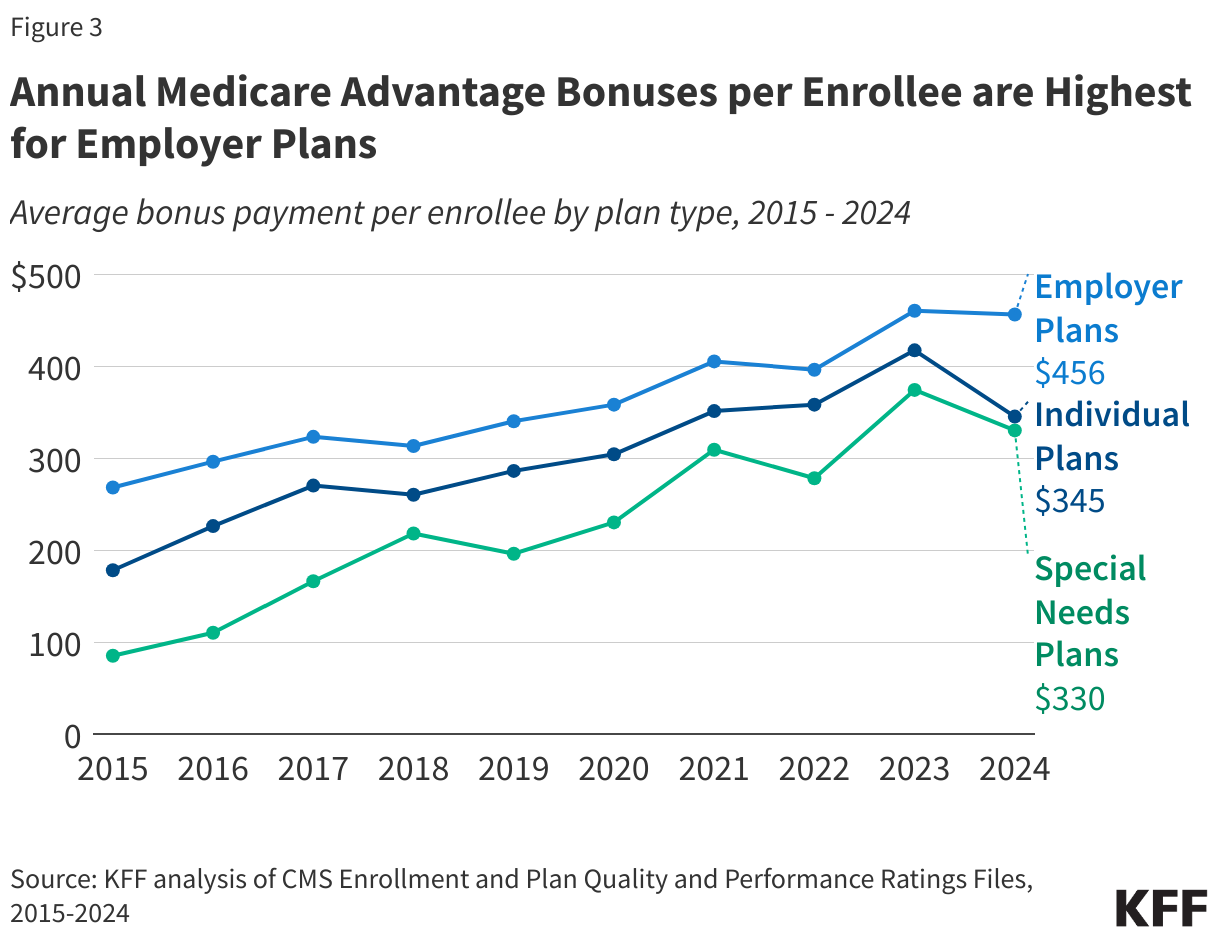
- The average bonus payment per enrollee is highest for employer- and union-sponsored Medicare Advantage plans ($456) and lowest for special needs plans ($330), raising questions about the implications of the quality bonus program for equity.
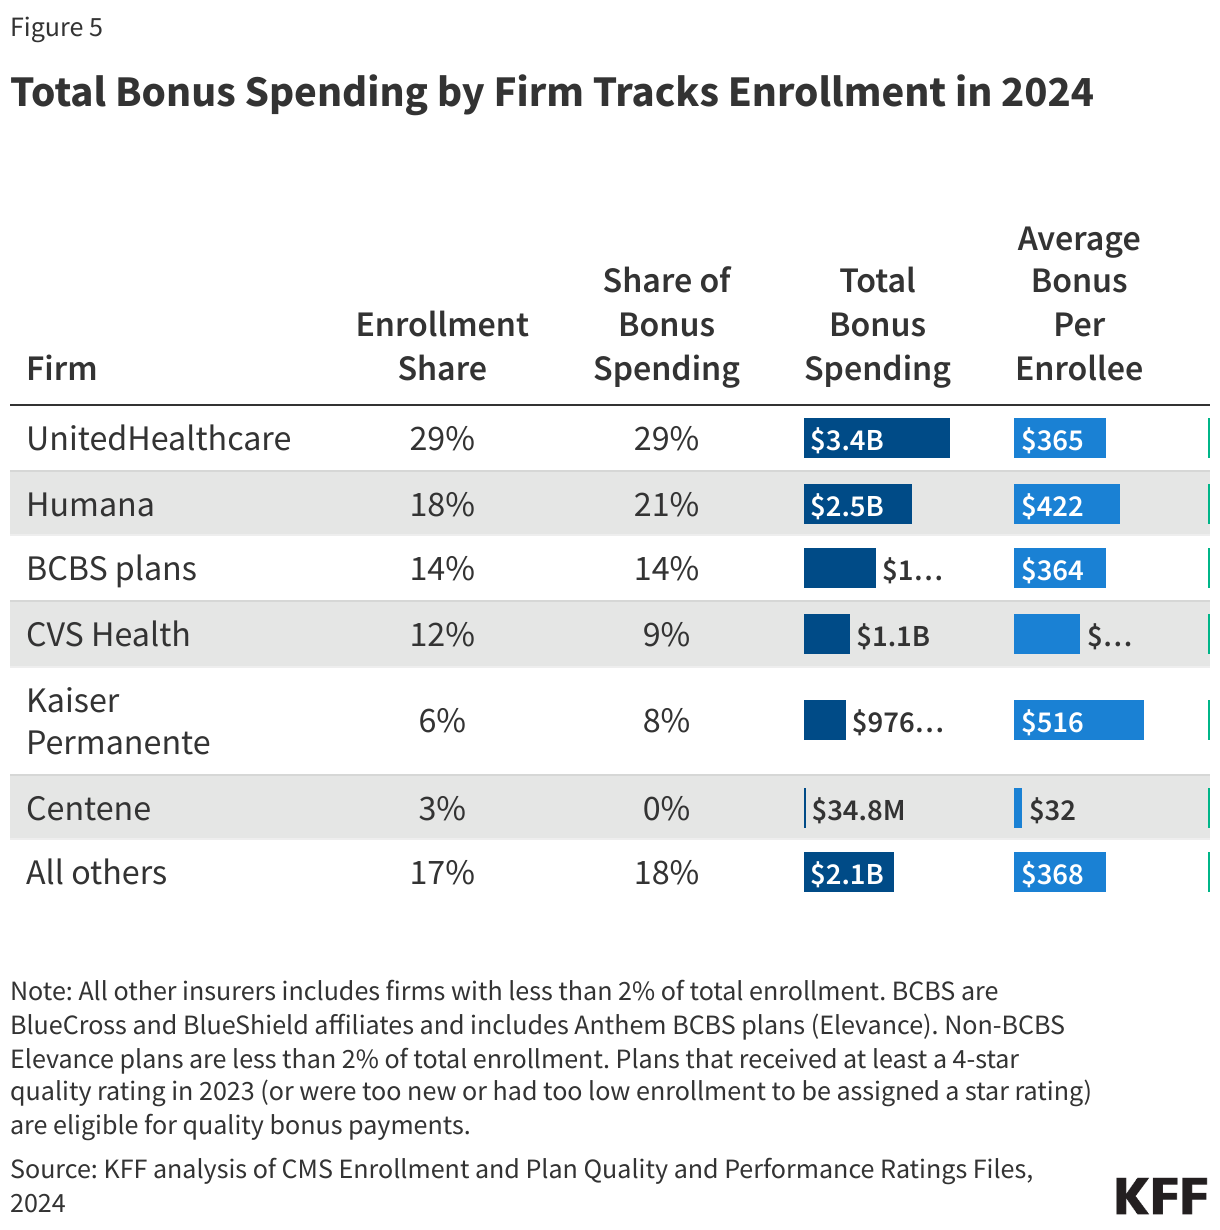
- Bonus payments vary substantially across firms, with UnitedHealthcare receiving the largest total payments ($3.4 billion) and Kaiser Permanente receiving the highest payment per enrollee ($516).
Medicare Advantage plans will receive at least $11.8 billion in bonus payments in 2024.
Estimated bonus payments to Medicare Advantage plans have increased sharply, more than quadrupling from $3.0 billion in 2015 to $12.8 billion in 2023, before declining to $11.8 billion in 2024 (Figure 1). The decrease in estimated bonus payments in 2024 follows a decline in star ratings after the expiration of COVID-19 pandemic-era policies. Those policies prevented individual measures that go into calculating the star ratings from declining between 2021 and 2022 and temporarily increased star ratings for certain plans. Despite the decline, total spending on Medicare Advantage plan bonuses is higher in 2024 than in every year between 2015 and 2022. The total spending on the quality bonus program is less than 3% of the projected payments to Medicare Advantage plans in 2024 ($462 billion).
Medicare spending on bonus payments has grown faster than enrollment in Medicare Advantage, which doubled between 2015 and 2024 (rising from 16 million people to 33 million people). This spending comes at a time when the Medicare program is facing growing fiscal pressures. Medicare Advantage benchmarks (and corresponding spending) have grown faster than traditional Medicare spending in part because of the increase in bonus payments.
These estimates are a lower bound because bonus payments are risk adjusted, which is likely to increase bonus payments. The estimates also do not include additional spending that results if plans increase their bids when their benchmark is higher because of being in bonus status. For example, a plan might increase its bid to increase payments to providers, add more expensive providers to its network, or retain a larger amount as profit, provided they meet medical loss ratio requirements.
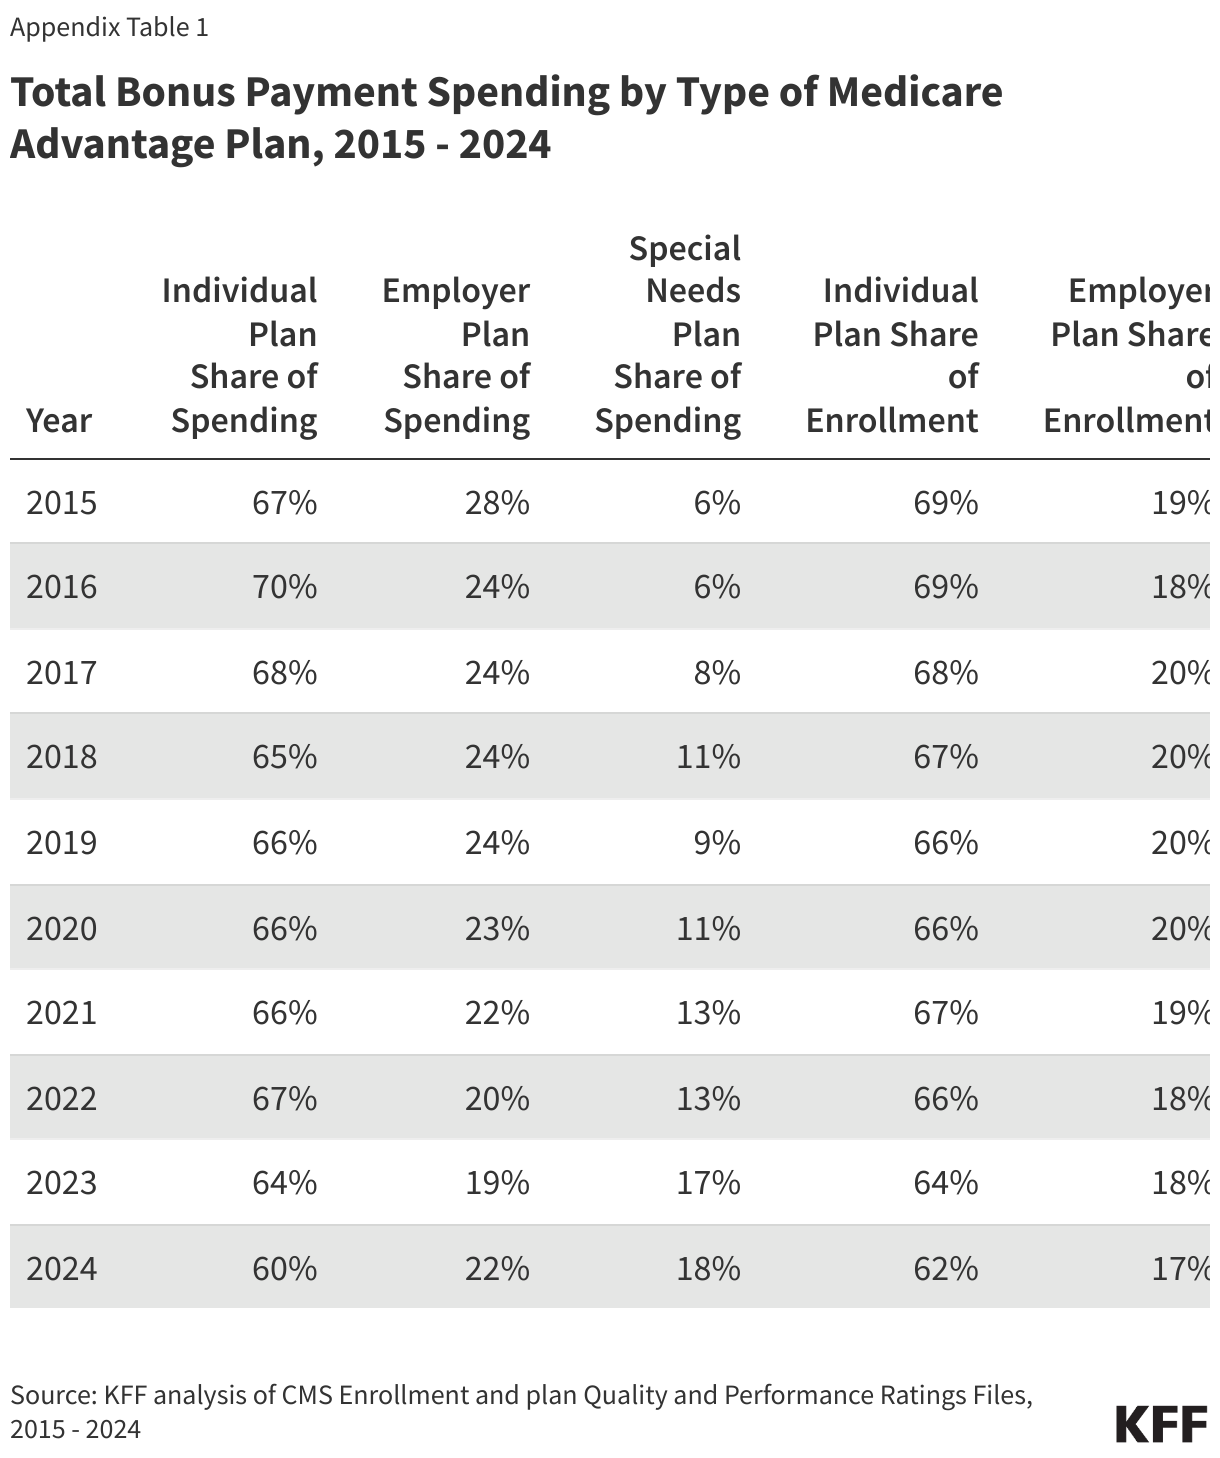
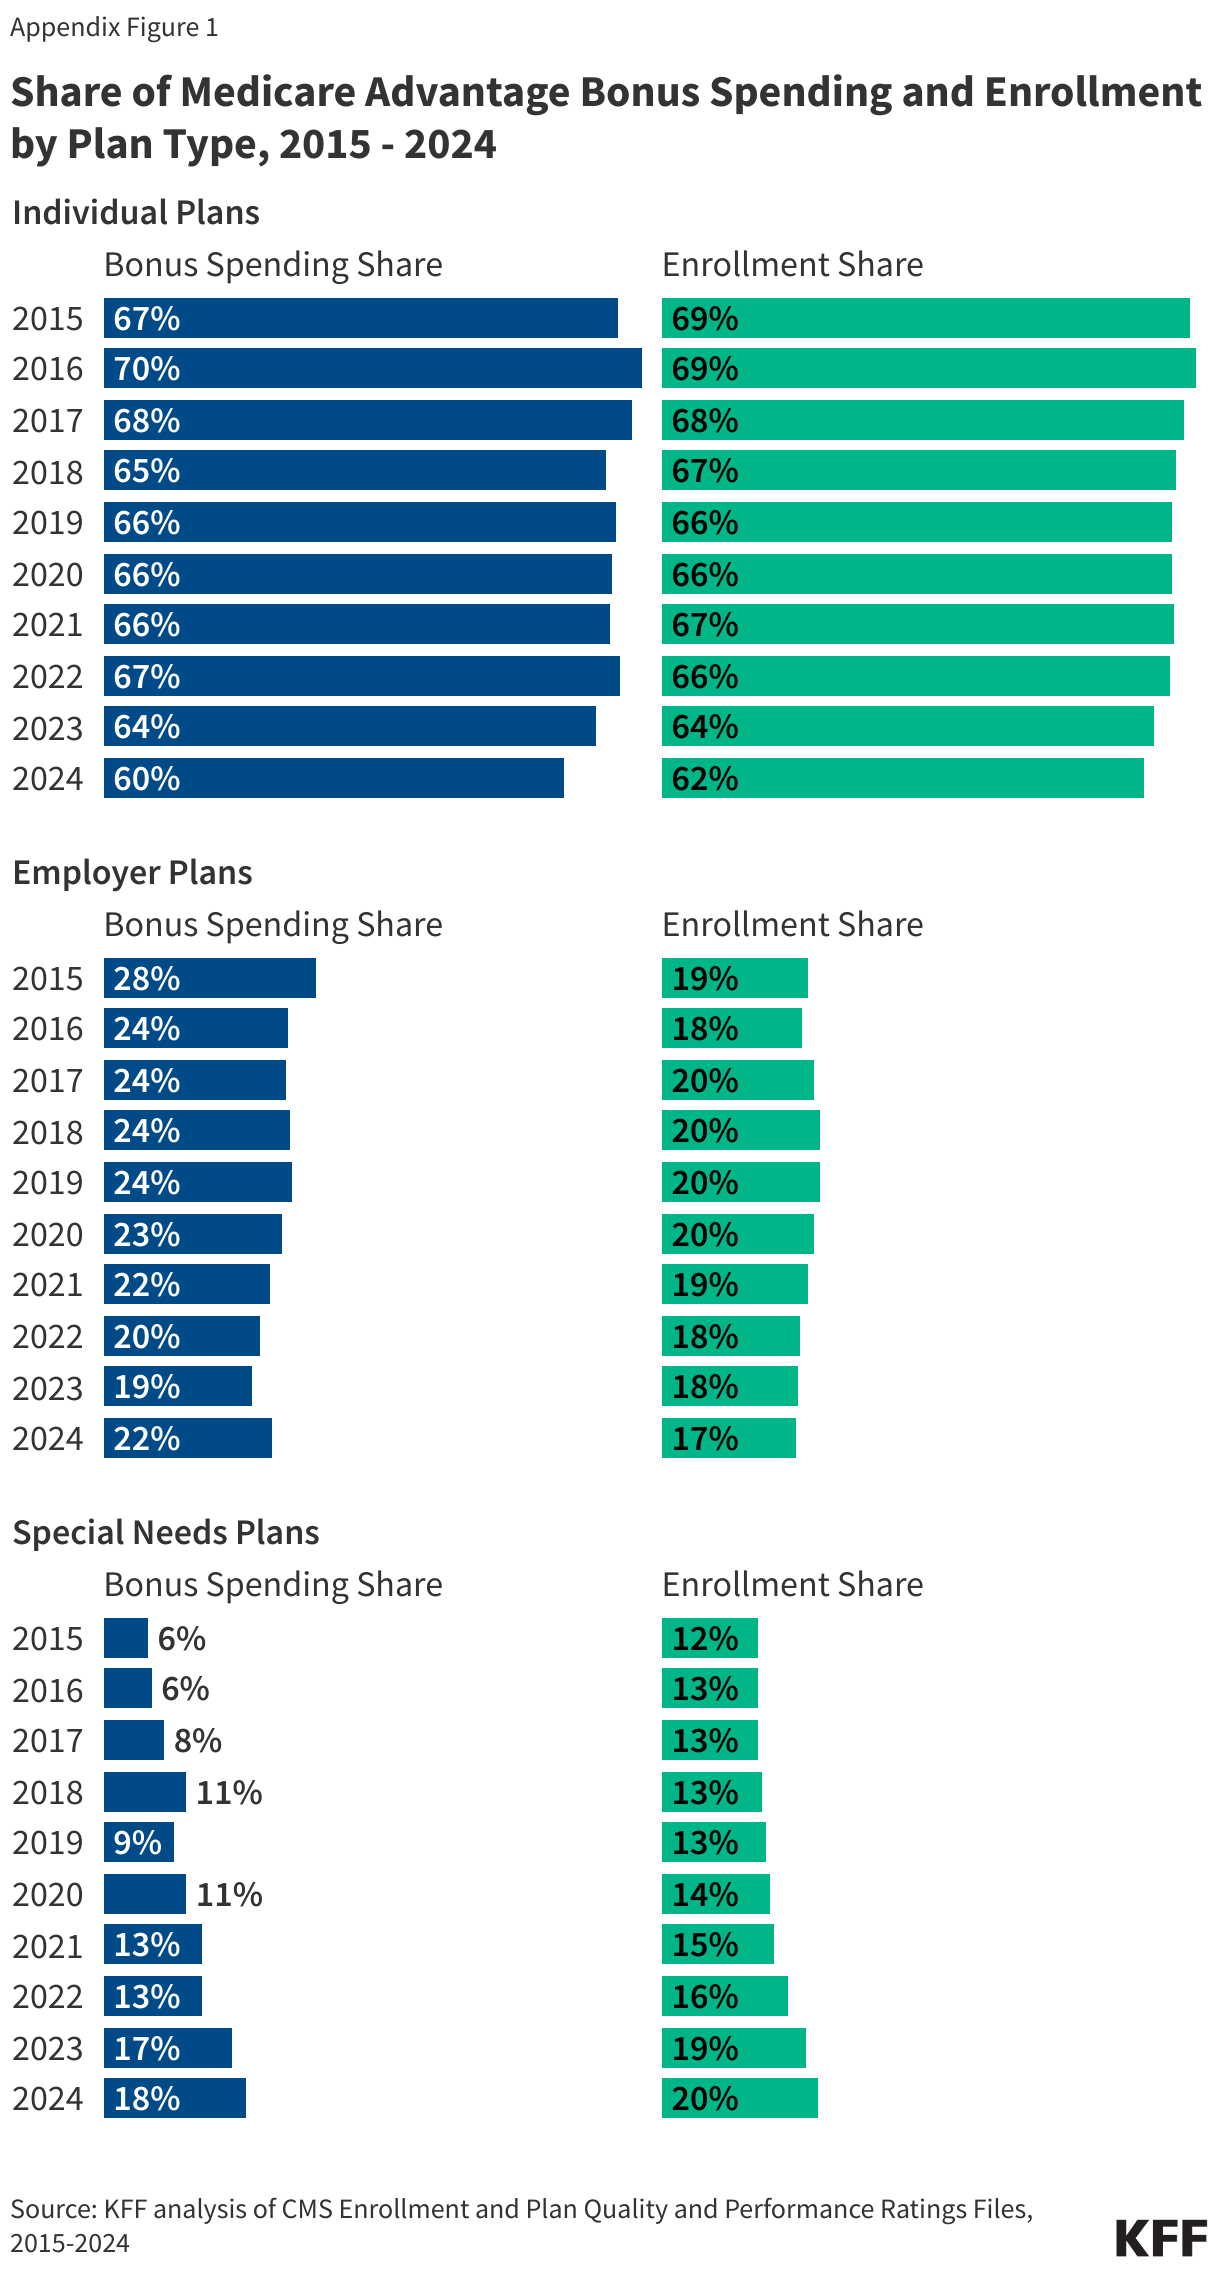
The distribution of bonus spending across plan types is similar to the distribution of enrollment in 2024, though employer plans comprise a slightly larger share of bonus spending than enrollment. Individual plans account for 60% ($7.1 billion) of bonus spending and 62% of enrollment, employer plans account for 22% ($2.6 billion) of bonus spending and 17% of enrollment, and special needs plans account for 18% ($2.2 billion) of bonus spending and 20% of enrollment in 2024 (Appendix Table 1 and Appendix Figure 1).
Most Medicare Advantage enrollees (72%) are in plans that receive bonus payments.
In 2024, 24 million people, or 72% of Medicare Advantage enrollees, are in plans that receive bonuses. That compares to just under 9 million people (55%) in 2015 (Figure 2). The share of enrollees in plans that receive bonus payments in 2024 is smaller than the previous year (85%), which was the highest since the current iteration of the program has been in place but is similar to the share in 2022 (75%). Payments in 2023 were relatively high due to the lagged impact of star ratings (i.e., 2023 payments were based on 2022 star ratings), and the recent expiration of several policies in place during the COVID-19 Public Health Emergency which temporarily boosted star ratings for some plans. Note that the recent recalculation of the 2024 star ratings following successful court challenges will impact plan year 2025 payments, raising payments above what they otherwise would have been next year for plans that will qualify for the quality bonus program as a result of the change (i.e., they moved from a 3.5 to 4 star rating).
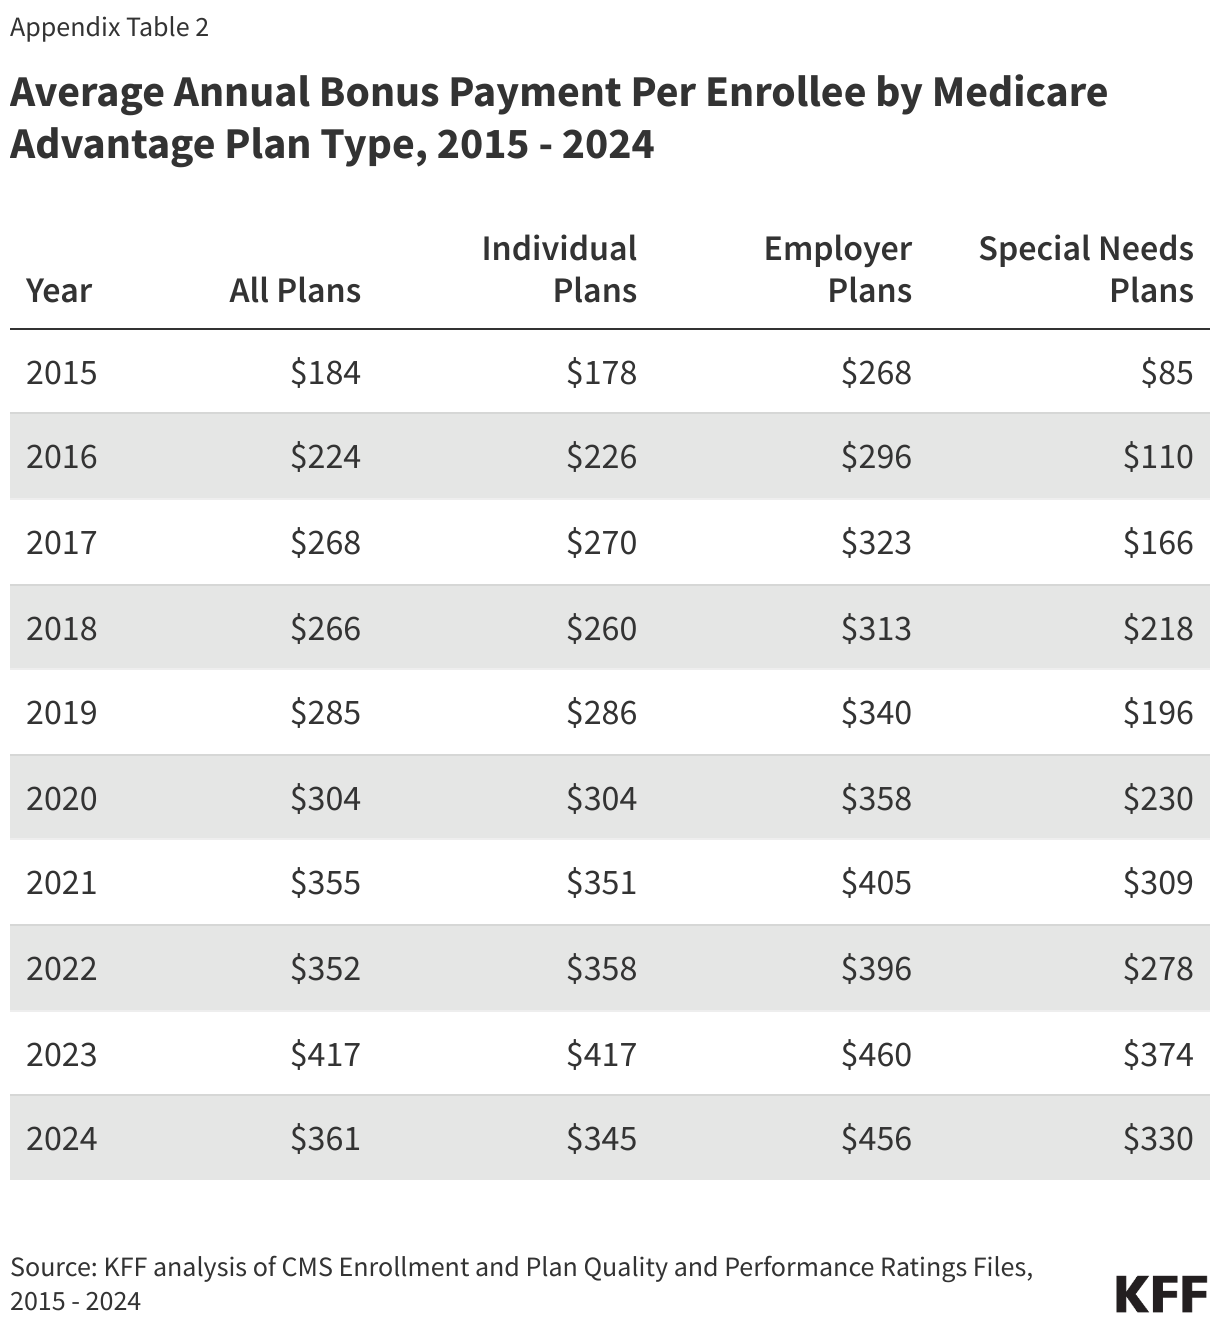
Average annual bonus payments are highest for enrollees in employer- and union-sponsored plans.
The average annual bonus per Medicare Advantage enrollee has also increased over time, rising from $184 in 2015 to $417 in 2023, before declining to $361 in 2024 (Appendix Table 2). Average bonuses in group employer- and union-sponsored plans have consistently been higher than for other plans. The average bonus per enrollee in a group employer- or union-sponsored Medicare Advantage plan is $456 in 2024, compared to $345 for individual plans and $330 for special needs plans (SNPs) (Figure 3).
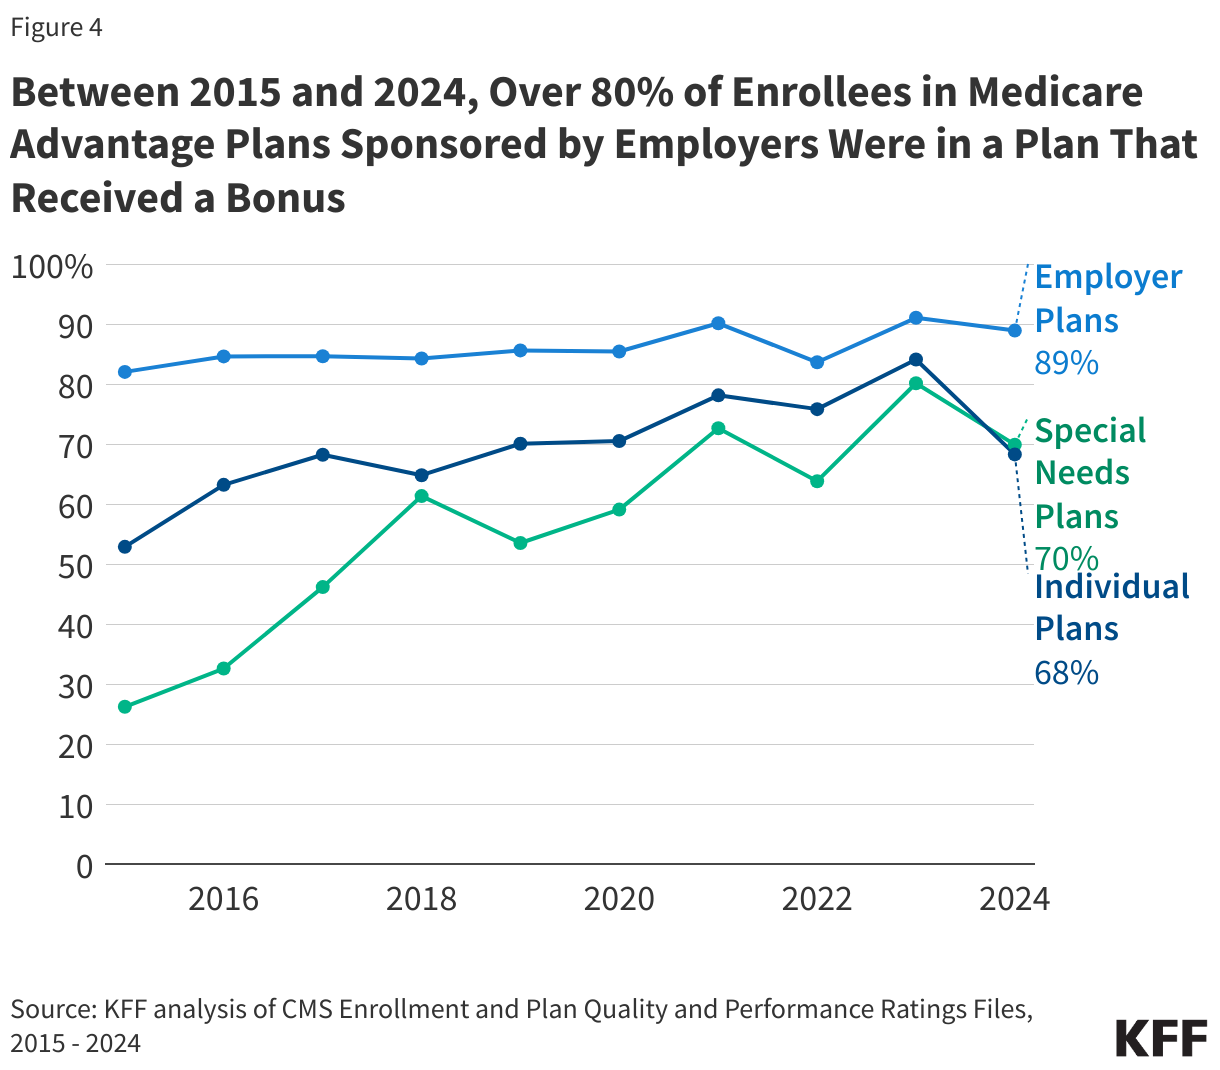
Bonuses are higher per enrollee in employer plans because these plans have higher average star ratings, resulting in a larger share of enrollees receiving coverage from plans that qualify for bonuses. Across the entire period of 2015 to 2024, the share of all enrollees in employer- or union-sponsored plans that received a bonus never went below 80%. In contrast, at least 80% of enrollees in individual and special needs plans were in a plan that received a bonus in only one year – 2023 (Figure 4).
Relatively low bonus payments for special needs plans, which enroll higher need and more vulnerable beneficiaries, as well as a larger share of Black and Hispanic beneficiaries, and higher bonus payments for employer plans that tend to provide retiree health benefits to higher income beneficiaries, raise questions about the implications of the quality bonus program for equity.
Bonus payments by firm largely tracks the distribution of Medicare Advantage enrollment.
UnitedHealthcare and Humana, which together account for 47% of Medicare Advantage enrollment, are expected to receive 50% of total bonus payments in 2024, or $3.4 billion dollars for UnitedHealth and $2.5 billion dollars for Humana (Figure 5). BCBS affiliates (including Anthem BCBS) and CVS Health will receive $1.7 and $1.1 billion in bonus payments, respectively, followed by Kaiser Permanente ($976.4 million), and Centene ($34.8 million).
The average bonus per enrollee ranges from $32 for people in Centene plans to $516 for those in Kaiser Permanente plans. The variation in total bonus payments across firms corresponds to differences in the share of enrollees in plans that receive bonuses, which is based on the ratings of those plans. Virtually all enrollees in a Kaiser Permanente plan (99%) are in a plan that receives bonus payments because it has a quality rating of at least four stars, while just 8% of Centene enrollees are in a plan that receives bonus payments in 2024. Centene has only one Medicare Advantage contract that qualifies for the quality bonus program based on having a star rating of at least 4 stars.
Box 1. Medicare Advantage Star Ratings
A key feature of the quality bonus program is the star rating system. Star ratings are used to determine two parts of a Medicare Advantage plan’s payment: (1) whether the plan is eligible for a bonus, and (2) the portion of the difference between the benchmark and the plan’s bid that is paid to the plan. The benchmark is the maximum amount the federal government will pay for a Medicare Advantage enrollee and is a percentage of estimated spending in traditional Medicare in the same county, ranging from 95 percent in high-cost counties to 115 percent is low-cost counties. The bid is the plan’s estimated cost for providing services covered under Medicare Parts A and B.
Since 2015, plans that receive at least four (out of five) stars have their benchmark increased. For most plans in bonus status, the benchmark is increased by five percentage points. Plans in “double bonus” counties – defined as urban counties with low traditional Medicare spending and historically high Medicare Advantage enrollment—have their benchmark increased by 10 percentage points. In addition, the benchmarks for plans without ratings due to low enrollment or being too new are increased by 3.5 percentage points. The benchmarks are capped and cannot be higher than they would have been prior to the ACA. This can result in plans that are eligible under the quality bonus program receiving a smaller increase to their benchmark, or in some cases, no increase at all.
This work was supported in part by Arnold Ventures. KFF maintains full editorial control over all of its policy analysis, polling, and journalism activities.
Methods |
| This analysis uses data from the Centers for Medicare & Medicaid Services (CMS) Medicare Advantage Enrollment, Crosswalk and Landscape files for the respective year.
This analysis includes HMO, POS, local PPO, regional PPO, and PFFS plans. Enrollment counts in publications by firms operating in the Medicare Advantage market, such as company financial statements, might differ from KFF estimates due to inclusion or exclusion of certain plan types, such as SNPs or employer plans. To calculate federal spending on quality bonus program payments we first obtained information on star ratings from the Part C and Part D Performance Data, Star Ratings Data Table for the previous plan year. These are the ratings on which a plan’s benchmark is based. We then determined each plan’s benchmark using these data and information from the Medicare Advantage Rate Book, Rate Calculation Data, which provides the benchmark by county for plans with a 5%, 3.5% and 0% bonus. A plan’s bonus payment per enrollee is equal to the difference between its quality adjusted benchmark (either the 5% or 3.5% bonus rate) and the benchmark if the plan was not in bonus (0% bonus rate), multiplied by the relevant percentage based on its star rating and year (for example, 65% for plans with 4 stars and 70% for plans with at least 4.5 stars in 2024). The bonus per enrollee is multiplied by enrollees in March of each year to get total spending. Actual bonus payments will depend on the risk scores of Medicare Advantage enrollees. According to the plan payment data release by CMS, the average risk score of MA enrollees was above 1 for every year from 2015 through 2021 (the most recent year for which data are available), meaning our estimates likely understate actual spending. |