Payment Rates for Medicaid Home Care in 2026
Key Questions
Long-standing workforce challenges in Medicaid home care, also known as home- and community-based services (HCBS), affect care for the more than 5 million people who use these services. Shortages and high turnover rates among the direct care workforce reflect demanding work and low wages, particularly among home care workers (who are direct care workers that provide HCBS). This issue brief describes states’ ongoing efforts to respond to shortages of home care workers and how they pay these workers, finding that increased payment rates are a key component of states’ efforts to address workforce shortages.
Workforce shortages may worsen in future years because of a decreasing pool of available workers on account of changes in immigration policy, changes in federal policy from the 2025 reconciliation law, and new pressure on states to cut Medicaid spending. Nearly one in three home care workers are immigrants, and the Trump Administration’s intensified immigration enforcement and restrictive policies are deepening anxiety and fear among immigrants of all statuses, with survey data finding that some immigrants are avoiding work on account of those changes. States may also face pressure to reduce Medicaid spending as state fiscal conditions tighten because of slower revenue growth, increased spending pressures, and substantial reductions in federal Medicaid spending from the 2025 reconciliation law.
However, states’ goals to reduce Medicaid spending may be at odds with new administrative requirements that potentially limit states’ abilities to reduce payment rates for home care workers. During a public webinar that the Centers for Medicare and Medicaid Services (CMS) hosted to share more information on payment transparency requirements in the 2024 Access Rule (see Appendix Box 1 for more details), CMS noted that proposed rate reductions for home care workers might not be approved if they would cause more than a four percent decrease in Medicaid expenditures for any service category. CMS did not specify the rationale for this condition, though it could be to maintain access to services. Changes in federal policy surrounding program integrity, including issues related to provider revalidation, could also further strain the home care workforce.
Amidst this evolving landscape, this issue brief describes Medicaid payment rates for home care and other workforce supports that are in place in 2026, and how KFF’s data on payment rates compare to the data states are now required to report under payment reporting requirements in the Medicaid Access rule. The data come from the 24th KFF survey of officials administering Medicaid home care programs in all 50 states and the District of Columbia (hereafter referred to as a state), which states completed between April and August 2026. The survey was sent to each state official responsible for overseeing home care benefits (including home health, personal care, and waiver services for specific populations, such as people with physical disabilities). All states except Florida and South Carolina responded to the 2026 survey, but response rates for certain questions were lower. South Carolina’s payment rate data from the 2025 survey was also included with their permission to provide a more comprehensive national picture of payment rates to Medicaid home care providers.
Key takeaways include:
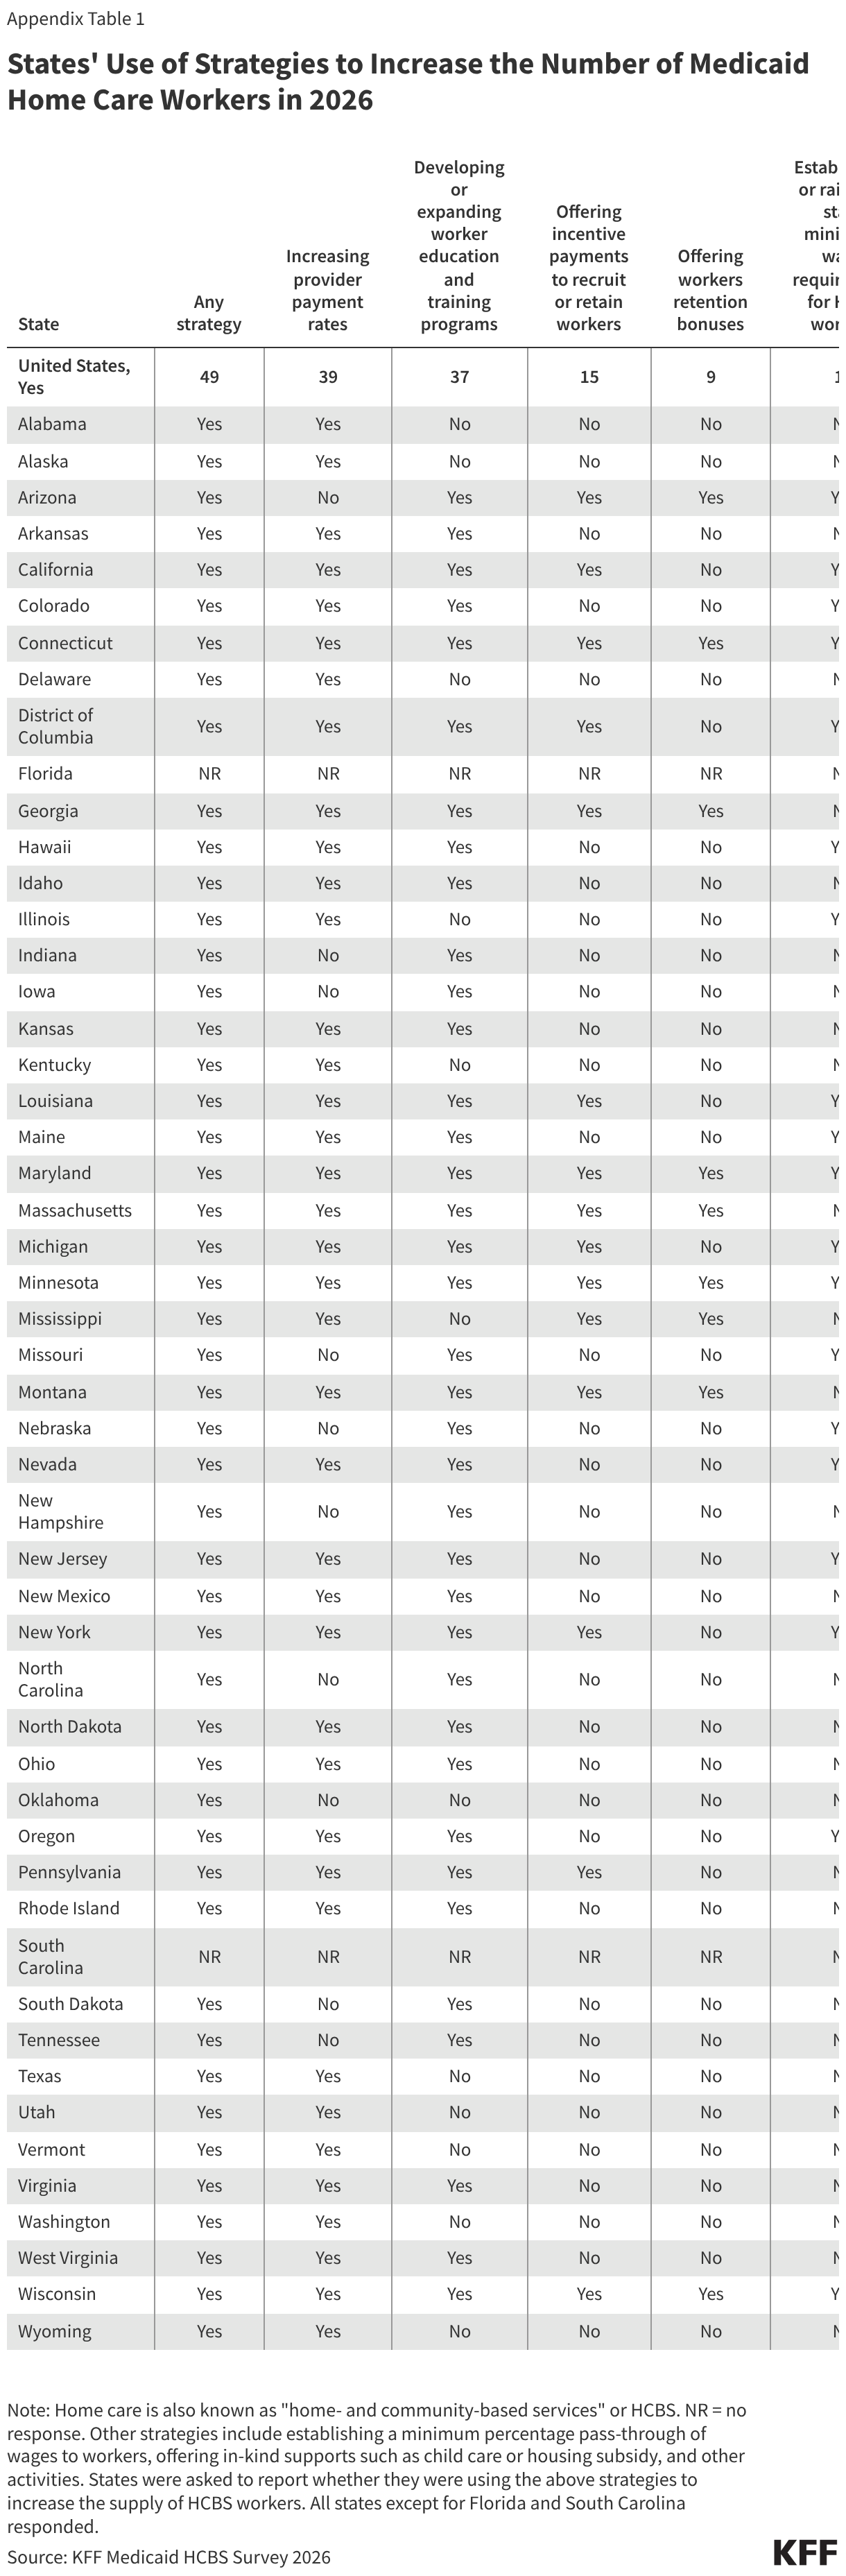
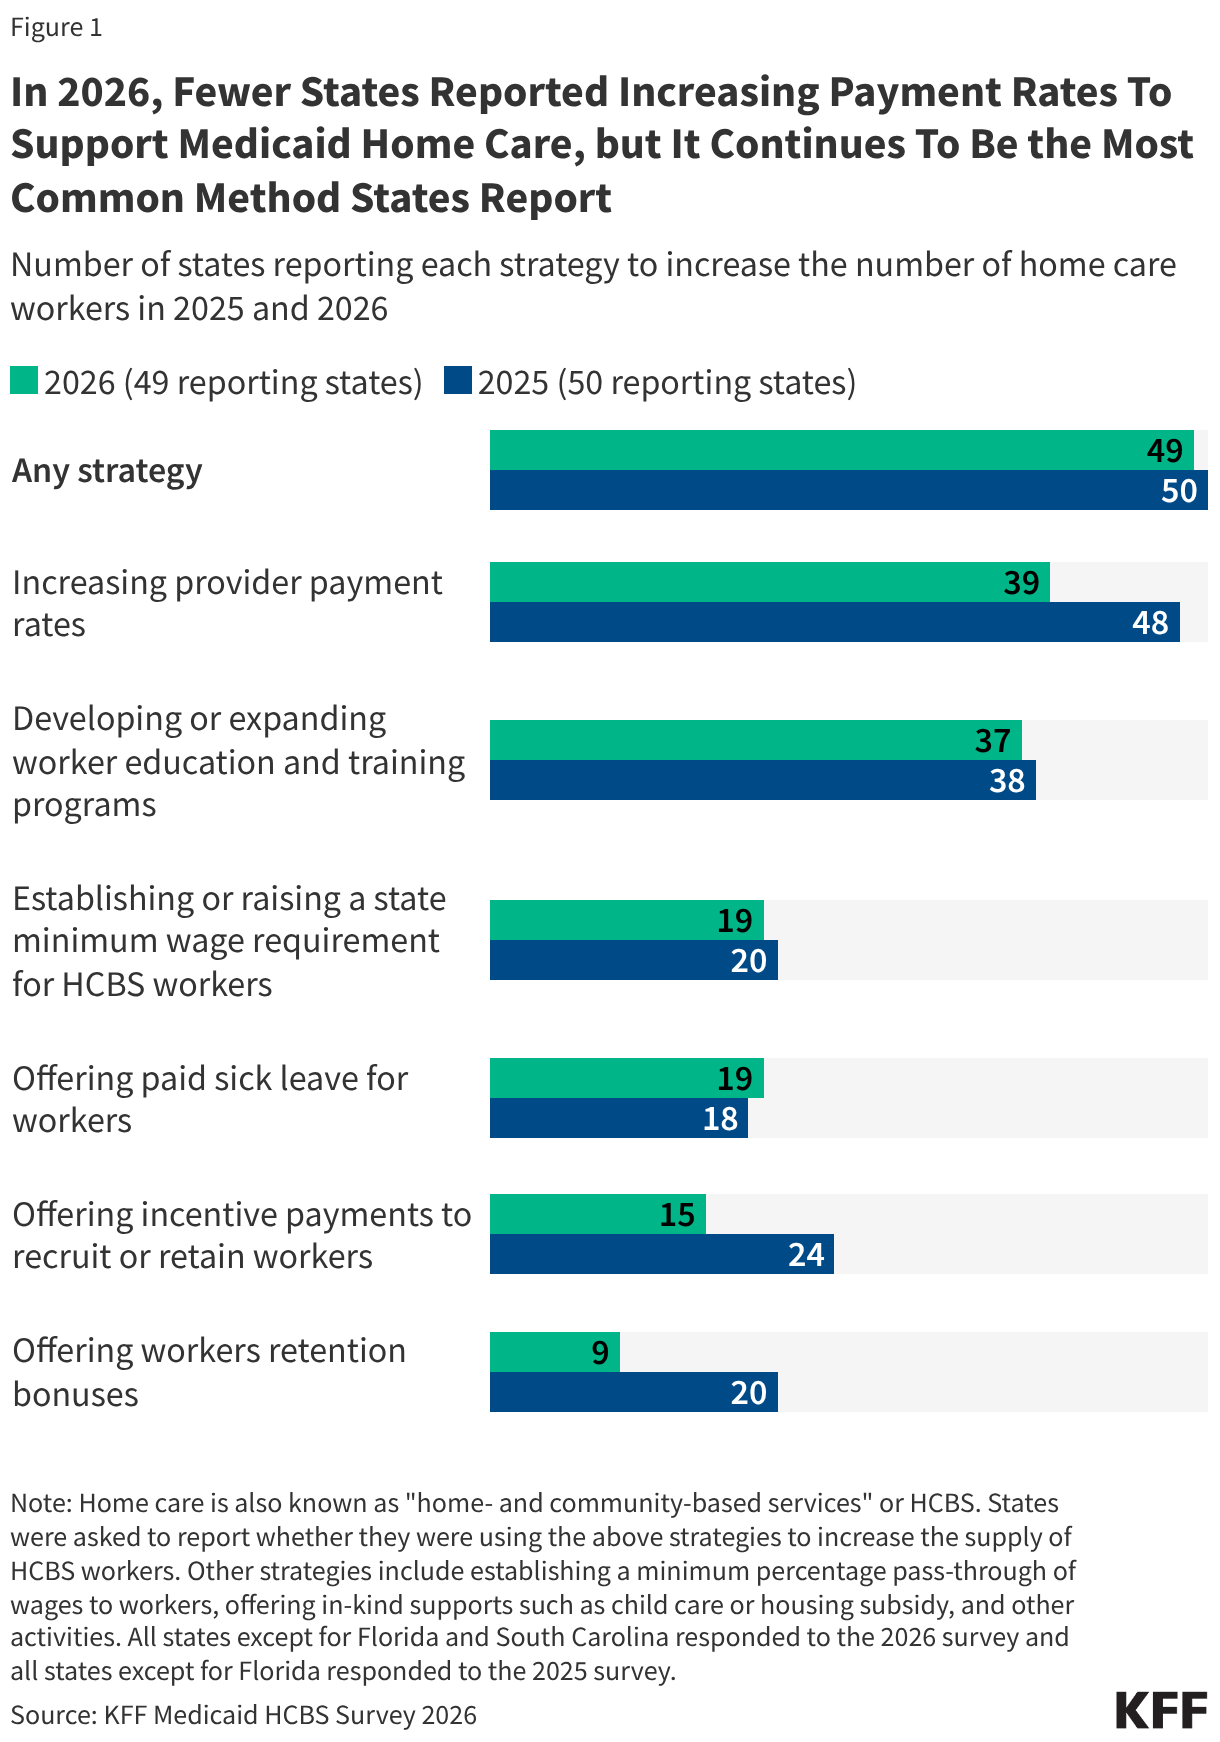
- All responding states reported taking actions to address workforce shortages, though fewer states reported increasing provider compensation when compared with 2025 (Figure 1).
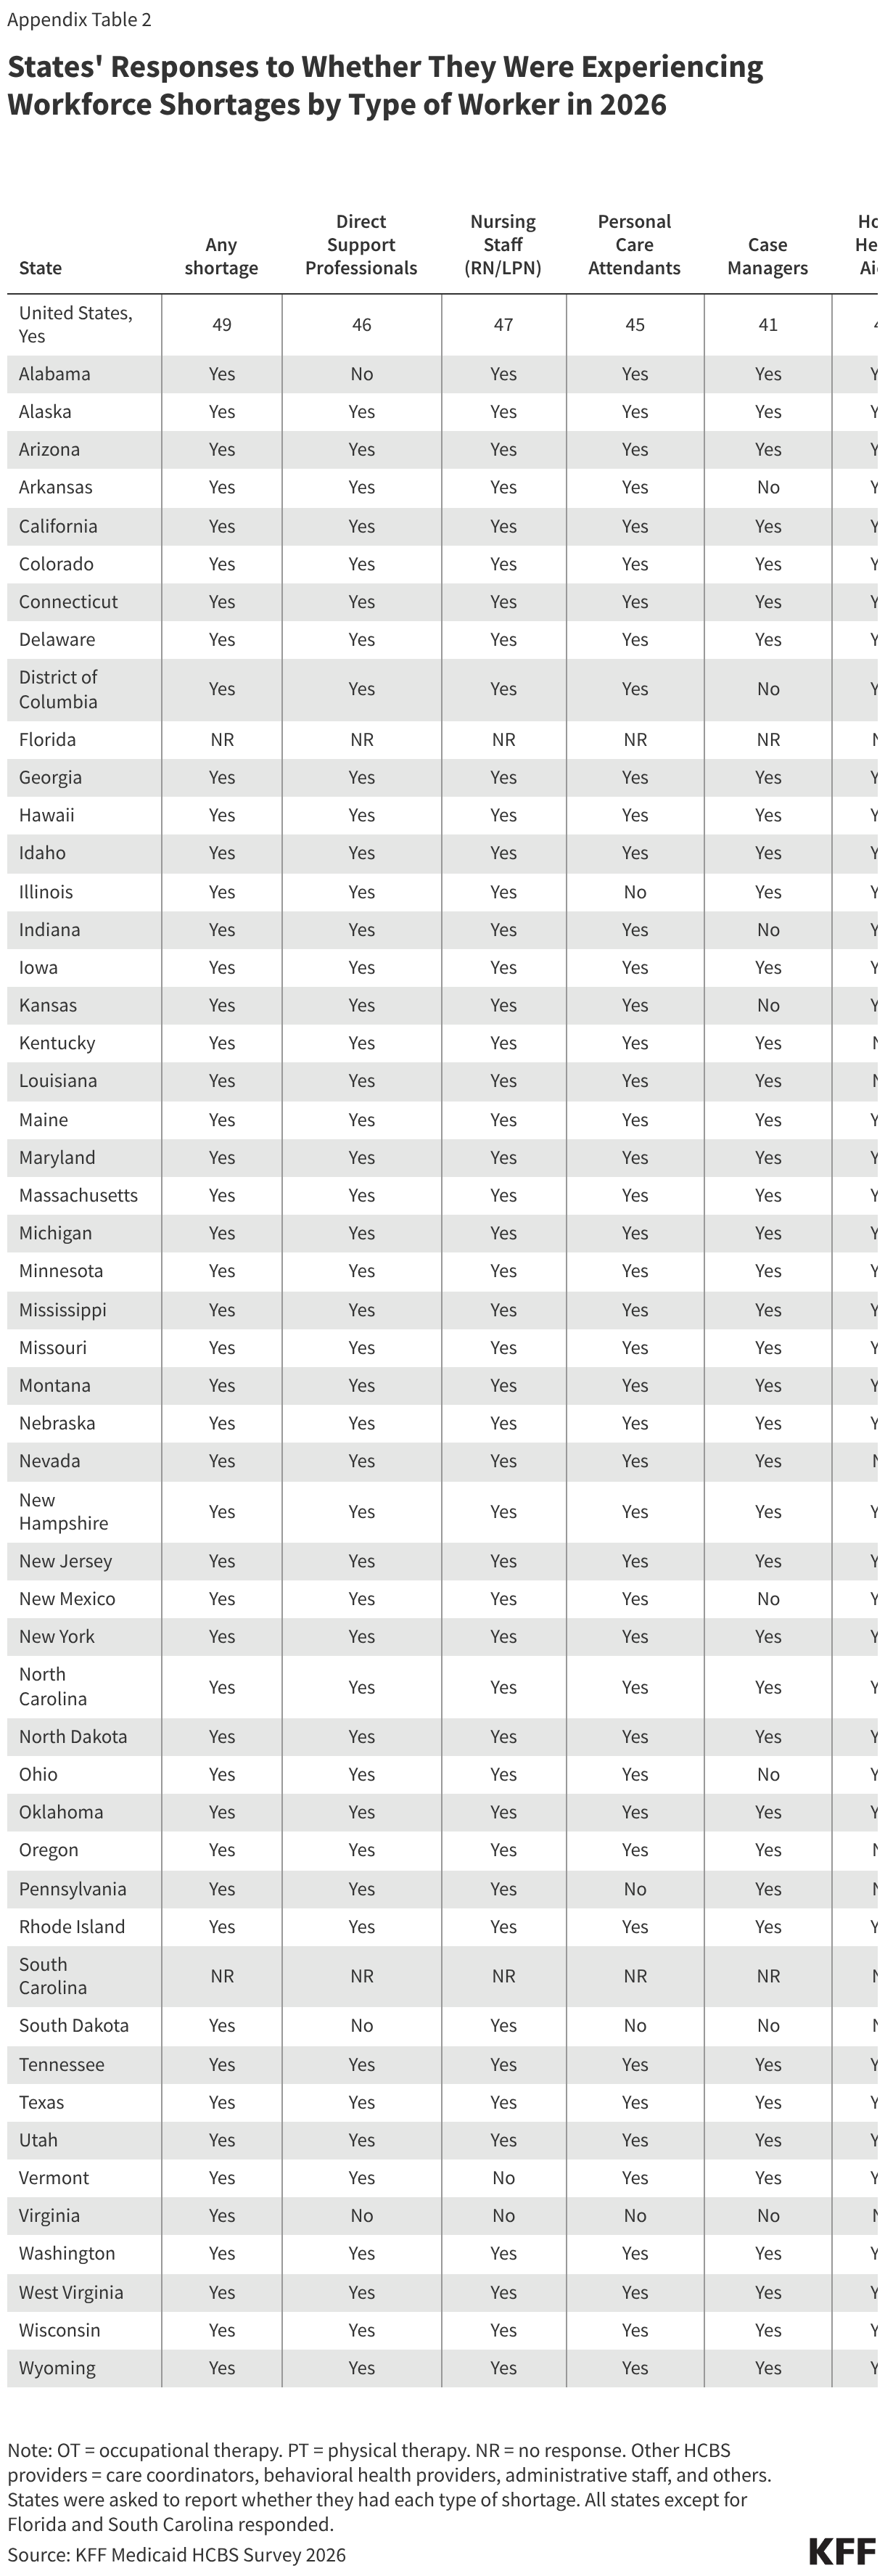
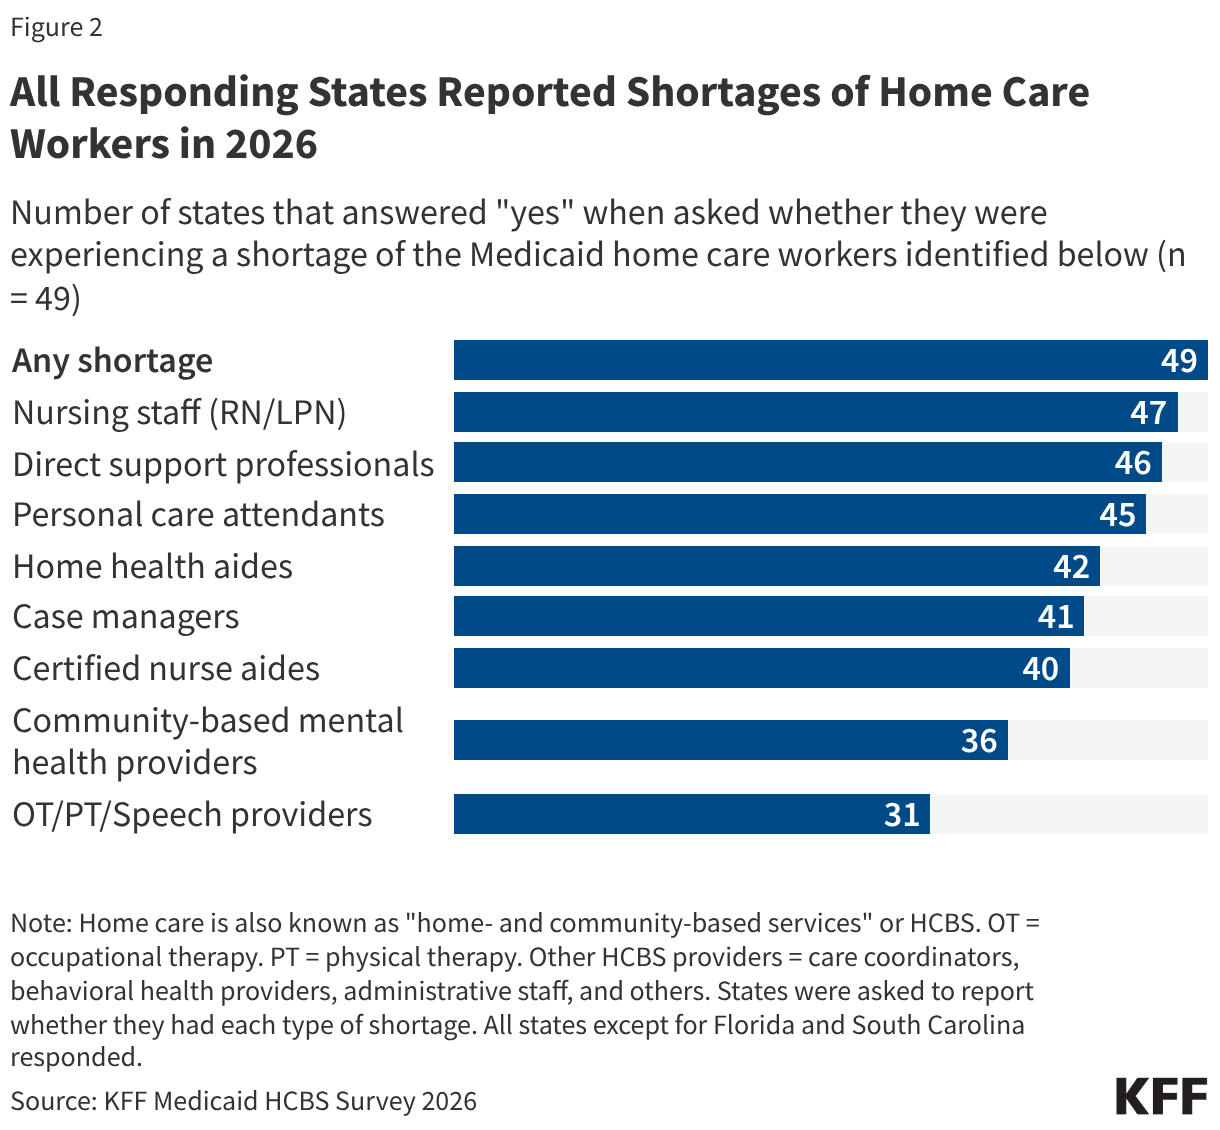
- All responding states reported shortages of home care workers, most frequently among nursing staff, direct support professionals, personal care attendants, home health aides, and case managers (Figure 2).
- States reported that high turnover, low wages, and increased demand for home care were the most common factors contributing to increasing workforce shortages.
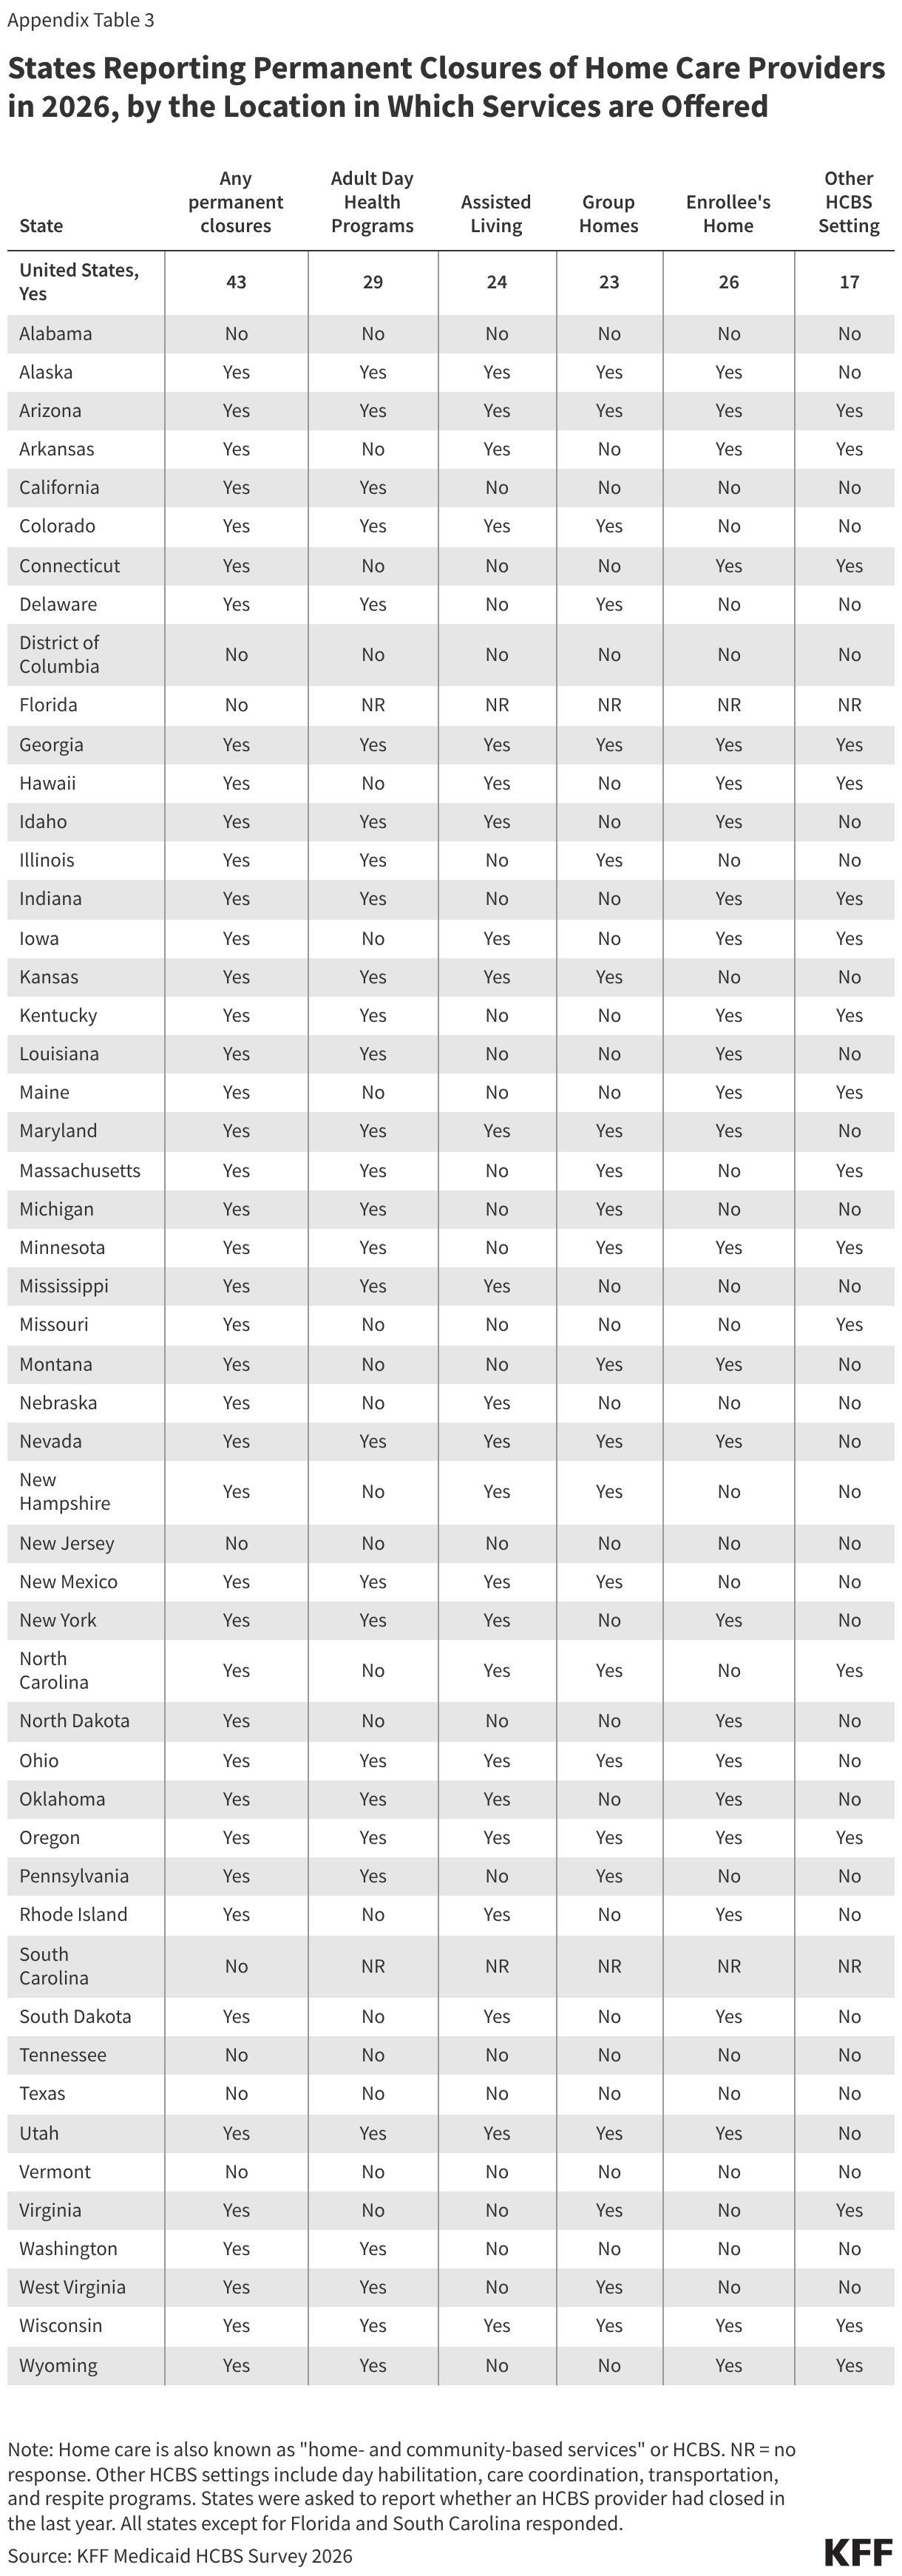
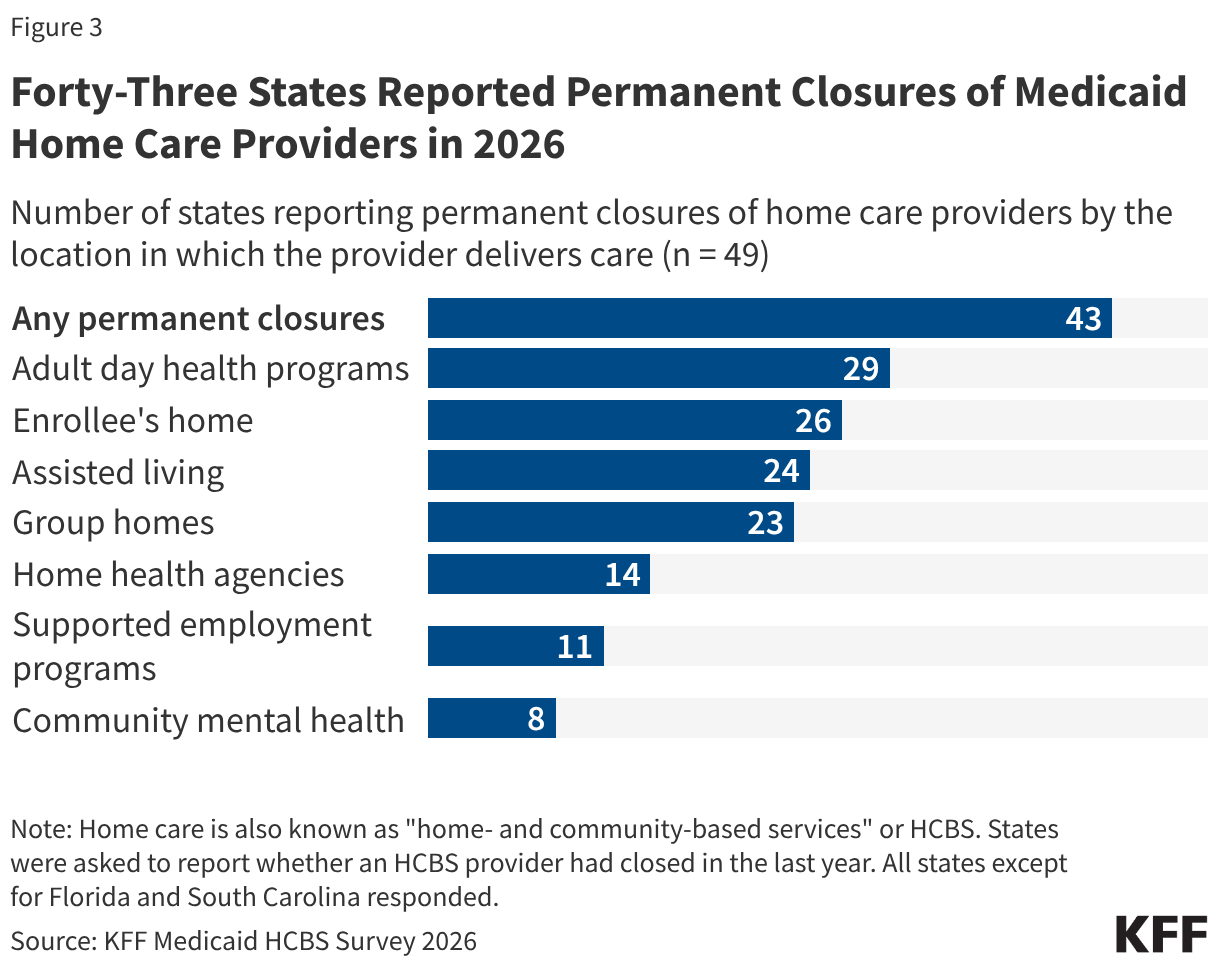
- Most (43) states reported permanent closures of home care providers within the last year (Figure 3).
- States are now reporting detailed payment rates for home care online, but the data are difficult to compare across states. In contrast, KFF data represent statewide average payment rates, which are less detailed but facilitate comparisons across states.
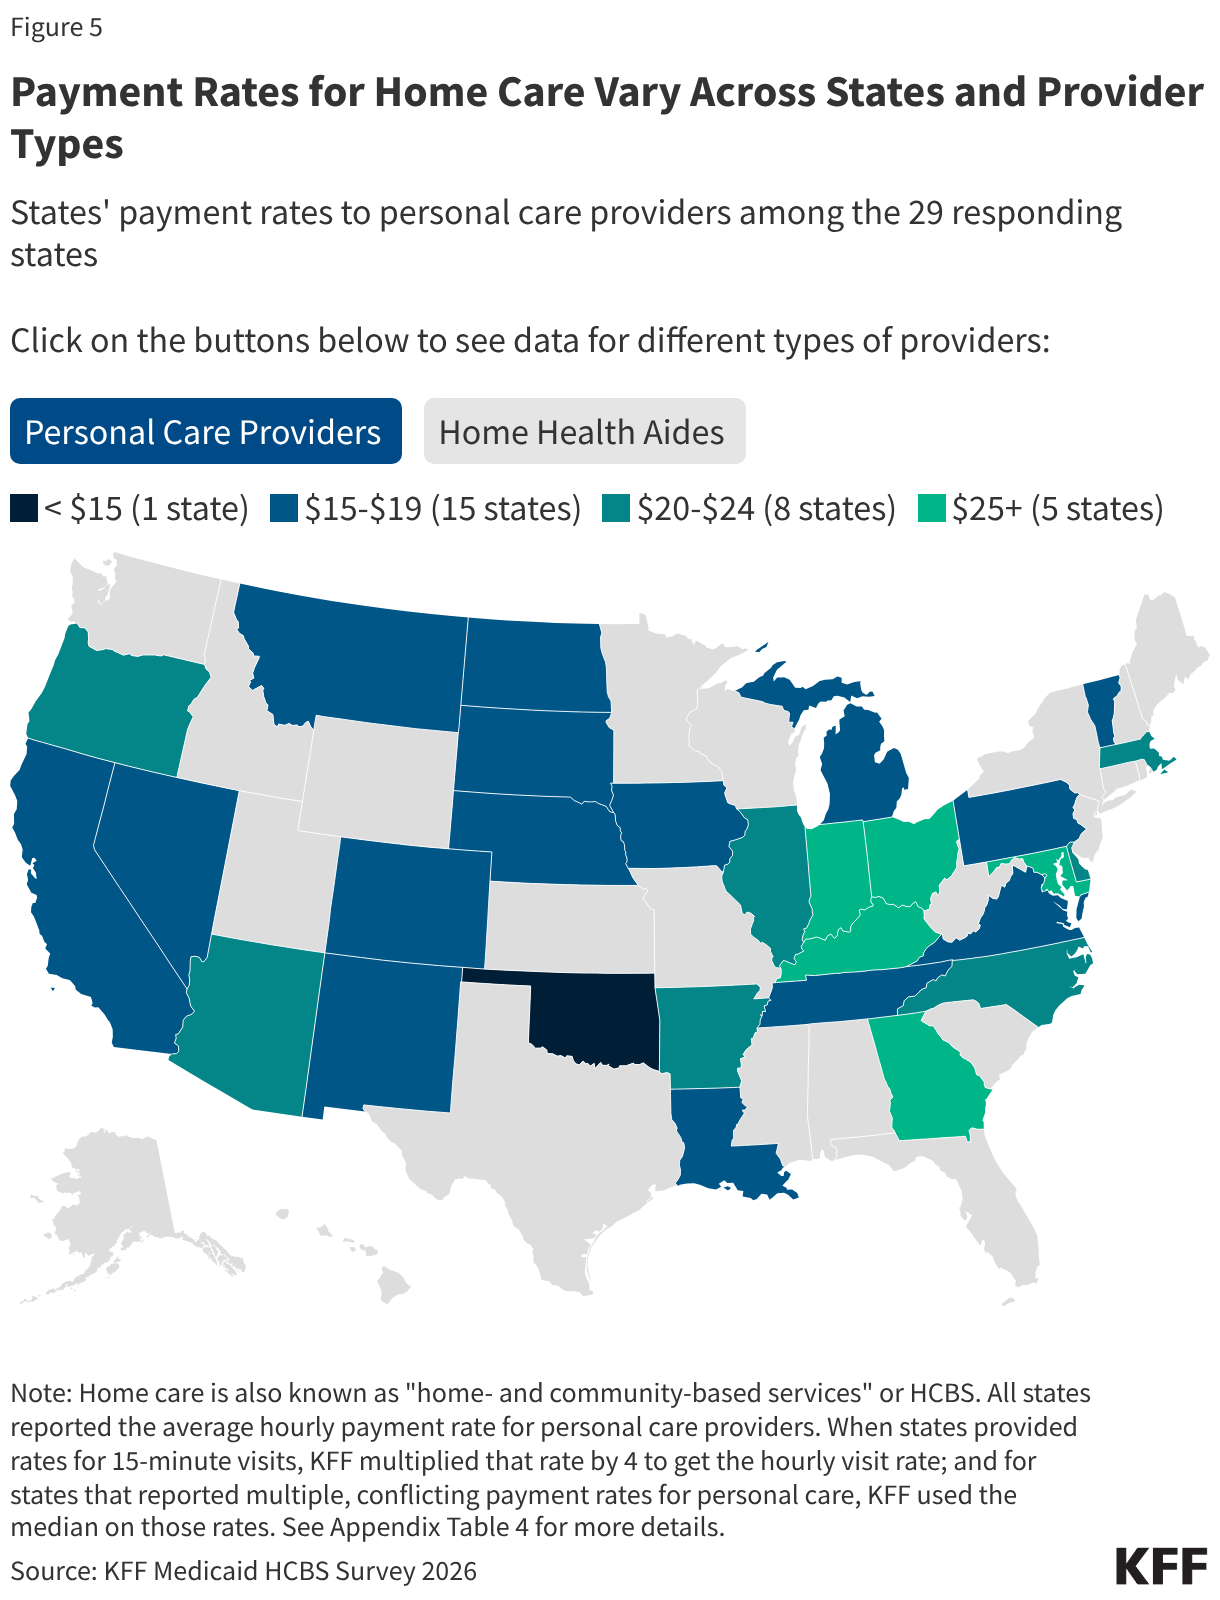
- Among the 29 states that reported time-based payment rates for personal care providers, more than half pay less than $20 per hour (Figure 5).
How Are States Addressing the Workforce Challenges in Home Care?
All responding states reported workforce shortages in 2026, with the most common shortages being among nursing staff (47 states), direct support professionals (46 states), and personal care attendants (45 states) (Figure 2, Appendix Table 2). States were asked if they had shortages of each type of provider but were not provided with a definition of “shortage.” Most states also reported shortages of home health aides (42 states), case managers (41 states), certified nurse aides (40 states), community-based mental health providers (36 states), and occupational, physical, and speech therapy providers (31 states). In some cases, states may not have reported a shortage of a particular type of provider because that type of service is not offered through their home care program. Nearly all responding states (48) reported shortages for more than one type of provider, and 45 states reported shortages among five or more provider types.
Most states (43) reported increasing shortages of home care workers in 2026 relative to 2025, with high turnover (38 states), low wages (36 states), and increased demand for home care services (30 states) ranked as the most common factors contributing to increased shortages. States were asked whether they experienced increasing shortages of home care workers in the last year and, if yes, what factors may be contributing to the worsening shortages. Four states acknowledged the same level of shortages as the previous year (Ohio, Tennessee, Texas, and Utah), while two states (New Hampshire and Virginia) noted that the trend was unknown. When ranked by priority, low wages relative to other sectors was the top factor contributing to the shortages. States reported other challenges to building the home care workforce, including changes in immigration enforcement, lack of benefits, increasing job responsibilities, an aging workforce exiting the labor pool, and provider shortages in rural areas. Some state officials provided comments that underscored workforce challenges:
“With inflation rising and low reimbursement rates for providers, it is difficult for [agencies] to offer competitive salaries for workers to retain qualified professional staff.”
“[There is] high HCBS employee workforce turnover rate, ranging from 29%–48% for direct support workers alone. [There is also a] lack of benefits, with roughly only a quarter of providers offering benefits to their employees, and salaries not keeping pace with inflation.”
“There are not enough workers interested in providing self-directed services to meet the growing needs of families.”
Within the last year, 43 states reported permanent closures of home care providers, which were most common among adult day health programs (29 states), enrollees’ homes (26 states), assisted living facilities (24 states), and group homes (23 states) (Figure 3, Appendix Table 3). States were asked if there were any permanent closures of providers that offer services for Medicaid enrollees based on the location in which the providers deliver care. For a setting such as an assisted living facility or group home, a closure could reflect either the closure of an assisted living facility or the closure of a home care agency that sent workers into facilities and group homes. States were not asked to provide a reason for the closures. Some states reported closures of home health agencies (14 states), supported employment providers (11 states), and community mental health providers (8 states). Most states (38) reported closures among more than one type of provider, and 30 states reported closures among three or more provider types.
All responding states reported taking actions to address provider shortages, with 39 states increasing provider payment rates and 37 states developing or expanding worker education and training programs (Figure 1). Smaller numbers of states reported establishing or raising a state minimum wage requirement for HCBS workers (19 states), offering paid sick leave (19 states), offering incentive payments to recruit or retain workers (15 states), and offering workers retention bonuses (9 states).
Compared with 2025, fewer states reported increasing provider compensation in 2026 (Figure 1). The number of states that reported increasing provider payment rates dropped from 48 in 2025 to 39 in 2026, while the number of states that reported offering incentive payments to recruit or retain workers dropped from 24 to 15, and the number of states that reported offering retention bonuses dropped from 20 to 9. There were minimal changes in the number of states that reported other initiatives between 2025 and 2026, suggesting that the reduced number of states offering higher compensation (which is a direct cost increase for the states) may reflect states’ more tenuous fiscal climate.
All but 11 states use managed care to provide at least some home care, and in 15 of the states with managed care, fee-for-service payment rates impact the payment rates that managed care plans pay home care providers. Out of the 40 states that use managed care to provide at least some home care, 14 states reported that the fee-for-service payment rates represent the minimum amount that plans must pay providers, 1 state (Wisconsin) reported that the rate represents the maximum payment rate for managed care plans, 9 states reported that the fee-for-service rates do not affect payments by private plans, and 2 states responded that the answer was unknown or did not respond to the question.
How Much Do States Pay for Medicaid Home Care?
The paragraphs in this section provide information on the payment rates collected from KFF’s survey of Medicaid home care programs. States are now required to report some Medicaid home care payment rates on state websites, per the provisions in the 2024 Medicaid Access Rule. While the publicly reported data are much more detailed than KFF’s survey data (often including payment rates by procedure code, sub-state geography, or population type), the data are difficult to compare payment rates across services, worker types, and states. See Appendix Box 1 for more information on these requirements and how the publicly reported data differ from data reported to KFF.
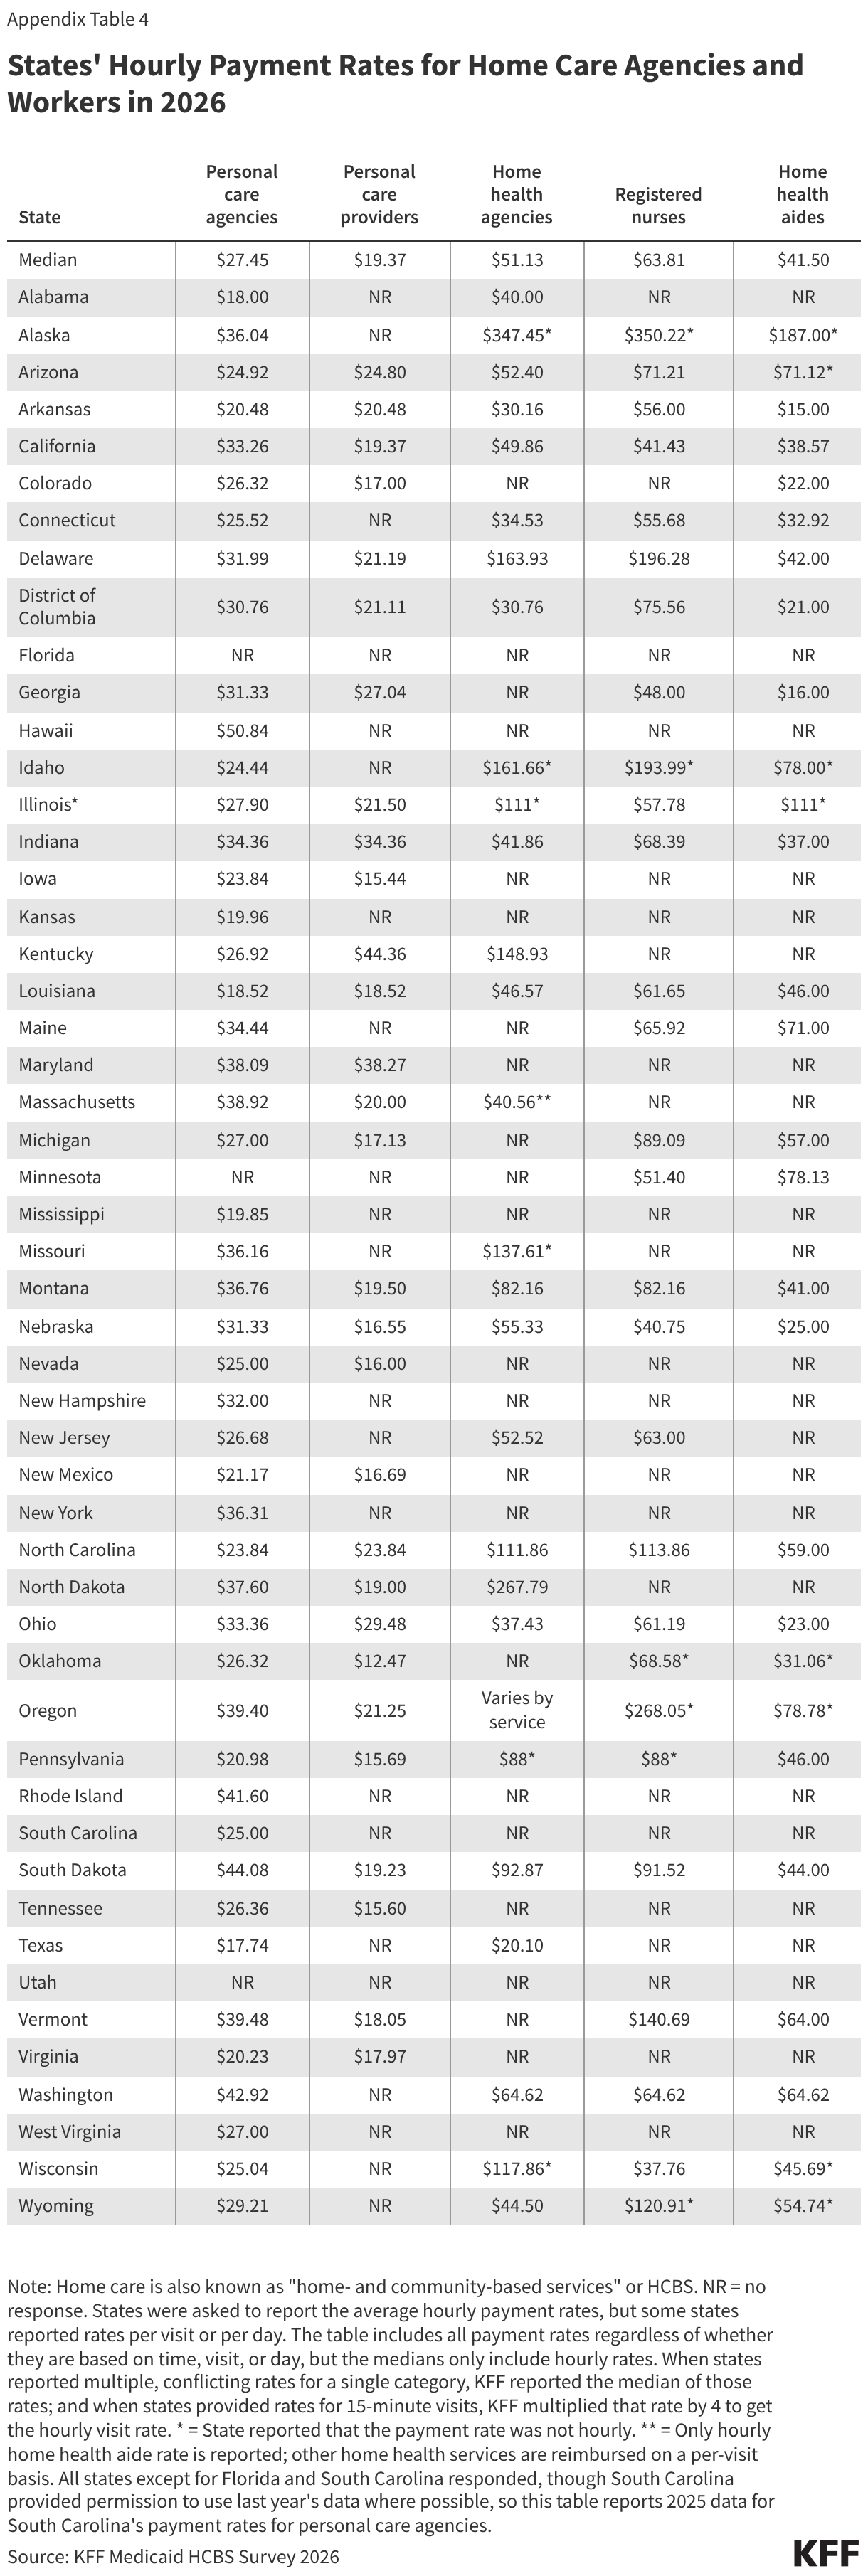
KFF asked states to report their average hourly rate paid to two types of home care provider agencies (personal care agencies and home health agencies) and three types of specific home care providers (personal care providers, home health aides, and registered nurses), but many states were unable to report all rates (Appendix Table 4). The number of states that responded to the KFF survey but did not provide hourly payment rates or reported that payment rates were unknown was 2 for personal care agencies and 29 for home health agencies. Many states also did not provide payment rates for specific provider types: For registered nurses and home health aides, more than half of states did not provide hourly payment rate information or reported that payment rates were unknown. Among the states that were able to report payment rates in the KFF survey, only 15 could report payment rates for personal care agencies, home health agencies, personal care providers, and home health aides. Those 15 states include states that reported a mix of hourly and non-hourly rates for these services.
States reported many reasons why it was difficult to report payment rates, including the following:
- Some states reported that services were bundled together in various ways, and therefore the payment rates were not distinguishable.
- Among states with managed care, some states responded that they did not know the payment rates for agencies because the services were paid for by managed care plans and they did not have access to those payment rates.
- Other states responded that they knew the payment rates for agencies but not what the agencies paid their home care workers.
In addition to having difficulty reporting payment rates, many states reported different payment rates for personal care across different waivers, and the waiver payment rates often differ from the payment rates for personal care provided through the state plan. When states reported multiple payment rates for personal care, KFF used the median of those payment rates in the analysis.
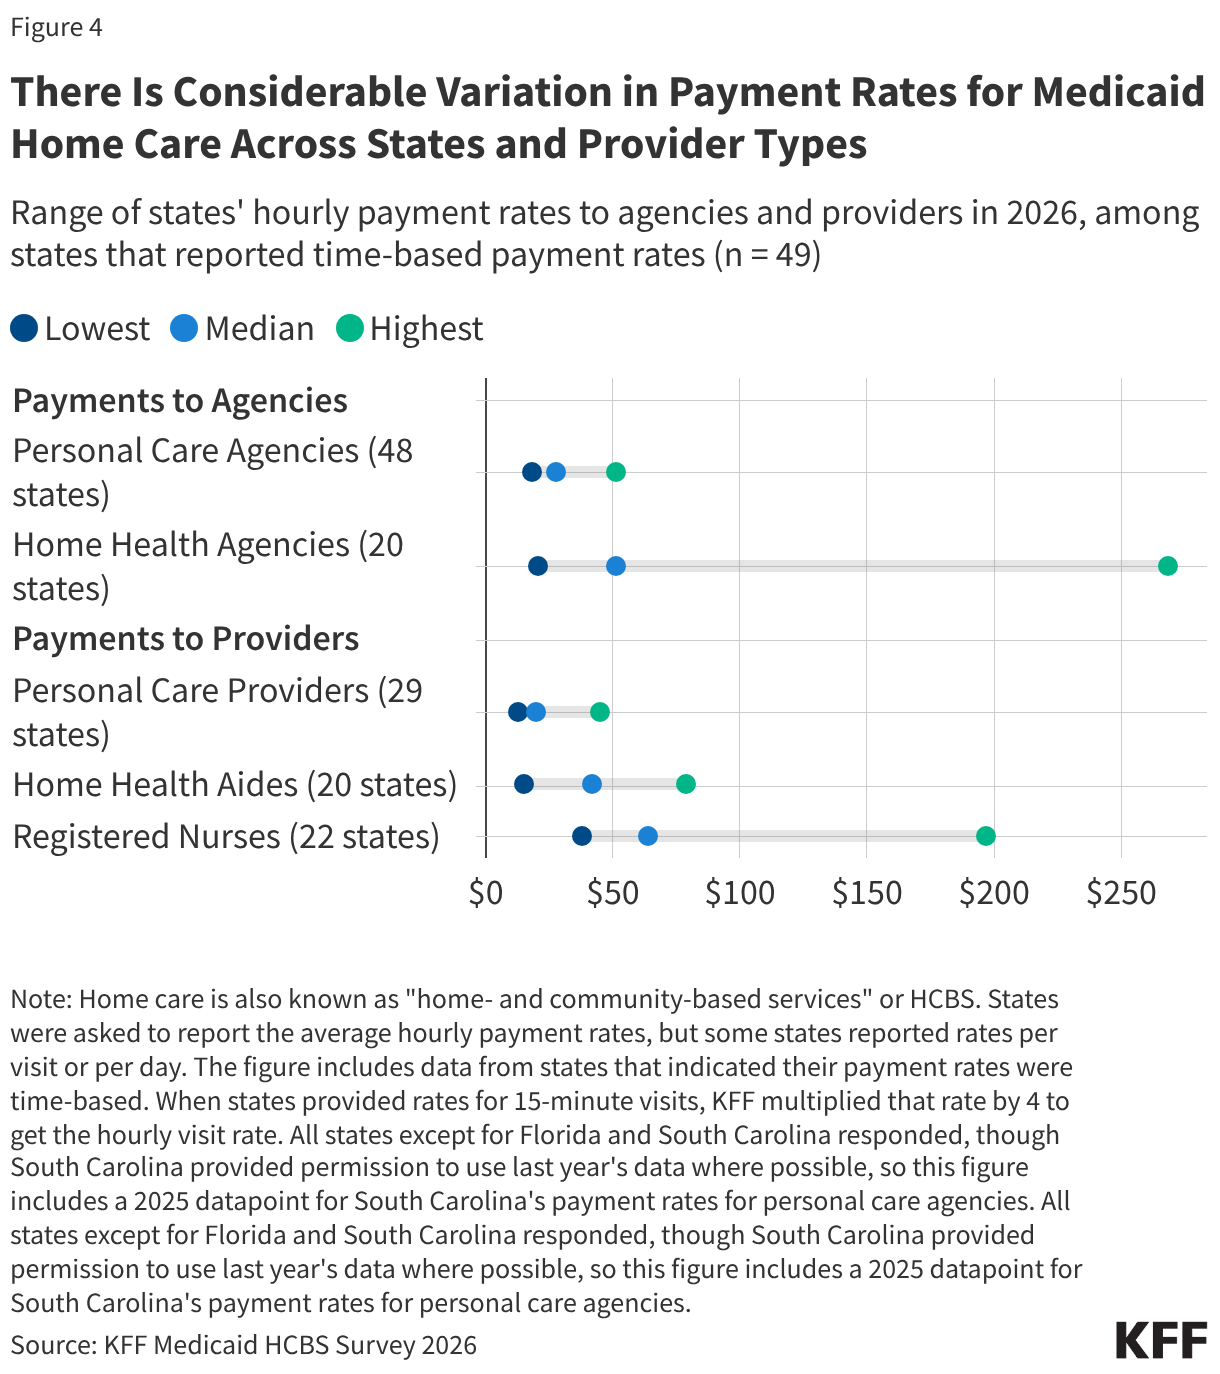
The payment rates to home care providers show considerable variation and are somewhat higher than those reported by other organizations, which may reflect differences in reporting and provider categorization (Figure 4). KFF’s survey estimates that median payment rates to providers are $19 per hour for personal care providers, $42 for home health aides, and $64 for registered nurses. It is difficult to compare those numbers to other sources of data for the following reasons:
- Other organizations group classes of providers together differently. The Bureau of Labor Statistics reports $17 per hour for home health and personal care aides in 2025.
- Other organizations include payment rates for workers regardless of the source of payment, whereas KFF rates only reflect the Medicaid rates. Medicaid often covers more intensive personal care services than other payers, which may contribute to the higher rates.
Payment rates to home health agencies are generally higher than those to personal care agencies, but there is considerable variation in both (Figure 4). Among states reporting hourly rates, the rates for home health agencies range from $20 to $268, whereas those for personal care agencies range from $18 to $51. Those states reported that the median hourly payment to home health agencies was $51 and $27 for personal care agencies. Between 2025 and 2026, the median payment rates for personal care agencies and home health aides increased marginally ($26 to $27 and $41 to $42), while median payment rates for personal care providers and home health agencies stayed the same ($19 and $51, respectively) and median payment rates for registered nurses decreased ($70 to $64).
Among states able to report any payment rate data, payments for personal care workers range from below $15 to over $25 per hour (Figure 5, Appendix Table 4). Rates for home health aides are somewhat higher than those of personal care workers, reflecting the additional training requirements for such workers. Among the states with payment rates for home health aides in the highest category, some states reported that the rates were per visit or per day (which is noted in Appendix Table 4). There were other states with particularly high payment rates that did not report providing rates per visit or per day, but the rates may still reflect a non-hourly payment basis.
Appendix Tables
Appendix Box 1: What Does the Medicaid Access Rule Require and How Do the Publicly Reported Data Compare to the KFF Survey Data?
What does the Access Rule require?
To improve transparency around home care payment rates, the 2024 Access Rule required states to publish payment rates on their websites starting July 2026. The home care requirements are a subset of requirements in the rule related to Medicaid fee-for-service rates. The provisions from the rule that went into effect on July 2026 require states to report hourly payment rates for personal care, home health aide, homemaker, and habilitation services on state websites; and to identify the number of Medicaid-paid claims and number of Medicaid enrollees who received services within a calendar year. During a public webinar, CMS specified that states must also report proposed rate reductions for 1915(c) waivers (states’ most common approaches for providing home care) to CMS.
Starting in July 2028, another provision of the Access Rule requires states to report the percent of total Medicaid payments for personal care, home health aide, homemaker, and habilitation services that is spent on compensation for direct care workers. Recent guidance released by the federal government provides more information on how states may define the specified services, direct care workers, and compensation. Fee-for-service reporting requirements begin July 9, 2028 and managed care requirements apply to rating periods beginning on or after July 9, 2028. States must report on their readiness to comply with this requirement by July 2027. This requirement was intended to help address workforce shortages, and the rule specifies that states are to ensure that at least 80% of total Medicaid payments are going to direct care worker compensation by July 2030, a requirement informally known as the 80/20 rule. The recent guidance did not mention any requirements for states to begin planning for the 80/20 rule.
How do the publicly reported data on payment rates compare to the KFF survey data?
KFF reviewed the publicly reported data from just under half of states and found that the publicly reported data from states under the access rule differ from KFF survey data in several respects. Generally speaking, the publicly reported data provide more detail than the KFF survey data, which may be useful for understanding within-state variation in payments, but also makes it difficult to compare payment rates across states. Specifically:
- KFF data on payment rates are standardized across states to the greatest extent possible and can be downloaded in 50-state tables, whereas state-reported data on payment rates are not standardized in either format or content, which makes it difficult to compare across states. In both the KFF data and the state-reported data, however, some states reported some payment rates per day or per visit rather than per hour, while other states reported hourly rates.
- KFF asks states to provide average payment rates across the state, but the state-reported data may differ by geographic region. For example, Colorado reports different rates for Denver and non-Denver areas, while North Carolina reports state-level rates.
- KFF asks states to provide the average payment rate across all services provided within a waiver or state plan benefit, but state-reported data often show payment rates by specific procedure code or service type (e.g. Illinois).
- KFF did not ask states to provide the number of people using each service or the number of services delivered, but states are also required to report this information at the procedure code level. KFF relies on claims data for counts of home care users, but does not use procedure codes, so comparison to public data is challenging.