Medicaid Financing: The Basics
 Medicaid represents nearly $1 out of every $5 spent on health care in the U.S. and is the major source of financing for states to provide health coverage and long-term care for low-income residents. Medicaid is administered by states within broad federal rules and jointly funded by states and the federal government through a federal matching program with no cap. With Donald Trump returning to the presidency and Republican control of the Senate and House, discussions are ramping up about major cuts to federal spending, including federal Medicaid spending, through a new government efficiency initiative and to help pay for an extension of tax cuts in the 2017 Tax Cuts and Jobs Act. Restricting federal Medicaid spending could leave states with tough choices about whether to offset reductions with state dollars, limit Medicaid utilization or benefits, or reduce coverage. Amid uncertainty for Medicaid financing at the federal level, states have also reported uncertainty regarding post-unwinding Medicaid spending and enrollment trends and recent shifts in state fiscal conditions. This brief examines the following key questions ahead of potential proposals to change Medicaid financing:
- How does Medicaid financing work?
- How much does Medicaid cost and how are funds spent?
- How does Medicaid relate to federal and state budgets?
- What factors affect Medicaid spending changes?
How does Medicaid financing work?
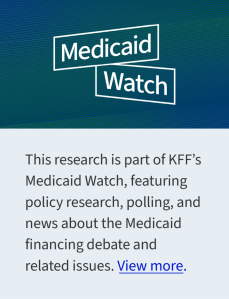
Medicaid financing is shared by states and the federal government with a guarantee to states for federal matching payments with no pre-set limit. The percentage of costs paid by the federal government (known as the federal medical assistance percentage or “FMAP”) varies across states, for specific services and types of enrollees, and depending on whether the costs are for medical care or program administration. The match rate has also been temporarily adjusted during economic downturns and most recently during the COVID-19 pandemic.
The FMAP for services used by people eligible through traditional Medicaid, which includes individuals who are eligible as children, low-income parents, because of disability, or because of age (65+), is determined by a formula set in statute. The formula is designed so that the federal government provides a match rate of at least 50% and provides a higher match rate for states with lower average per capita income. The resulting FMAP varies by state and ranged from 50% (the FMAP “floor”) in ten states (California, Colorado, Connecticut, Maryland, Massachusetts, New Hampshire, New Jersey, New York, Washington, and Wyoming) to 77% in Mississippi for federal fiscal year (FFY) 2026 (Figure 1).
To participate in Medicaid and receive federal matching dollars, states must meet core federal requirements. States must provide certain mandatory benefits (e.g., hospital, physician, and nursing home services) to core populations (e.g., low-income pregnant women, children, people with disabilities, and people ages 65 and older) without waiting lists or enrollment caps. States may also receive federal matching funds to cover “optional” services (e.g., adult dental care and home care, also known as home and community based services) or “optional” groups (e.g. people with income above the limits established for core populations). States also have discretion to determine how to purchase covered services (e.g., through fee-for-service or capitated managed care arrangements) and to establish provider payment methods and rates.
Medicaid also provides “disproportionate share hospital” (DSH) payments to hospitals that serve a large number of Medicaid and low-income uninsured patients to offset uncompensated care costs. DSH payments totaled over $17 billion in FFY 2023. Federal DSH spending is capped for each state and facility but within those limits, states have considerable discretion in determining the amount of DSH payments to each DSH hospital. The Affordable Care Act (ACA) called for a reduction in federal DSH allotments starting in FFY 2014 based on the assumption of reduced rates of uninsurance, but the cuts have been delayed several times (most recently delayed until April 1, 2025). DSH is one type of a broader set of “supplemental” payments that states make to supplement Medicaid “base” payment rates that often do not fully cover provider costs; unlike other supplemental payments, DSH payments can also be used to pay for unpaid costs of care for the uninsured.
There are special match rates for the ACA expansion group, administration, and other services. While the traditional FMAP applies to the vast majority of Medicaid spending, there are a few exceptions that provide higher match rates for specific services or populations, such as family planning and most notably people covered under the ACA Medicaid expansion. States that have implemented the expansion currently receive a 90% FMAP for adults covered through the ACA Medicaid expansion. States that had not adopted the expansion as of 2021 when the American Rescue Plan Act was enacted are eligible for a 5% increase in the state’s traditional FMAP for two years if they implement the expansion. Administrative costs incurred by states are usually matched by the federal government at a 50% rate, but some functions such as eligibility and enrollment systems receive higher match rates. Medicaid administrative costs are less than 4% of total Medicaid spending.
Unlike in the 50 states and D.C., annual federal funding for Medicaid in the U.S. territories is subject to a statutory cap and fixed matching rate. Once a territory exhausts its capped federal funds, it no longer receives federal financial support for its Medicaid program during that fiscal year. Over time, Congress has provided increases in federal funds for the territories broadly and in response to specific emergency events. Various pieces of legislation during the pandemic significantly increased the allotments for each of the territories and also raised the FMAP rates from the statutory level of 55% to 76% for Puerto Rico and 83% for the other territories. The 2023 Consolidated Appropriations Act extended the 76% FMAP for Puerto Rico through FFY 2027 and made the 83% match rate for other territories permanent.
Both the federal government and states are responsible for promoting program integrity. Program integrity broadly refers to the proper management and function of the Medicaid program to ensure it is providing quality and efficient care while using funds–taxpayer dollars–appropriately, with minimal waste. Improper payment reports in recent years have highlighted program integrity issues, and both the previous Trump Administration and the Biden Administration worked to advance program integrity, though through different means. Improper payments, which are often cited when discussing program integrity, are payments that do not meet Centers for Medicare and Medicaid Services (CMS) program requirements (they can be overpayments, underpayments, or payments with insufficient information to determine whether the payment was proper). Improper payments are not the same as criminal activities like fraud and abuse, which may be a subset of improper payments. CMS estimated the overall Medicaid improper payment rate was about 5% in 2024, the lowest rate since the COVID-19 pandemic began due, in part, to flexibilities granted during that time. Most improper payments (79%) were due to insufficient information (or missing administrative steps), not necessarily due to payments for ineligible enrollees, providers, or services (i.e., since they may have been payable if the missing information had been on the claim and/or the state had complied with requirements). The improper payment estimation process is not designed to detect or measure fraud. Program integrity efforts focused on areas identified as major contributors of improper payments, such as monitoring provider screening and enrollment for noncompliance, likely yield greater returns than focusing on reducing errors in eligibility determinations that could make it more difficult for eligible people to obtain and maintain coverage.
How much does Medicaid cost and how are funds spent?
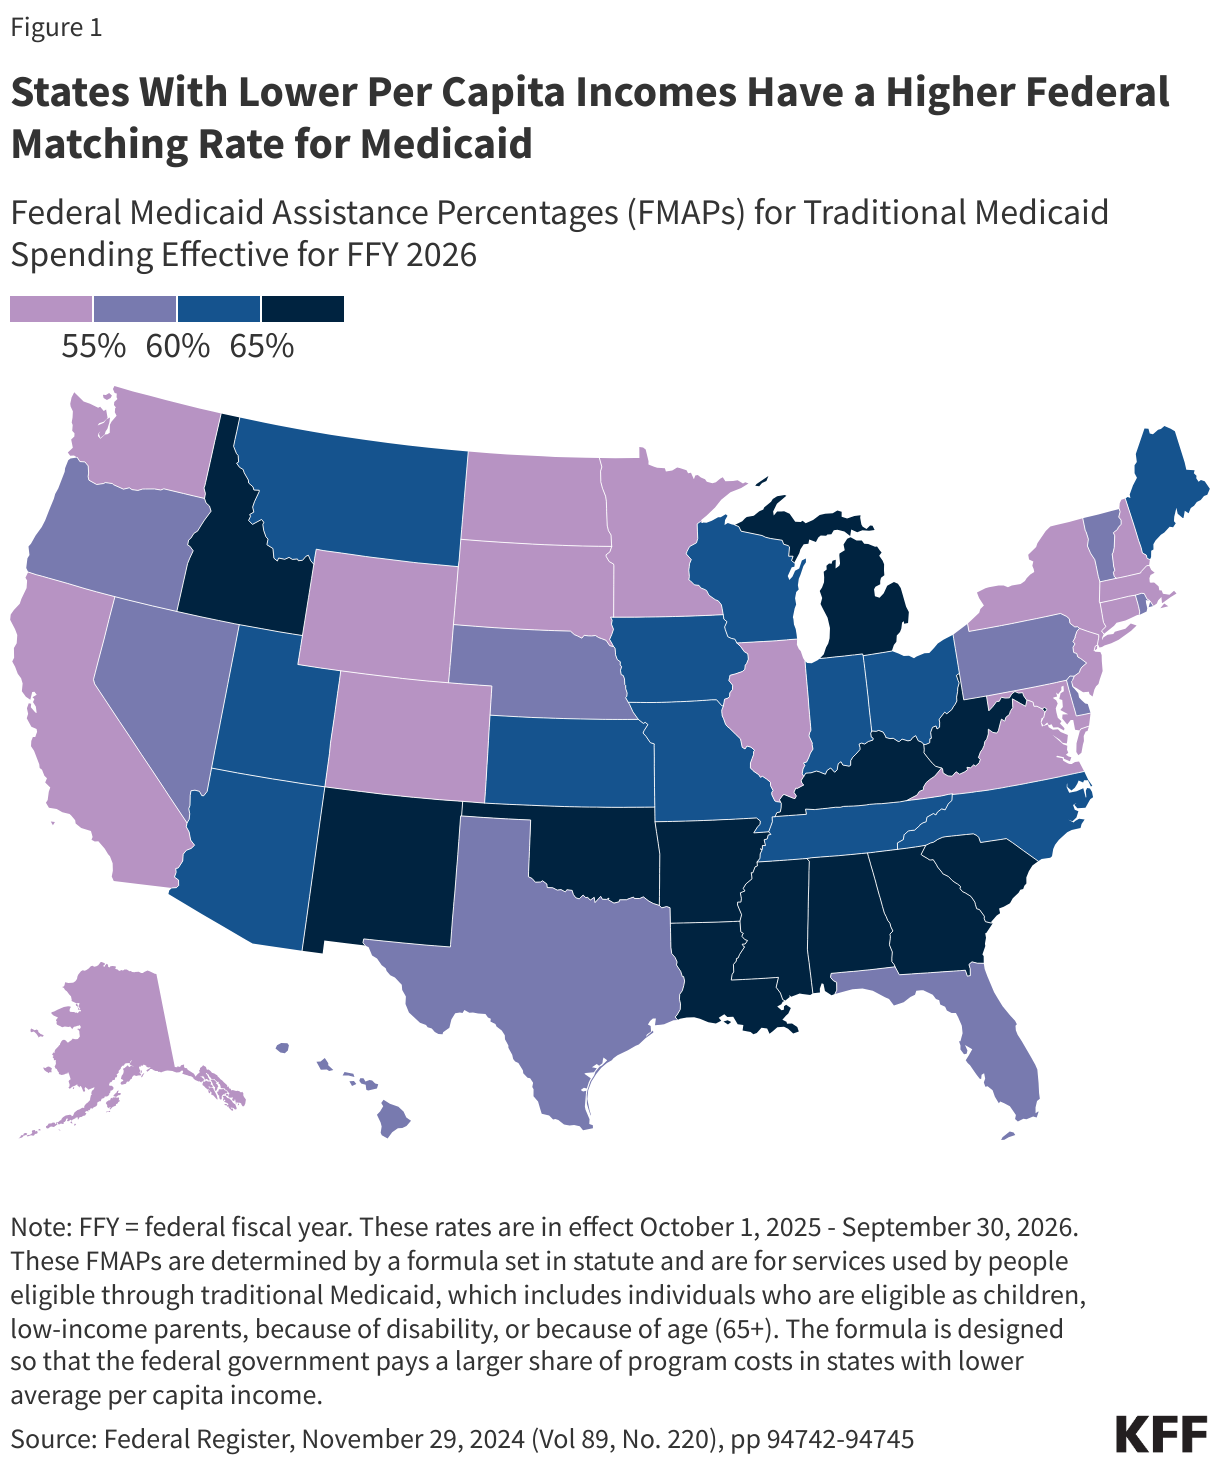
Capitated payments to Medicaid managed care organizations (MCOs) accounted for more than half of Medicaid spending in FFY 2023 (Figure 2). Managed care and health plans accounted for the largest share (55%) of Medicaid spending, with capitated payments to comprehensive MCOs accounting for 52% of Medicaid spending in FFY 2023 and other Medicaid managed care (e.g., primary care case management (PCCM) arrangements or payments to specialty plans) accounting for another 3%. Smaller shares of total Medicaid spending in FFY 2023 were for fee-for-service acute care (21%), fee-for-service long-term care (19%), Medicaid spending for Medicare premiums on behalf of enrollees who also have Medicare (3%), and DSH payments (2%).
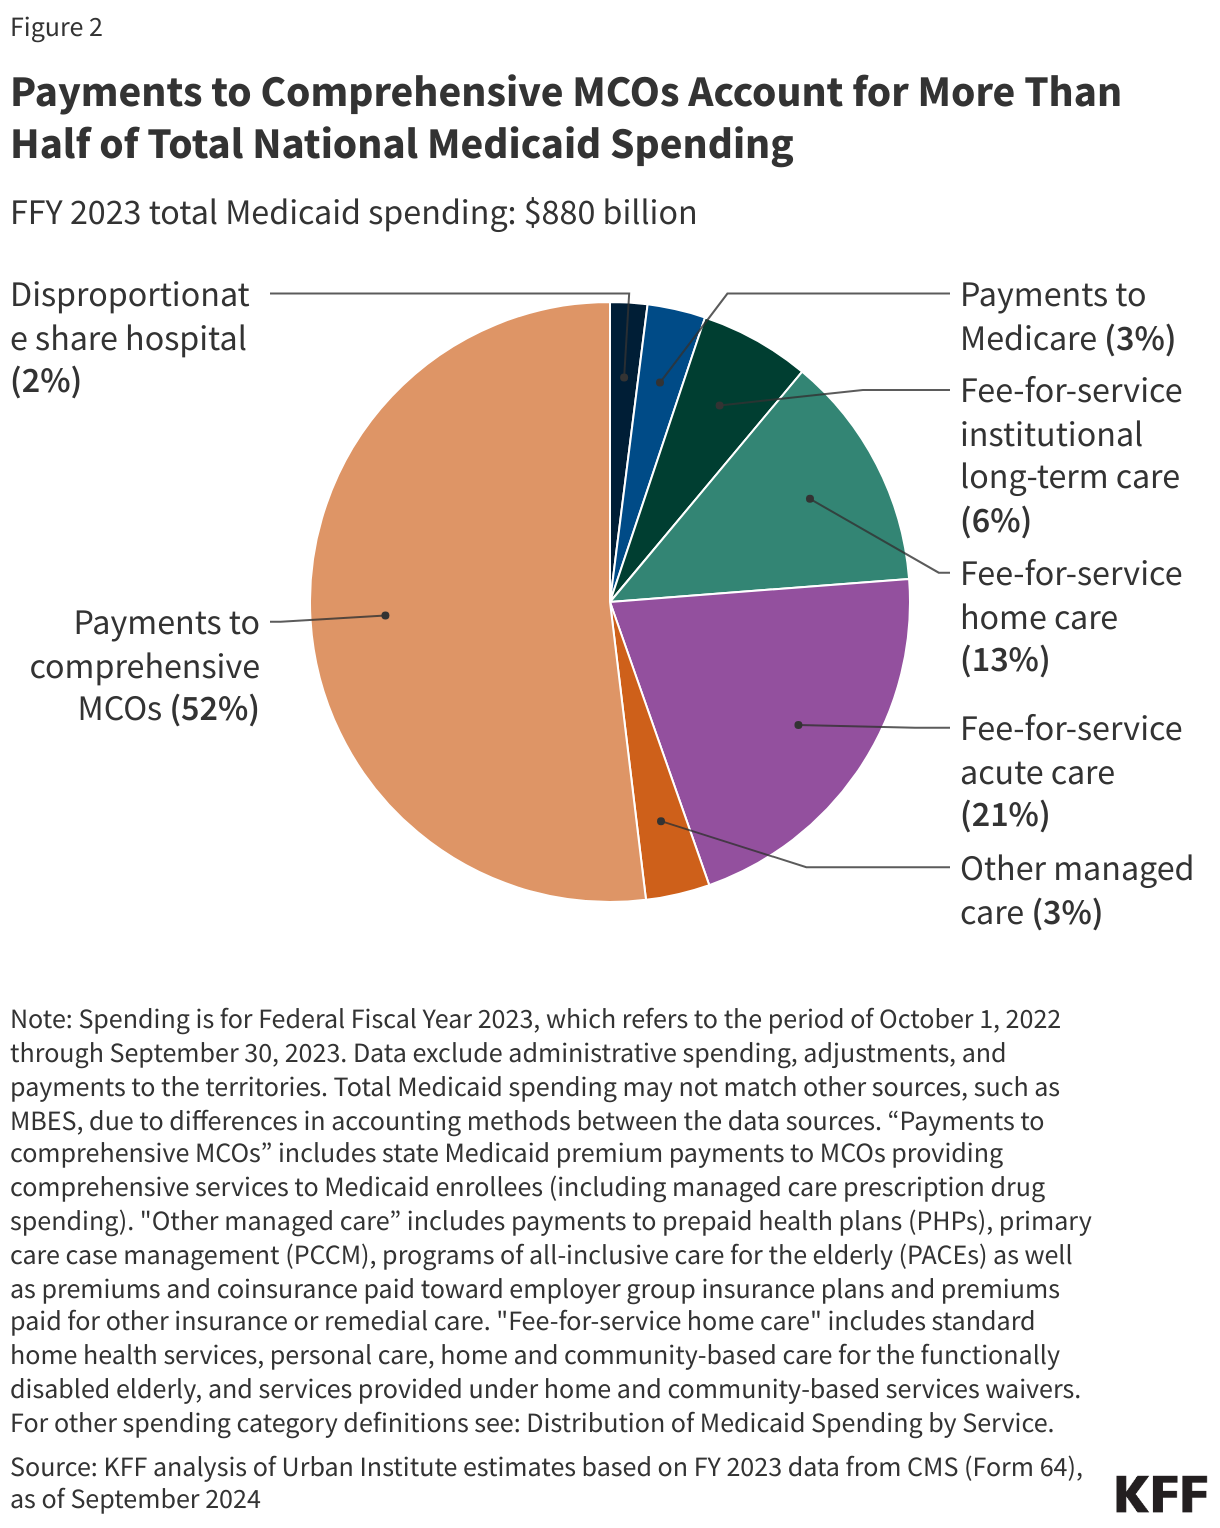
Enrollees eligible based on disability or age (65+) comprise 23% of all enrollees but account for over half of total spending due to higher per person costs (Figure 3). Children account for 34% of enrollees but only 14% of spending. Adult enrollees (those made eligible under the ACA Medicaid expansion, as well as low-income parents) account for 43% of all enrollees and 34% of spending. The disproportionate spending on certain eligibility groups stems from variation in spending per enrollee across the eligibility groups, reflecting differences in health care needs and utilization. Spending per enrollee for individuals eligible based on age (65+) and disability, the two groups with the highest per enrollee costs, is approximately six times higher than spending per enrollee for children, who had the lowest spending of any eligibility group. Those eligible on the basis of age or disability tend to have higher rates of chronic conditions, more complex health care needs and are more likely to utilize long-term care than other enrollees, contributing to higher spending.
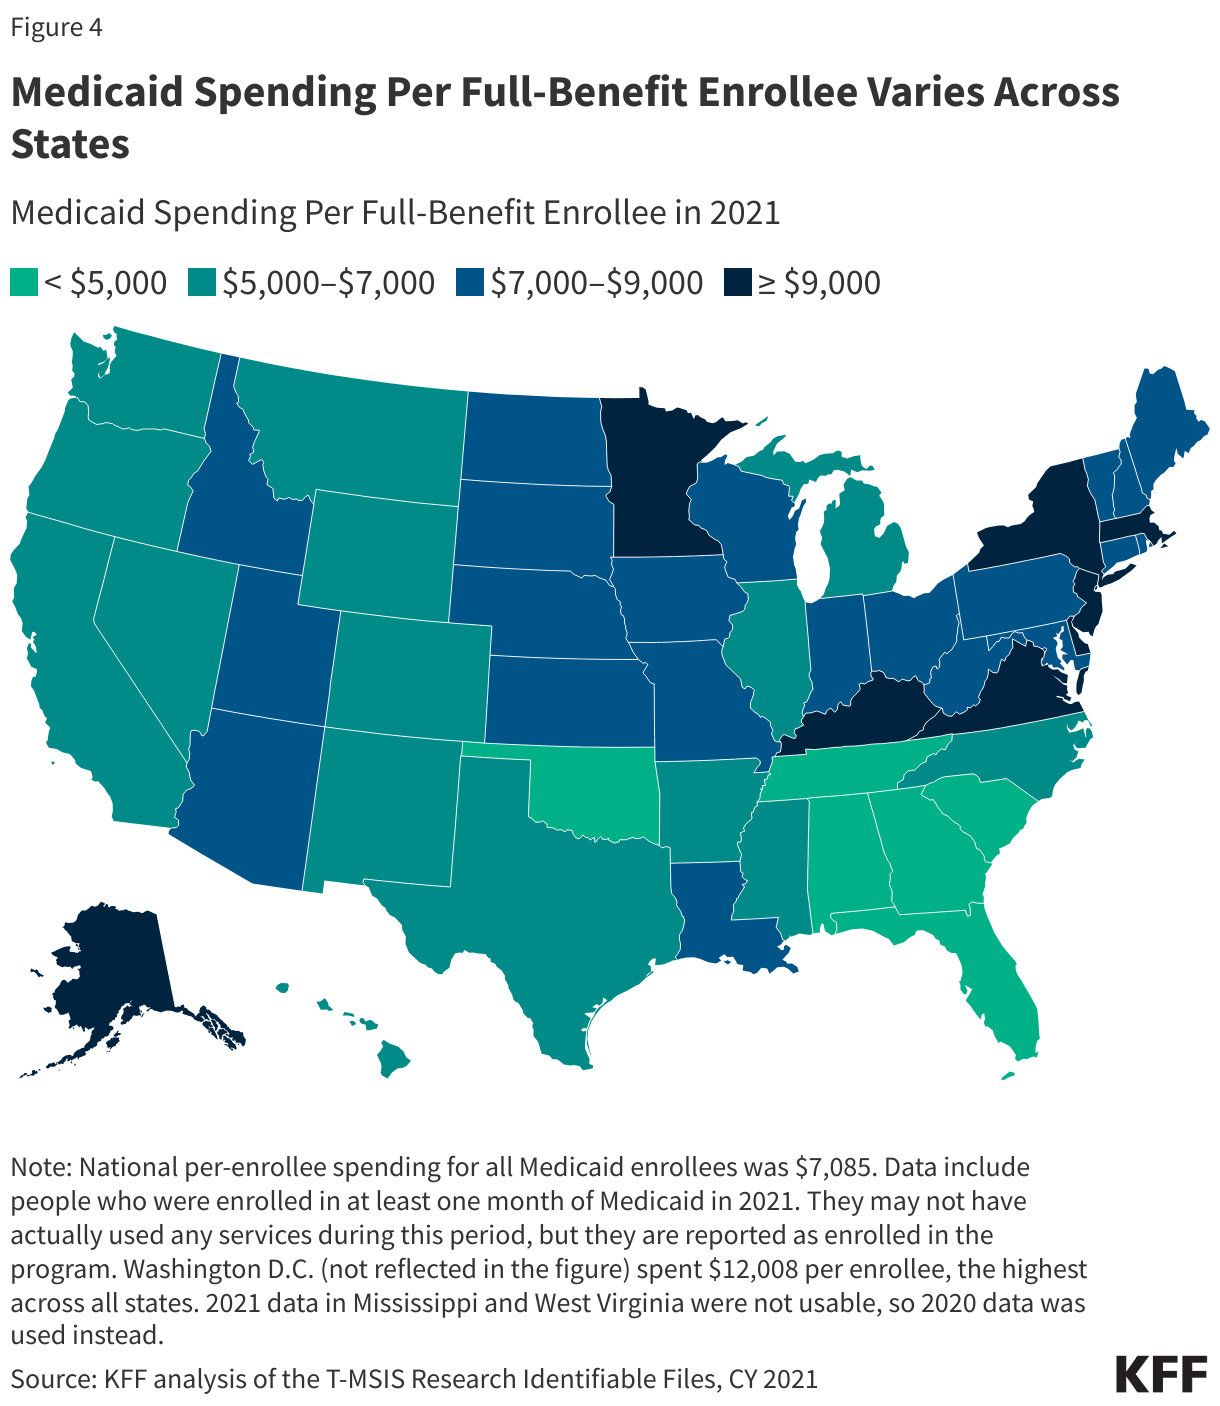
Total spending per full-benefit enrollee ranged from a low of $3,563 in Tennessee to $12,008 in the District of Columbia in 2021 (Figure 4). Variation in spending across the states reflects considerable flexibility for states to design and administer their own programs – including what benefits are covered and how much providers are paid — and variation in the health and population characteristics of state residents. Within each state, there is also substantial variation in the average costs for each eligibility group and within each eligibility group, per enrollee costs may vary significantly. Overall, Medicaid spending has experienced slower cumulative growth since 2008 compared to Medicare and private insurance on a per-enrollee basis.
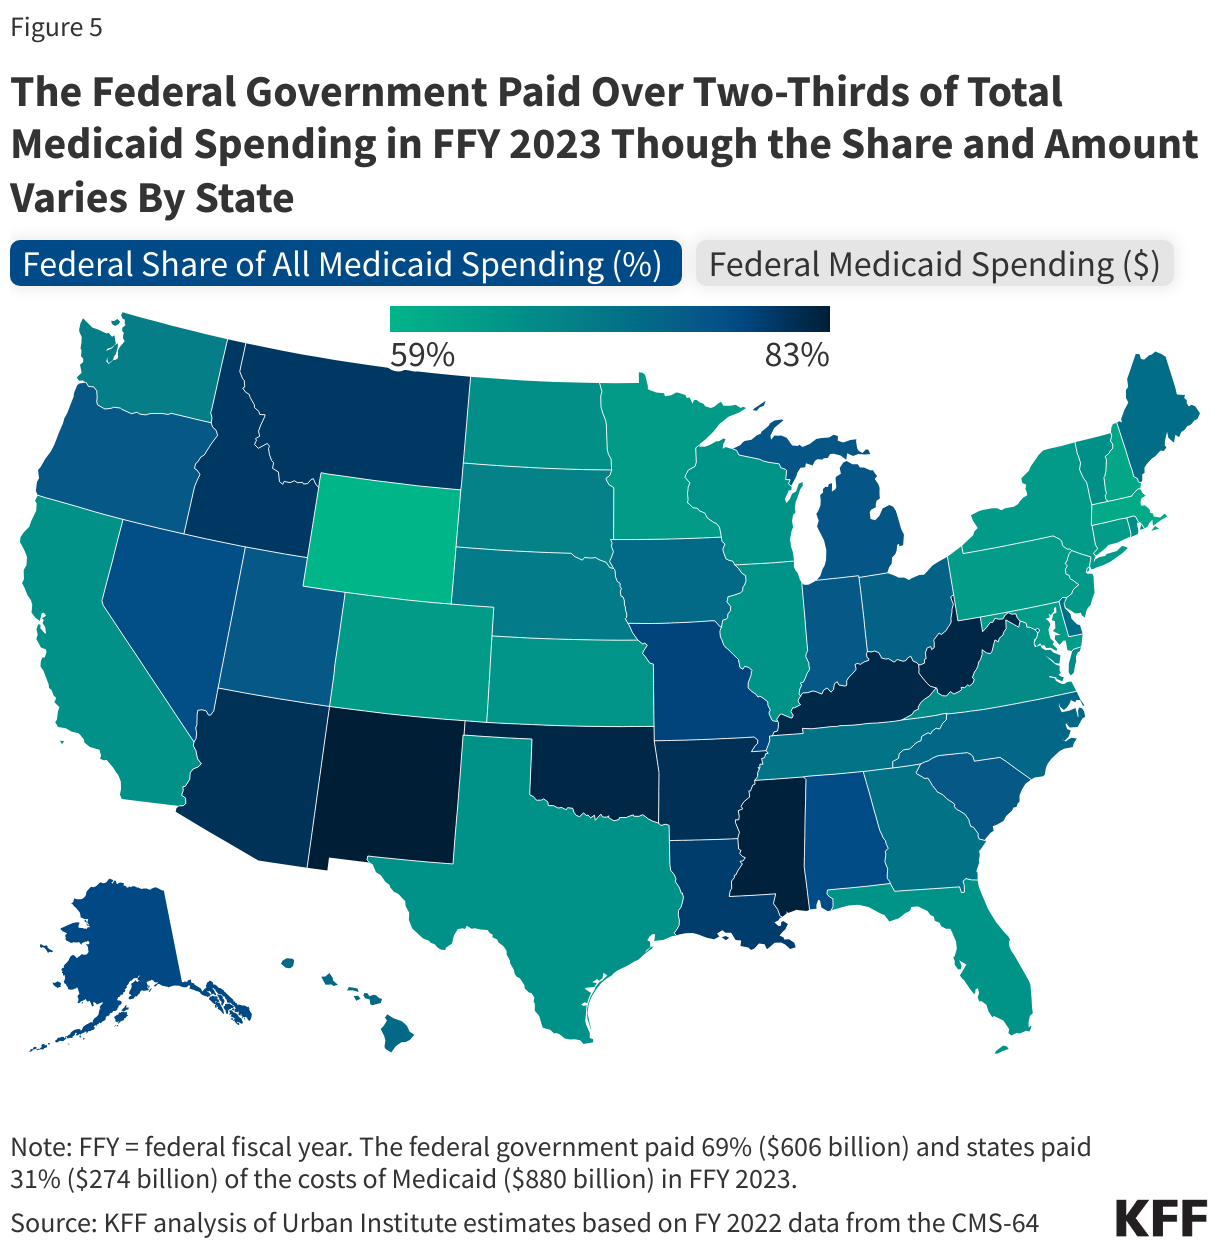
Overall, Medicaid spending totaled $880 billion in FFY 2023 with the federal government paying 69% ($606 billion) and states paying 31% ($274 billion). This share is slightly higher than historic shares due to the enhanced pandemic match rate, but there is variation across states (Figure 5). The combination of low per capita income and adopting the ACA expansion are both factors in determining the overall share of federal spending on Medicaid. While the federal share of Medicaid spending varies across states, so does the total amount of federal Medicaid dollars coming into the state. States with the largest populations (California, New York, Texas, Pennsylvania, Ohio) receive the most federal Medicaid funding.
How does Medicaid relate to federal and state budgets?
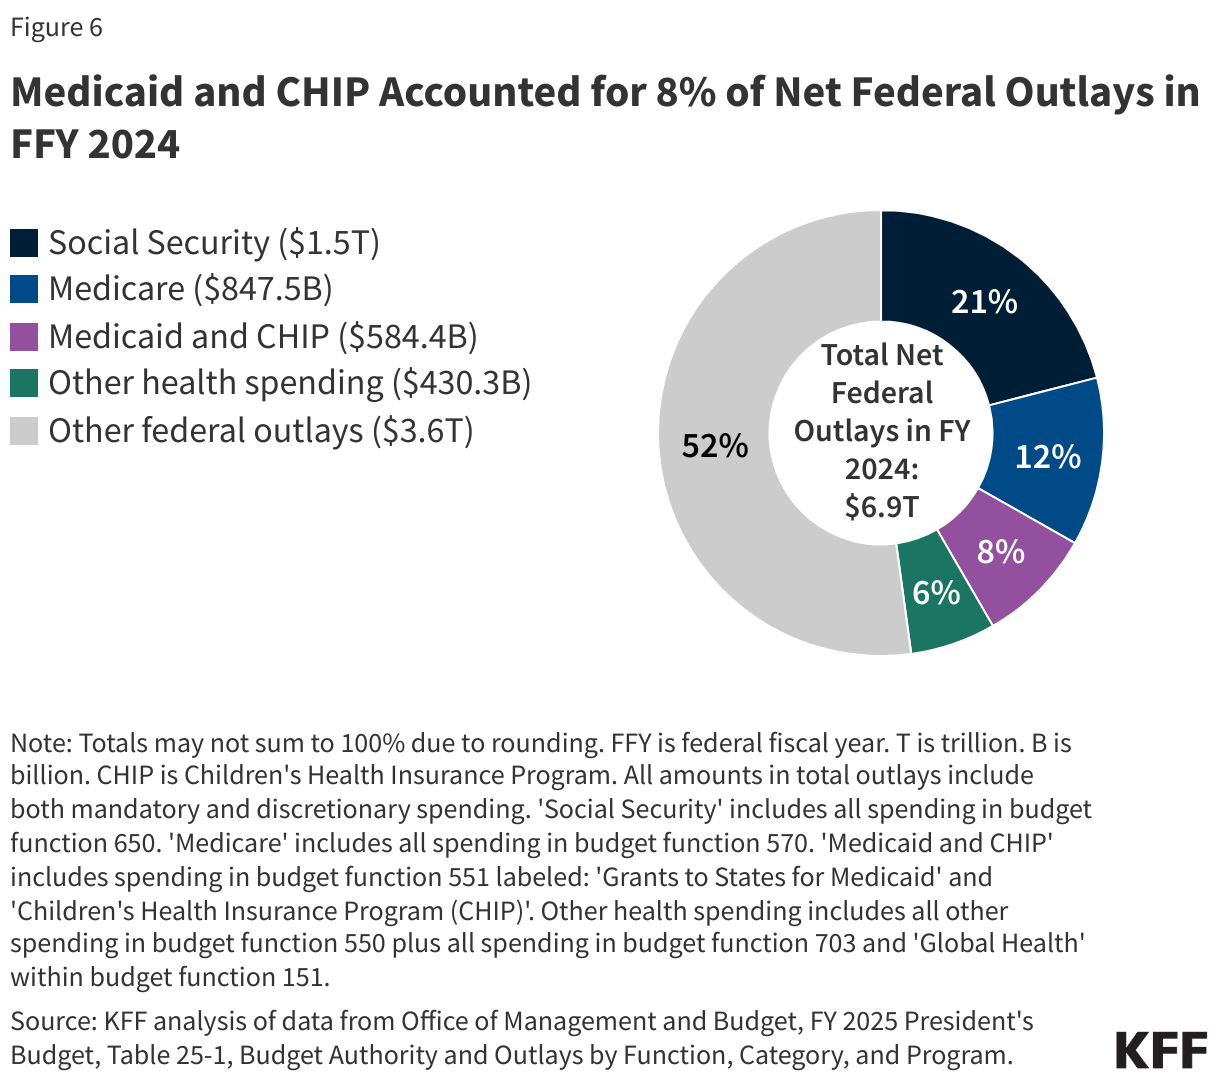
Social Security, Medicare, and Medicaid are the three main entitlement programs and accounted for 41% of all federal outlays in FFY 2024 (Figure 6). Of these three programs, Medicaid is smallest in terms of federal outlays, though it covers a larger number of people than Medicare or Social Security. Overall, federal spending on domestic and global health programs and services accounted for more than one-fourth of net federal outlays in FFY 2024, including spending on Medicare (12%), Medicaid and CHIP (8%), and other health spending (6%). It is expected that in 2025, the new Congress and Administration will leverage reconciliation to make major reductions in spending which can offset some of the costs of extending the expiring tax cuts. Budget reconciliation is a special legislative process used to make changes to taxes and mandatory spending that allows the Senate to pass legislation with only 50 votes rather than the customary 60 votes. To begin the reconciliation process, Congress must develop a budget resolution, which establishes spending levels including any large deficit or spending reduction targets. With President-elect Trump taking substantial cuts to Medicare and Social Security off the table, there will be significant pressure to reduce spending on Medicaid.
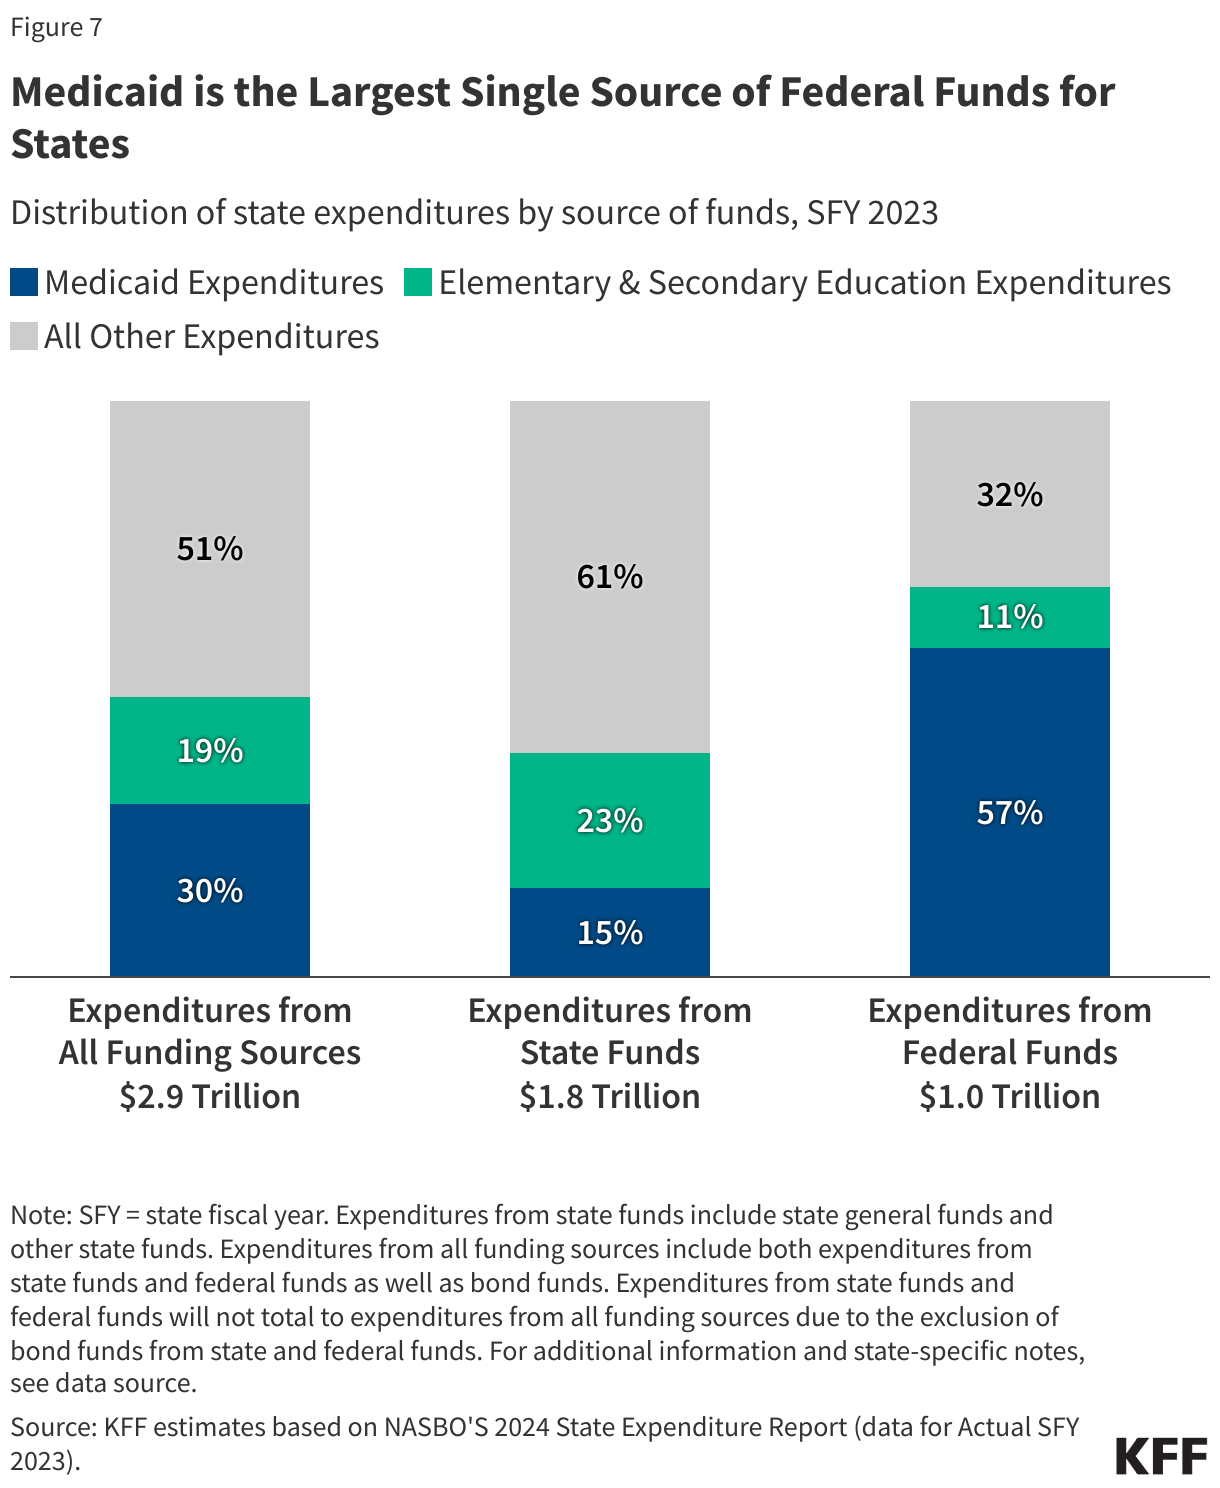
Medicaid is a spending item and at the same time the largest source of federal revenues for state budgets. As a result of the federal matching structure, Medicaid has a unique role in state budgets as both an expenditure item and a source of federal revenue for states. According to data from the National Association of State Budget Officers (NASBO), in state fiscal year (SFY) 2023, Medicaid accounted for 30% of total state spending for all items in the budget (Figure 7). Medicaid accounted for only 15% of expenditures from state funds (including state general funds and other state funds), second to K-12 education (23%). On the other hand, Medicaid accounted for 57% of all expenditures from federal funds. States have an incentive to control Medicaid spending because they pay a share of Medicaid costs. At the same time, research shows that federal matching dollars from Medicaid spending have positive effects for state economies. A number of studies show that states that have adopted the ACA Medicaid expansion have realized budget savings, revenue gains, overall economic growth as well as observed positive effects on the finances of hospitals and other health care providers.
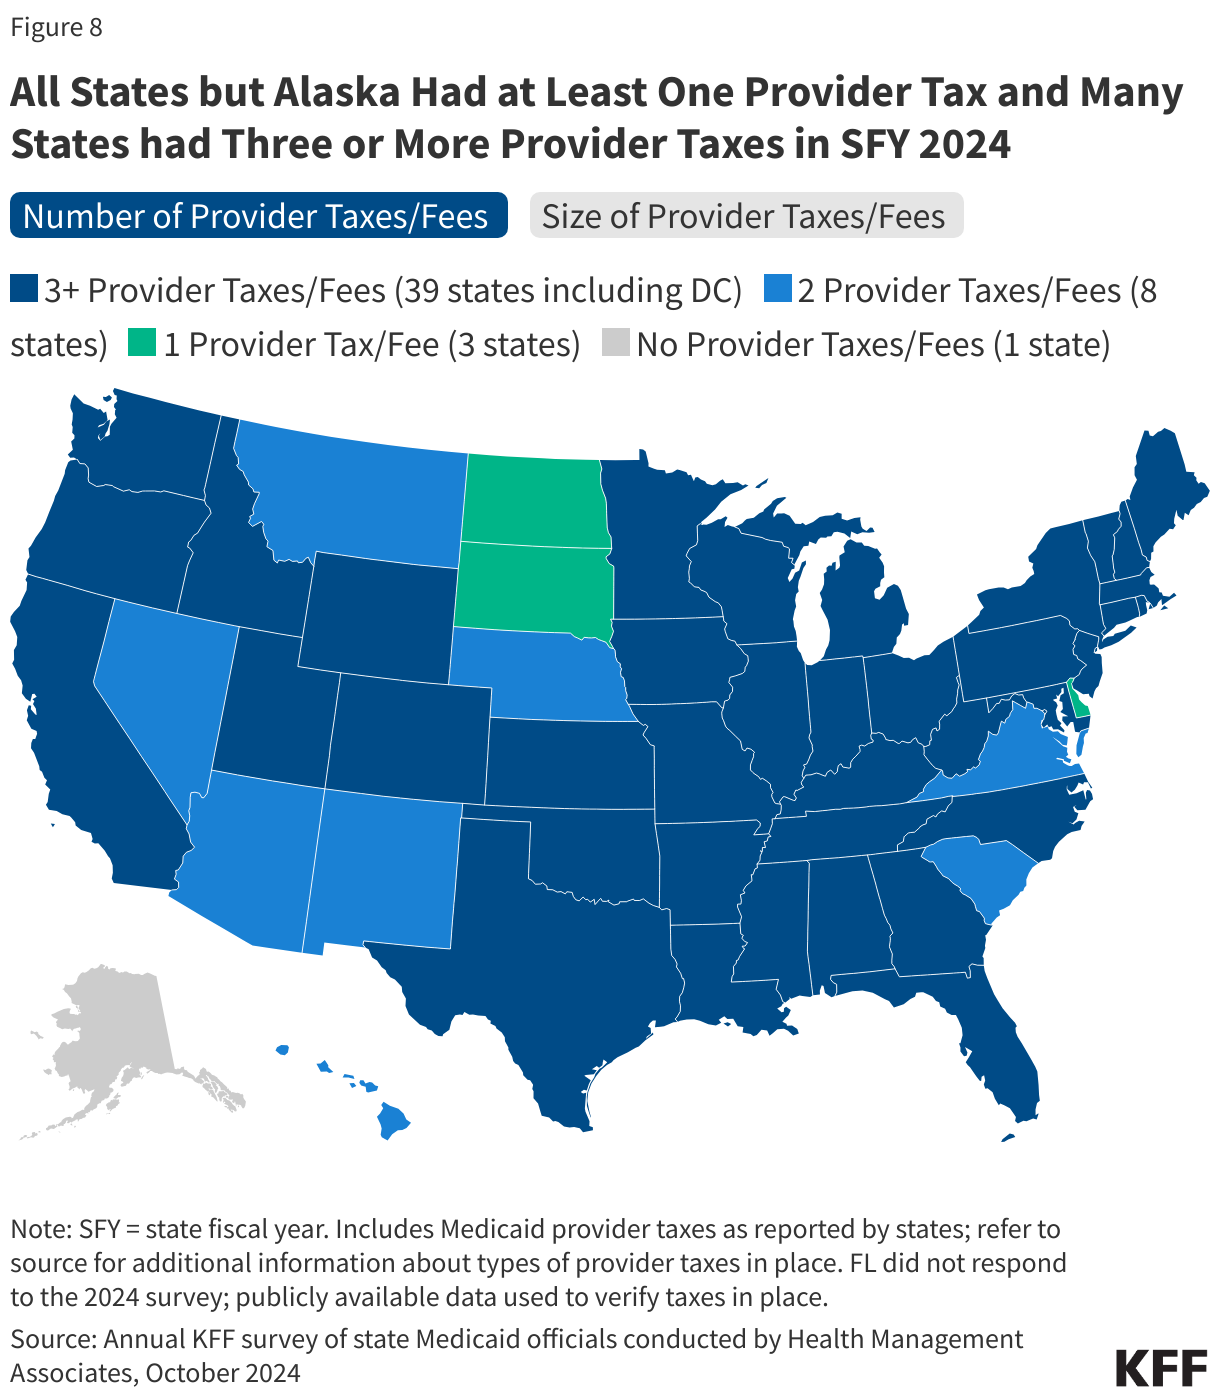
States can use provider taxes and IGTs (intergovernmental transfers) to help finance the state share of Medicaid. States have flexibility in determining how to finance the non-federal share of state Medicaid payments, within certain limits. In addition to state general funds appropriated directly to the Medicaid program, most states use funding from local governments or revenue collected from provider taxes and fees to help finance the state share of Medicaid. While data are limited, the Government Accountability Office (GAO) estimated that provider taxes accounted for approximately 17% of the non-federal share of total Medicaid payments in SFY 2018 though the share varies by state. All states (except Alaska) have at least one provider tax in place and many states have more than three (Figure 8). The most common provider taxes are on nursing facilities (46 states) and hospitals (45 states). As of July 1, 2024, 48 states including DC also reported at least one provider tax that is above 3.5% of net patient revenues, and 38 states including DC also reported at least one provider tax that is above 5.5%, which is close to the maximum federal safe harbor or allowable threshold of 6%. Provider taxes and funds from local governments are often used by states to help finance DSH payments, non-DSH supplemental payments like upper payment limit (UPL) payments, and MCO state directed payments (uniform payment increases through managed care that are similar to supplemental payments). New Medicaid managed care rules finalized in 2024 permit states to pay hospitals and nursing facilities at the average commercial payment rate (ACR) when using directed payments, contributing to expected increases in federal Medicaid spending projections.
What factors affect Medicaid spending changes?
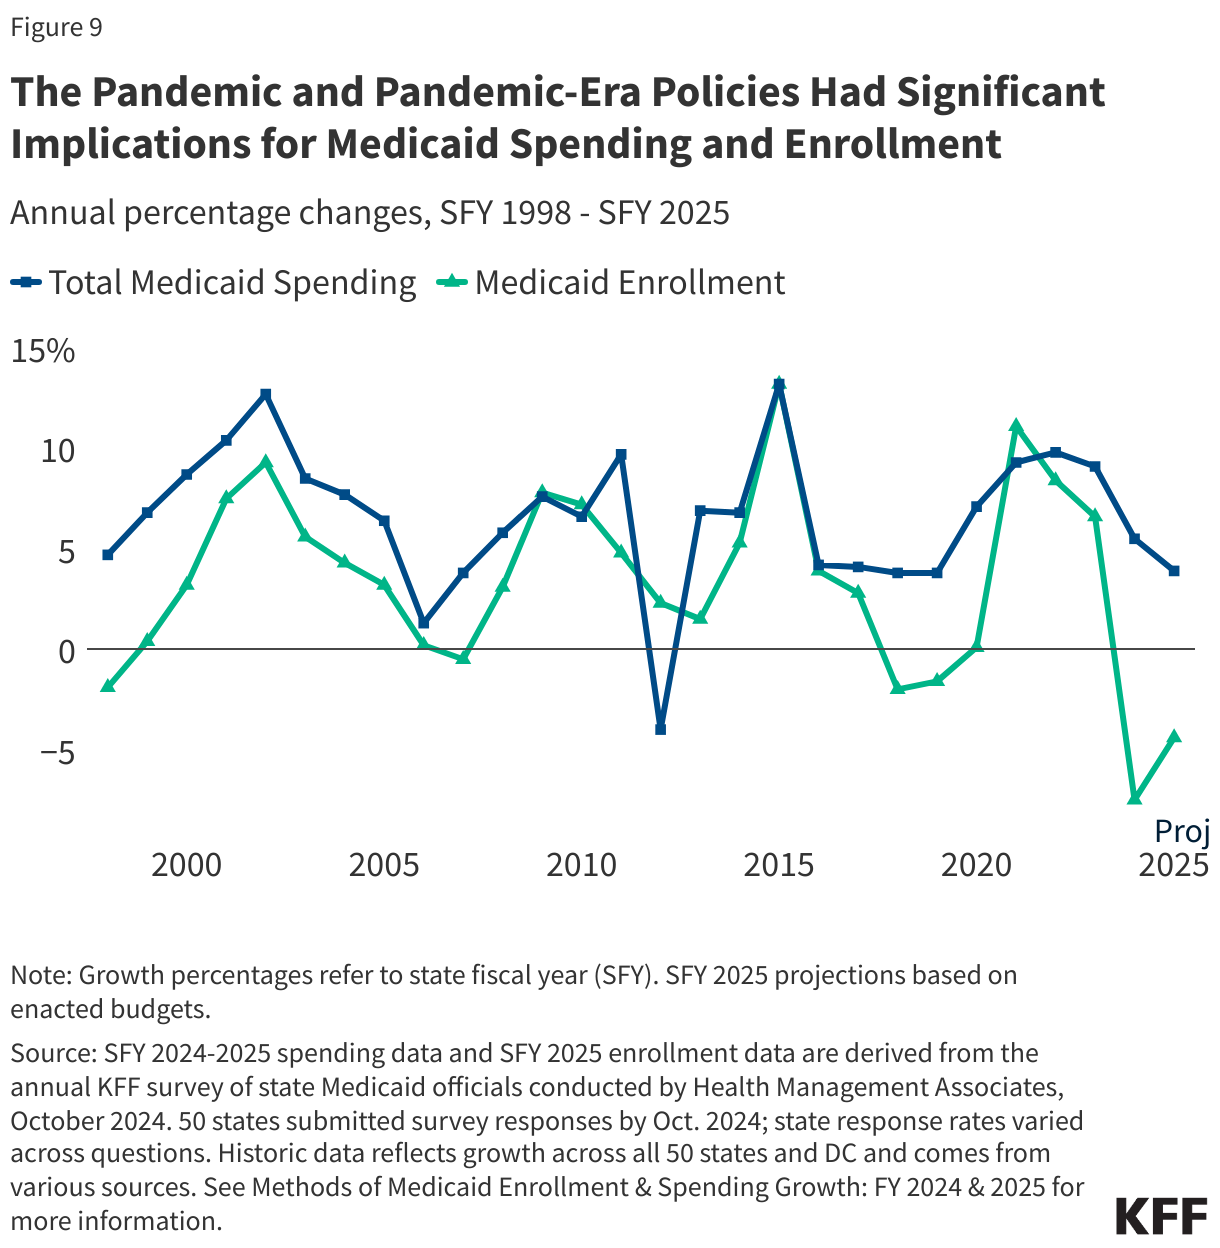
Medicaid enrollment and spending typically increase during recessions. Medicaid is a counter-cyclical program, meaning that more people become eligible and enroll during economic downturns. At the same time, states typically may face declines in revenues that make it difficult to finance the state share of funding for the program. As in past economic downturns, Congress enacted legislation during the recent pandemic-induced recession that temporarily increased the federal share of Medicaid spending to help states maintain their Medicaid programs. In exchange, states were required to keep individuals continuously enrolled in Medicaid, contributing to historic growth in Medicaid enrollment. High enrollment growth rates, tied first to the Great Recession, then ACA implementation, and later the pandemic, were the primary drivers of total Medicaid spending growth over the last decade (Figure 9). The continuous enrollment provision ended on March 31, 2023, and Medicaid enrollment growth has since declined and total spending growth has slowed.
Medicaid spending is also driven by other external factors and policy choices. Other external factors can include state fiscal conditions and the costs of providing health services and long-term care. In KFF’s latest annual budget survey, states reported inflation and workforce shortages were driving higher labor costs, resulting in pressure to increase provider rates. State policy choices include changes to eligibility, benefits, or provider reimbursement as well as delivery system reforms. Recent eligibility changes include the adoption of the ACA Medicaid expansion in seven states since 2020 as well as other expansions for children. KFF’s annual budget survey also found many states were implementing benefit enhancements, particularly for mental health and/or substance use disorder services, as well as authorizing a wide range of provider rate increases, particularly for direct care workers in nursing facilities and those providing home care to help address workforce shortages.