Eliminating the Medicaid Expansion Federal Match Rate: State-by-State Estimates
There are several options under consideration in Congress to significantly reduce Medicaid spending to help pay for an extension of expiring tax cuts. Medicaid is the primary program providing comprehensive health and long-term care to one in five people living in the U.S. and accounts for nearly $1 out of every $5 spent on health care. Medicaid is administered by states within broad federal rules and jointly funded by states and the federal government, meaning restrictions in federal Medicaid spending could leave states with tough choices about how to offset reductions. This analysis examines the potential impacts on states and Medicaid enrollees of one prominent proposal, which would eliminate the 90% federal match rate for the Affordable Care Act (ACA) expansion, which currently covers over 20 million people. Key takeaways include:
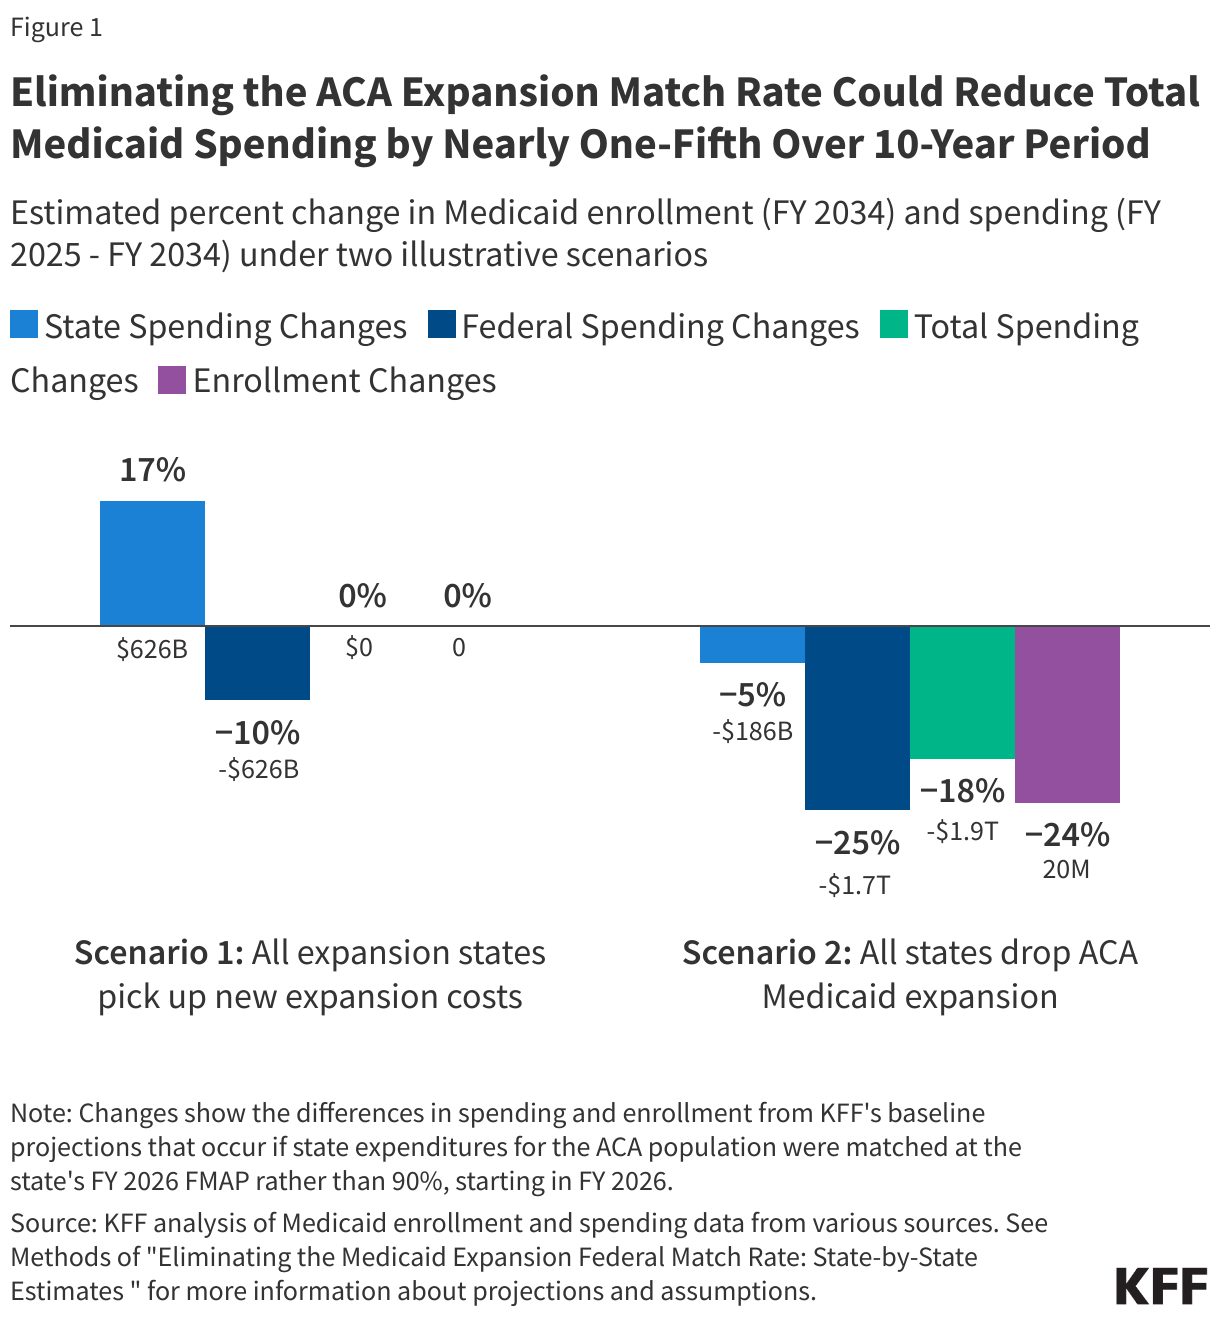
- This analysis explores the impact of eliminating the ACA expansion match rate under two scenarios. The first assumes that states maintain Medicaid expansion coverage and pick up new expansion costs, resulting in a decrease of 10% (or $626 billion) in federal Medicaid spending and an increase of 17% (or $626 billion) in state Medicaid spending across all states over a 10-year period.
- The second scenario assumes that states drop the ACA Medicaid expansion in response to the elimination of the 90% federal match rate. This would result in a 25% (or $1.7 trillion) decrease in federal Medicaid spending and a 5% (or $186 billion) decrease in state Medicaid spending across all states over a 10-year period. This would also cut total Medicaid spending by nearly one-fifth (or $1.9 trillion), and nearly a quarter of all Medicaid enrollees (20 million people) would lose coverage.
- Only states that have adopted the Medicaid expansion would see any spending or enrollment impacts under this policy proposal, though changes vary by state.
What is the proposed policy change?
States that have implemented the ACA Medicaid expansion currently receive a 90% federal match rate or “FMAP” for adults covered through the expansion, meaning the federal government pays 90% of the costs for expansion enrollees. The ACA expanded Medicaid coverage to nearly all adults with incomes up to 138% of the Federal Poverty Level ($21,597 for an individual in 2025). However, a Supreme Court ruling effectively made the decision to implement the Medicaid expansion an option for states. Forty-one states (including DC) have since adopted Medicaid expansion, and Medicaid expansion enrollees represent nearly a quarter of Medicaid enrollment (as of March 2024) and one-fifth of total Medicaid spending (as of FY 2023). The FMAP for services used by people eligible through traditional Medicaid is determined by a formula set in statute. The formula is designed so that the federal government provides a match rate of at least 50% and provides a higher match rate for states with lower average per capita income. For FY 2026, the traditional FMAP will range from 50% to 77%.
This analysis estimates the impact of eliminating the enhanced FMAP for adults in the Medicaid expansion. The analysis assumes that, starting in FY 2026, expenditures for people eligible in the Medicaid expansion would be matched at each state’s traditional 2026 FMAP rate. Details regarding the design of this policy change have yet to be released, and the details of proposed legislation may differ from the assumptions made to complete this analysis. This is also only one of the various Medicaid policy changes that have been suggested and estimates would change if multiple policies were considered together.
What are the potential impacts on Medicaid spending and enrollment?
This analysis does not make assumptions about specific state behavioral responses and instead examines the impact of eliminating the ACA expansion match rate under two scenarios. These scenarios are designed to illustrate the range of potential policy change effects; in practice, each state may respond to the policy change differently. While some states may choose to continue ACA Medicaid expansion coverage with substantially reduced federal funding, many likely would not given the extra spending that would be required. The analysis also excludes secondary effects such as people who lose coverage through the Medicaid expansion enrolling in Medicaid under other eligibility pathways or enrolling in private health coverage. The estimates presented here are not directly comparable to the estimates of federal savings from the Congressional Budget Office (CBO) because CBO’s estimates account for assumptions about state behavioral responses and other secondary effects.
- Scenario 1: All expansion states pick up new expansion costs. Expansion enrollment and total spending would remain constant while costs shift from the federal government to the states.
- Scenario 2: All states drop the ACA Medicaid expansion, resulting in changes to enrollment as well as total, federal, and state spending.
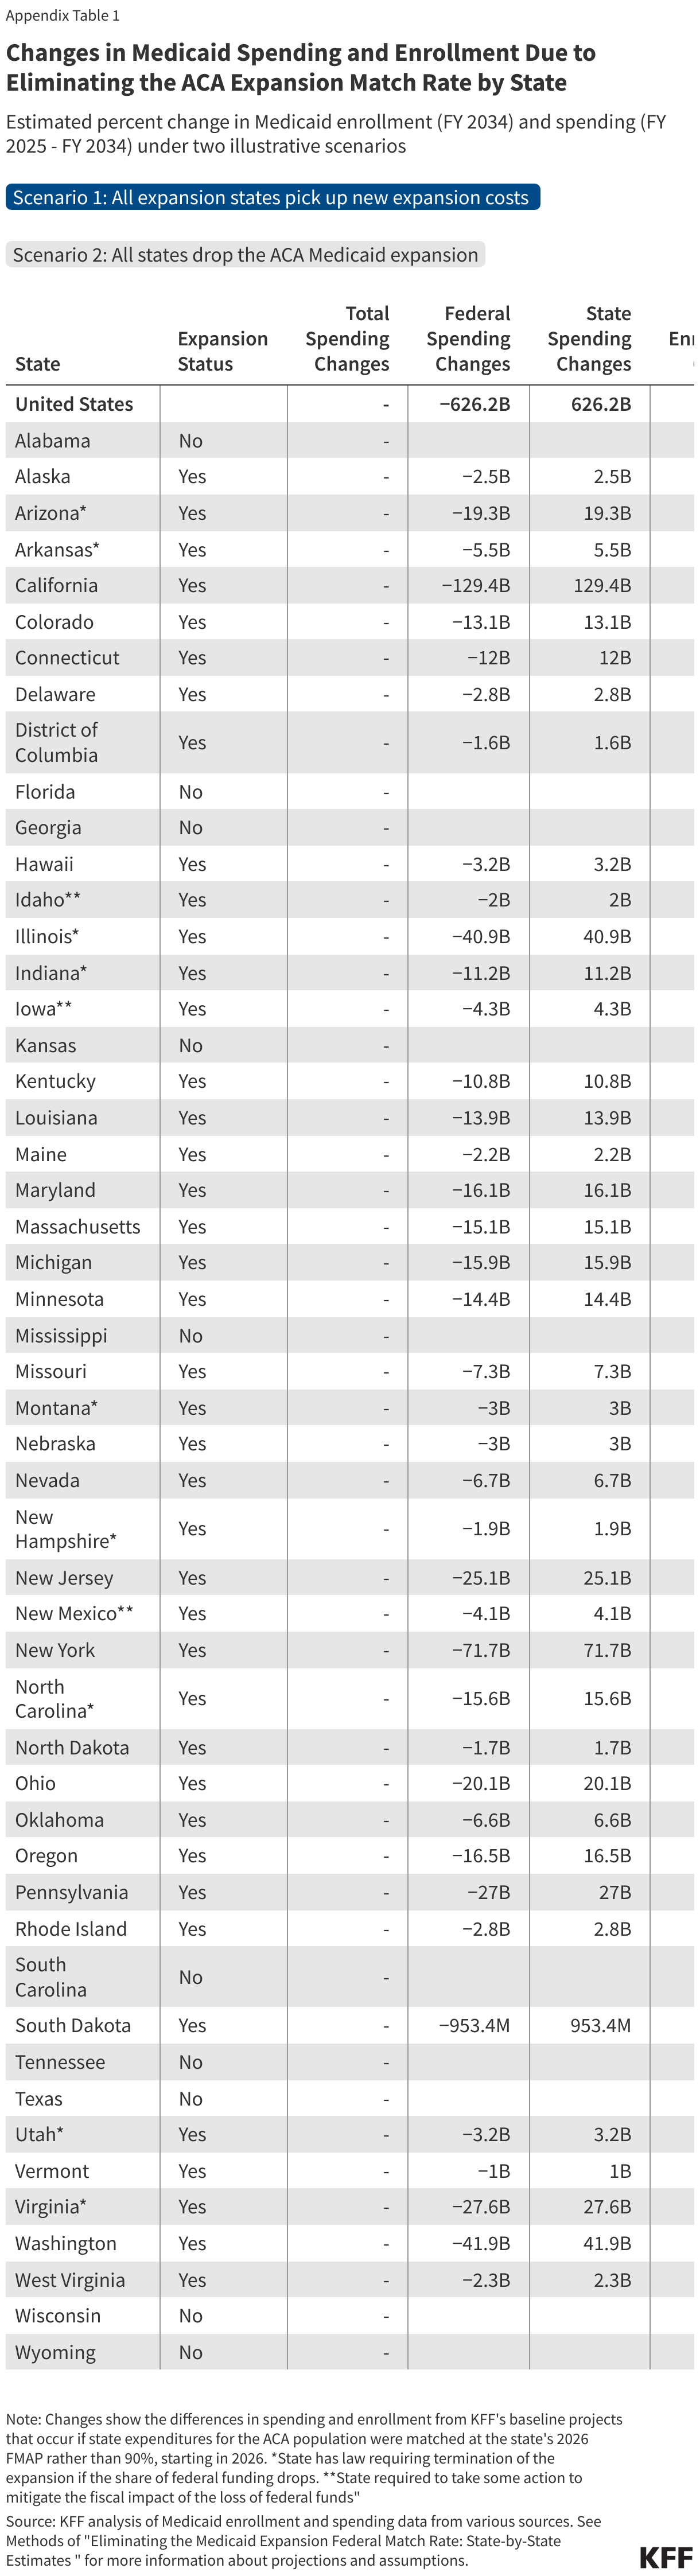
Eliminating the enhanced FMAP for adults in the Medicaid expansion could reduce Medicaid spending by nearly one-fifth ($1.9 trillion) over a 10-year period and up to nearly a quarter of all Medicaid enrollees (20 million people) could lose coverage. Under scenario 1, federal Medicaid spending would decrease by $626 billion or 10% across all states over the 10-year period, with the federal government providing matching funds at the standard rate rather than 90%. If all states picked up those costs and retained the Medicaid expansion, that would mean an additional $626 billion in state spending or a 17% increase in state spending across all states over the 10-year period. Under scenario 2, all state and federal financial support for Medicaid expansion is withdrawn, resulting in a $1.7 trillion dollar or 25% cut to federal Medicaid spending and a $186 billion dollar or 5% cut to state Medicaid spending across all states, including non-expansion. Combined, Medicaid spending would decrease by 18% or $1.9 trillion over the 10-year period. The cuts are even larger when looking among expansion states alone, resulting in a 31% decline in federal spending, a 6% decline in state spending, and a 22% decline in total spending. Under this scenario, an estimated 20 million Medicaid enrollees eligible through expansion would lose coverage, decreasing total Medicaid enrollment by 24% (by year 10).
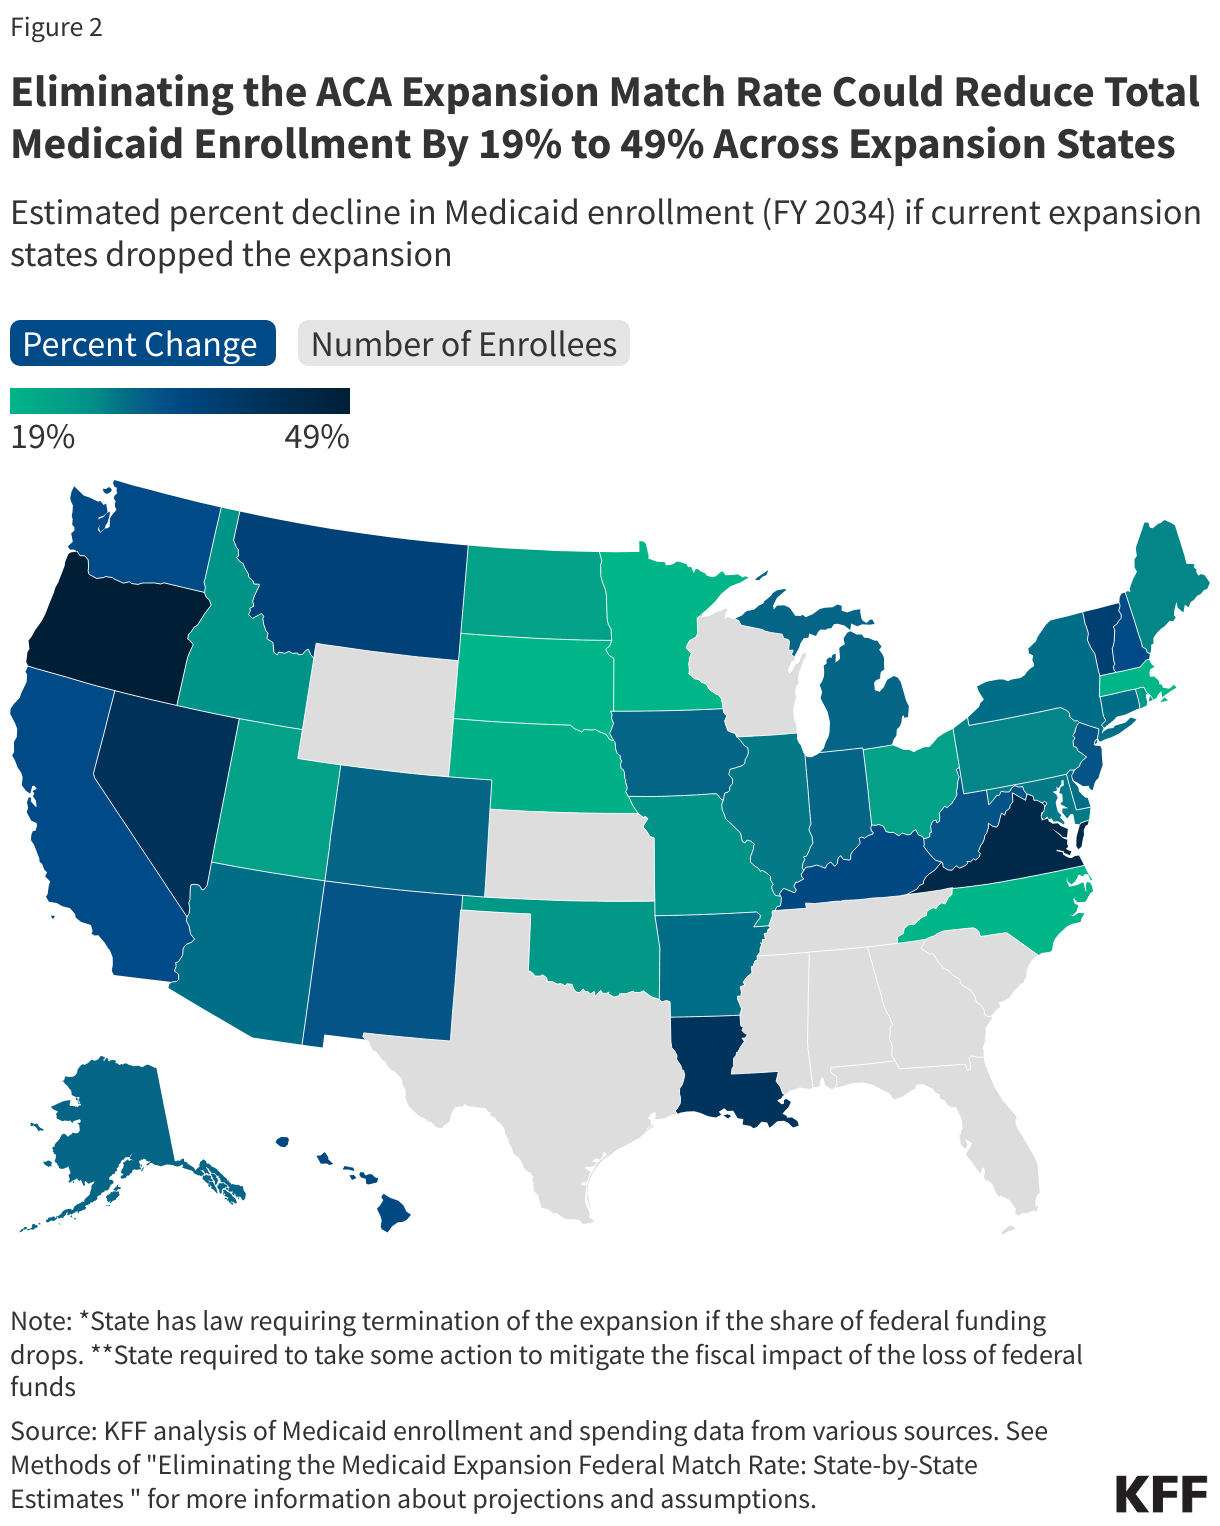
Only states that have adopted the Medicaid expansion would see any spending or enrollment impacts under this policy proposal, though changes vary by state (Figure 2 and Appendix Table 1). The 10 states, primarily in the South, that have not expanded Medicaid under the ACA would see no change. Enrollment under scenario 1 would not change from baseline projections with states picking up the extra cost, but enrollment declines under scenario 2 vary by state, ranging from a decrease in estimated total Medicaid enrollment by year 10 of 19% in Massachusetts, Minnesota, North Carolina, and South Dakota to 49% in Oregon. The number of enrollees that could lose coverage ranges from 5 million in California to 24 thousand in North Dakota and South Dakota. (This analysis includes all states that had expanded Medicaid as of February 2025. In practice, there could also be effects in states that expand Medicaid in the years after 2025. In its baseline projections of Medicaid enrollment and spending, CBO assumes some states will continue to expand Medicaid but does not specify which states those are.)
What are other implications to consider?
Twelve states currently have “trigger” laws in place that would automatically end expansion or require changes if the federal match rate were to drop, but coverage would be at risk in other states given the substantial loss of federal funding. Not all trigger laws would immediately end the Medicaid expansion, but enrollees in states with trigger laws are at greater risk of losing coverage. States are actively debating their Medicaid expansion trigger laws, with some states working to remove and others working to establish the automatic termination of Medicaid expansion coverage if federal support declines.
If states maintained their Medicaid expansion coverage in the wake of this policy change, they would need to find ways to offset the loss of federal funding. This could include increasing state tax revenues or decreasing spending on non-Medicaid services such as education, which is the largest source of expenditures from state funds. States could alternatively decrease Medicaid coverage for other groups, eliminate coverage of optional benefits such as prescription drugs and home care, or reduce provider payment rates. Given the size of the federal funding cut, states would face significant challenges in efforts to replace the loss of federal funds, which would be exacerbated if paired with other reductions in federal funding for Medicaid or in other areas such as education.
If states are unable to maintain Medicaid expansion coverage (or terminate expansion due to a trigger law), the number of uninsured would increase and could reverse gains in financial security, access to care, and health outcomes associated with Medicaid expansion. In all states, some of the people who lose expansion eligibility may qualify for Medicaid under a different eligibility pathway, for example based on a disability, but some of those people may only qualify for partial Medicaid benefits such as coverage of family planning services or breast and cervical cancer screening and prevention. Other enrollees with incomes between 100% and 138% of poverty could be eligible for coverage through the ACA marketplaces, but ACA coverage will soon become more costly for enrollees if the enhanced subsidies expire at the end of 2025. Enrollees with incomes below poverty could fall into the coverage gap. Research shows that after losing Medicaid, many people become uninsured. Increasing numbers of uninsured people could lead to loss of revenues and increased uncompensated care costs for providers. A large body of prior research shows that Medicaid expansion has helped to reduce the uninsured rate and improve health care access, affordability, and financial security among the low-income population. More recent research shows improvements in health outcomes and continues to show positive effects for providers (particularly rural hospitals) and for sexual and reproductive health. Because of the widespread adoption of the Medicaid expansion across states, the financial and coverage impacts will fall on states that voted for President Trump and those that voted for former Vice President Harris.
Appendix
Methods
Data: To project Medicaid enrollment, spending, and spending per enrollee by state and eligibility group, this analysis uses the Medicaid CMS-64 new adult group expenditure data collected through MBES for FY 2023 (downloaded in December 2024), Medicaid new adult group enrollment data collected through MBES for June 2024 (downloaded in December 2024), the 2019-2021 T-MSIS Research Identifiable Demographic-Eligibility and Claims Files, and the June 2024 Congressional Budget Office (CBO) baseline.
Overview of Approach:
- Develop baseline projections of Medicaid enrollment, spending, and spending per enrollee by state and eligibility group from FY 2025 through FY 2034 (a 10-year period). This model estimates Medicaid enrollment and spending under the status quo with no policy changes.
- Estimate Medicaid enrollment, spending, and spending per enrollee by state and eligibility group over the same 10-year period after accounting for the effects of proposed policy changes.
- Calculate differences in Medicaid enrollment, spending (including federal, state, and total spending), and spending per enrollee in the policy change scenario relative to the baseline projections.
- The estimates do not predict states’ responses to federal policy changes, but we examine differences in Medicaid enrollment, spending, and spending per enrollee under different scenarios to reflect the range of outcomes depending on state responses.
Definitions and Limitations:
- At the time of publishing, CBO had released their January 2025 baseline. However, this analysis uses CBO’s June 2024 baseline because it was the most recent baseline with spending projections by Medicaid eligibility group.
- The estimates assume that all states experience the same growth rates for Medicaid enrollment and spending; and that total spending grows at the same rate as federal spending.
- FMAP calculations do not account for the other services that are matched at a higher rate, which include family planning, services received through an Indian Health Services facility, expenditures for Medicare beneficiaries enrolled in the “Qualifying Individuals” program, and health home services that are matched at a 90% rate. For this reason, the model may underestimate the federal share of spending in some states.
- Estimates of total spending include all spending that is matched as medical assistance but exclude states’ administrative costs which are matched at a separate rate. Federal payments for administrative costs are less than 4% of total federal spending, according to the CBO June 2024 baseline.
- The analysis does not account for secondary effects or people’s behavioral responses.
- The analysis does not include policy effects for states that had not expanded Medicaid under the ACA as of February 2025 but would have done so in the absence of the policy change.
- We implement the policy change scenarios in FY 2026 and assume they take effect immediately.
We provide more details about the baseline model below.
- Estimate initial Medicaid spending and enrollment by eligibility group using the most recent years’ data available (FY 2023 for spending data and FY 2024 for enrollment data).
- First, we pull the quarterly Medicaid CMS-64 new adult group expenditure data collected through MBES for FY 2023 and aggregate total spending by state for enrollees in the ACA expansion group and for all other Medicaid enrollees. Spending reflects an accrual basis of accounting.
- We exclude spending on DSH by calculating the share of spending on DSH from the FY 2023 CMS-64 Financial Management Report and reducing medical assistance among non-expansion enrollees by that share.
- Separately, we pull the Medicaid new adult group enrollment data collected through MBES for June 2024. This data includes enrollment by state and is broken into ACA expansion group enrollees and all other Medicaid enrollees. MBES enrollment includes individuals enrolled in limited benefit plans and only includes individuals whose coverage is funded through Medicaid (not CHIP).
- To obtain spending and enrollment estimates across the remaining eligibility groups (seniors, individuals with disabilities, children, and other adults), we apply the distribution of spending and enrollment across the groups and by state from T-MSIS to the FY 2023 spending data and June 2024 enrollment data. We use the average distribution from 2019 to 2021 to mitigate the impact of the continuous enrollment provision (data in states denoted as “unusable” for a given year by the DQ atlas were excluded from the averages).
- Calculate initial spending per enrollee in FY 2024.
- We grow Medicaid spending in FY 2023 by CBO’s growth rates for federal benefit payments by eligibility group to get Medicaid spending in FY 2024. The June 2024 enrollment data is used as our FY 2024 enrollment.
- We divide Medicaid spending in FY 2024 by Medicaid enrollment in FY 2024 (for each state and eligibility group) to get Medicaid spending per enrollee in FY 2024.
- Project total spending and spending per enrollee for fiscal years 2025 through 2034 using CBO growth rates and use those estimates to calculate future years’ enrollment.
- Starting with spending data for FY 2024, we apply the CBO growth rates to estimate Medicaid spending in FY 2025 through FY 2034.
- Starting with per enrollee spending in FY 2024, we apply the CBO growth rates for average federal spending on benefit payments per enrollee to estimate Medicaid spending in FY 2025 through FY 2034.
- We calculate enrollment growth in FY 2025 through FY 2034 by dividing estimated Medicaid spending by estimated spending per enrollee.
- Split total Medicaid spending over the 10-year period into federal and state spending.
- We calculate federal and state spending by using a 90% match rate for the ACA expansion group and the traditional state FMAPs for the remaining eligibility groups. We use the FY 2025 FMAPs for FY 2025 and FY 2026 FMAPs for FY 2026 and beyond.
We provide more details about the policy change scenarios below.
- Calculate spending and enrollment under scenario 1 (ACA expansion states pick up new expansion costs) by state.
- Assume expansion enrollment and total spending remain the same as the baseline model over the 10-year period.
- Split total Medicaid spending (from baseline) into federal and state spending. We assume the policy change takes effect in FY 2026, so FY 2025 federal and state spending is the same as baseline.
- Starting in FY 2026, we apply the 2026 traditional state FMAPs to the expansion group spending instead of the 90% rate to split total spending into the federal and state share. For the expansion group, spending shifts from the federal to state governments. Spending for all other eligibility groups remains unchanged.
- Calculate spending and enrollment under scenario 2 (all states drop the ACA Medicaid expansion) by state.
- Expansion enrollment is reduced to zero for FY 2026 – FY 2034, leading to zero total spending for expansion enrollees for FY 2026 – FY 2034.
- Spending and enrollment for all other eligibility groups remains unchanged.
- Calculate differences in Medicaid enrollment and spending (including federal, state, and total spending) relative to the baseline projections.
