What do different data sources tell us about Medicaid and work?
A central question in the ongoing debate about imposing work requirements in Medicaid is what current work patterns are among Medicaid adults and how many so-called “able bodied” adults are not already working. Answers to these questions rely on various data sources, and characteristics of the underlying data and analytic decisions may lead to different conclusions. This data note examines what different data sources and analytic decisions tell us about Medicaid and work.
Range of Estimates
Widely-cited estimates from the Kaiser Family Foundation indicate that more than six in ten (62%) non-SSI, non-dual eligible, nonelderly adults covered by Medicaid work either full or part-time. These estimates draw from the 2017 Current Population Survey (CPS) and capture, post-ACA, anyone with Medicaid in 2016 who worked during 2016. In contrast, recent estimates from the White House Council of Economic Advisers use the 2014 Survey of Income and Program Participation (SIPP) to indicate that, among non-disabled, non-elderly adults with Medicaid, 47% worked full- or part-time in December 2013, before the ACA expansion population was added.
Work Status After the ACA
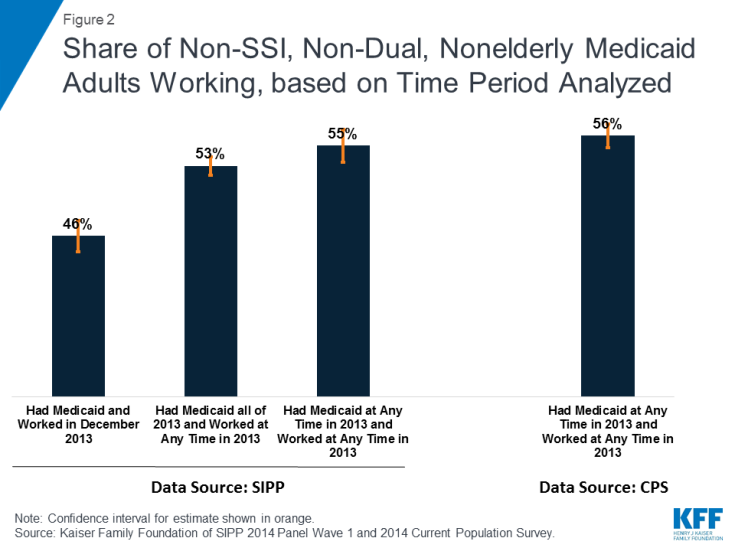
One reason for differences between estimates is the time period included in the analysis. The Affordable Care Act (ACA) extended Medicaid eligibility to many low-income workers as of 2014 by expanding eligibility to adults with income up to 138% of poverty in states that expanded. An individual working full-time (40 hours/week) for the full year (52 weeks) at the federal minimum wage ($7.25 per hour) would earn an annual salary of just over $15,000 a year, or about 125% of poverty, below the maximum targeted by the ACA Medicaid expansion. In addition, improving economic conditions over the past several years have led to a drop in the unemployment rate, from 6.7% in December 2013 to 4.7% in December 2016. As a result of these changes, the share of non-SSI, non-dual, nonelderly adults with Medicaid who work increased significantly after 2013 (Figure 1), rising from 56% before the ACA expansion to 62% in 2016, according to analysis of the CPS. Other analysis of CPS, which enables state-level estimates, found that in 2016, work rates were higher among adults in states that expanded Medicaid compared to those that did not. Data that does not reflect the changing composition of Medicaid adults after the ACA expansion likely understates work rates among Medicaid adults.
Work Status in 2013
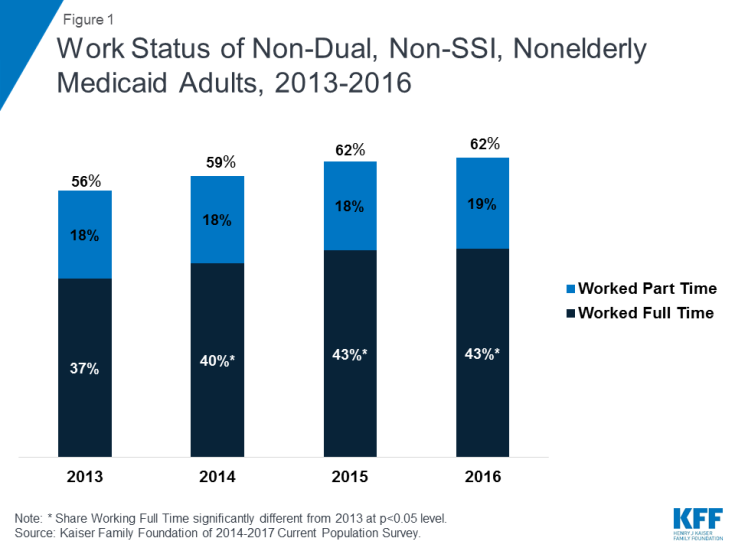
Another reason for the difference between estimates of work rates is the analytic decision of what reference period to use when measuring either Medicaid coverage or work. The CEA analysis of SIPP looks at coverage and work within a single month (December 2013), providing a snapshot of work and coverage. Our analysis of SIPP, using similar parameters,1 similarly finds that less than half (46%) of non-SSI, non-dual, nonelderly adults who had Medicaid in December 2013 worked in that month (Figure 1). Looking at a given month, however, overlooks the fact that many low-income people move in and out of work over the course of a year. When we analyzed SIPP to look at work rates among adults who had Medicaid for the entire year in 2013, a much higher share of Medicaid adults (53%) worked at some point in the year (Figure 2). Other analysis of SIPP also has found that working Medicaid-eligible adults may have inconsistent work hours over the course of a year, even though their total annual hours worked is high. Given the nature of jobs that Medicaid adults typically hold—such as service jobs in the restaurant industry, home health or health care aides, retail sales or cashiers, or janitors or maids—it is not surprising that employment or hours worked may be unstable or inconsistent for this group.

Figure 2: Share of Non-SSI, Non-Dual, Nonelderly Medicaid Adults Working, based on Time Period Analyzed
Further analysis of SIPP to match the reference period for the CPS shows very similar results for work in 2013. The current CPS does not enable analysis of monthly health insurance coverage but instead captures anyone who had Medicaid at any point in the year. Analysis of SIPP using these parameters (that is, any Medicaid coverage during the year) and a similar reference period for work (any work during the year) shows that 55% of non-SSI, non-dual, nonelderly Medicaid adults worked, a difference that is not statistically significantly different from those with Medicaid all year. Our estimates from CPS for 2013 show that 56% of non-SSI, non-dual, nonelderly Medicaid adults worked in 2013, a rate very similar to the corresponding value for SIPP, indicating that the two surveys appear to be similarly measuring coverage and work.
Implications
All data sources have some limitations, whether they are precision of estimates, timeliness of data, or ability to capture state-level data, and analysts weigh these issues when considering which data source to use. In addition, analytic decisions matter in final estimates and in how those estimates should be interpreted. Outdated data or data that captures only a snapshot of a fluid relationship may not provide a full picture of work patterns among the Medicaid population. In addition, looking at work rates in isolation misses important aspects of the relationship between Medicaid and work, including substantial health-related barriers to work among those not working, likely exemptions among those not working, and potential coverage losses even among those complying with work requirements.
Endnotes
Our estimated work rate for December 2013 (46%) differs slightly from the CEA estimate (47%), perhaps due to our exclusion of all dual eligible individuals versus just those receiving SSI, SSDI, or VA disability benefits.

