Congressional District Interactive Map: Medicaid Enrollment by Eligibility Group
Medicaid is the primary program providing comprehensive health and long-term care to 81 million people living in the U.S. (particularly those with low incomes) and accounts for nearly $1 out of every $5 spent on health care. Last year, Congress enacted the 2025 reconciliation law, which made major changes to Medicaid. Shortly after enactment, the Congressional Budget Office (CBO) estimated the new law would reduce federal spending on Medicaid by $911 billion over the 2025-2034 period and that it would increase the number of people without health insurance by 10 million in 2034. Reductions in federal Medicaid spending could leave states with tough choices on how to offset the loss of spending through cuts to Medicaid, cuts to other programs, or tax increases. The impacts of the changes will vary across states and will be especially substantial for states that have expanded Medicaid under the Affordable Care Act (ACA).
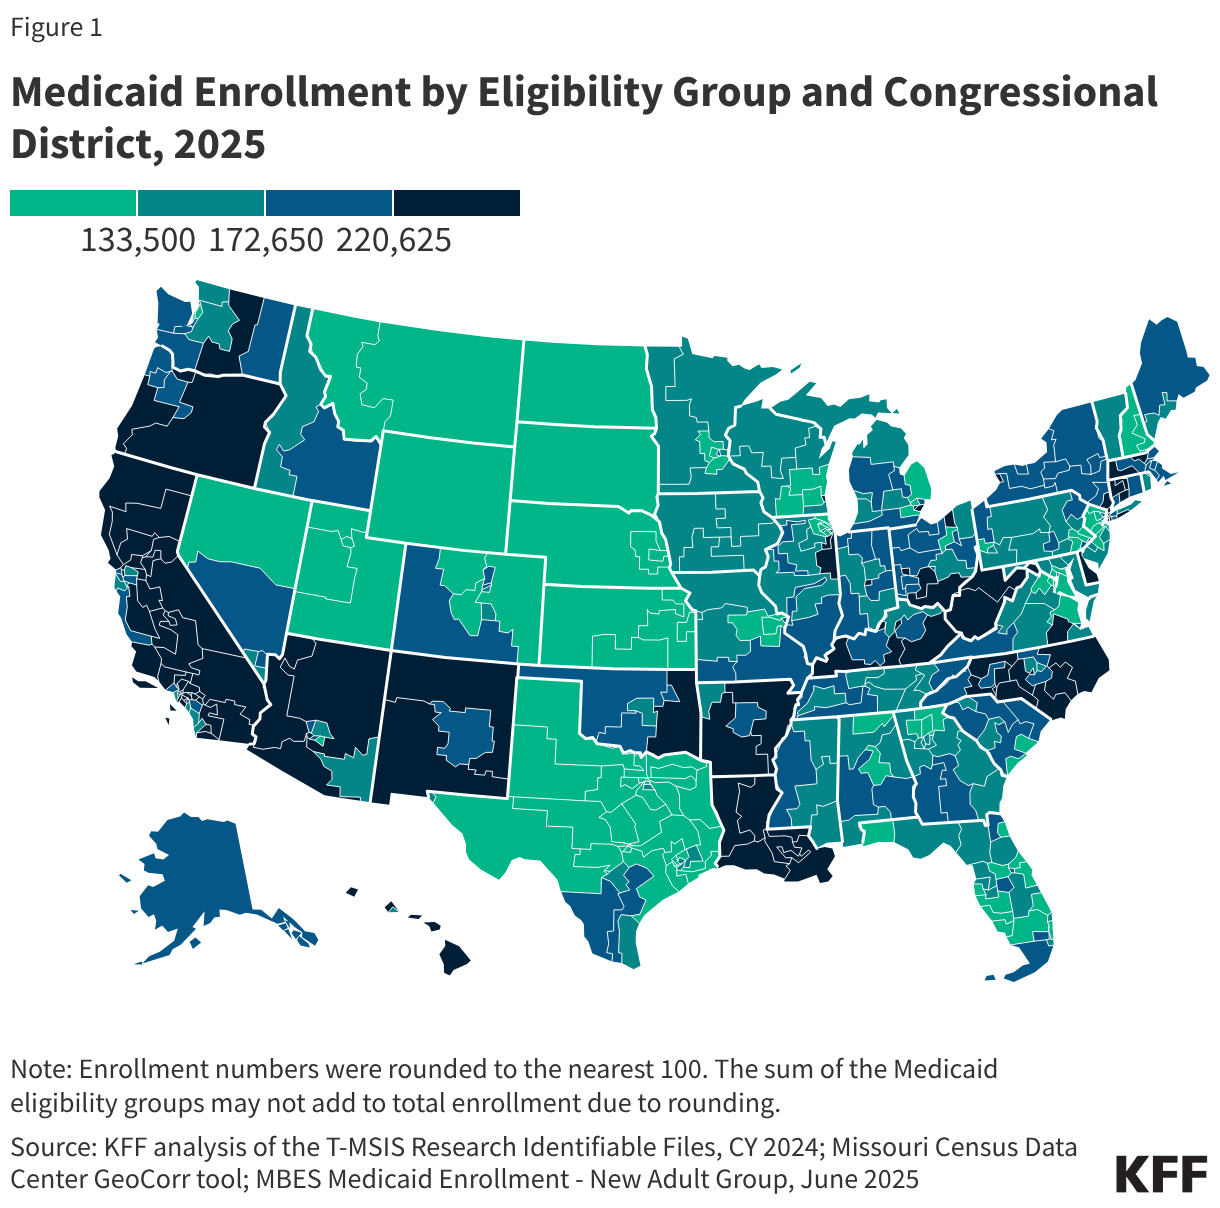
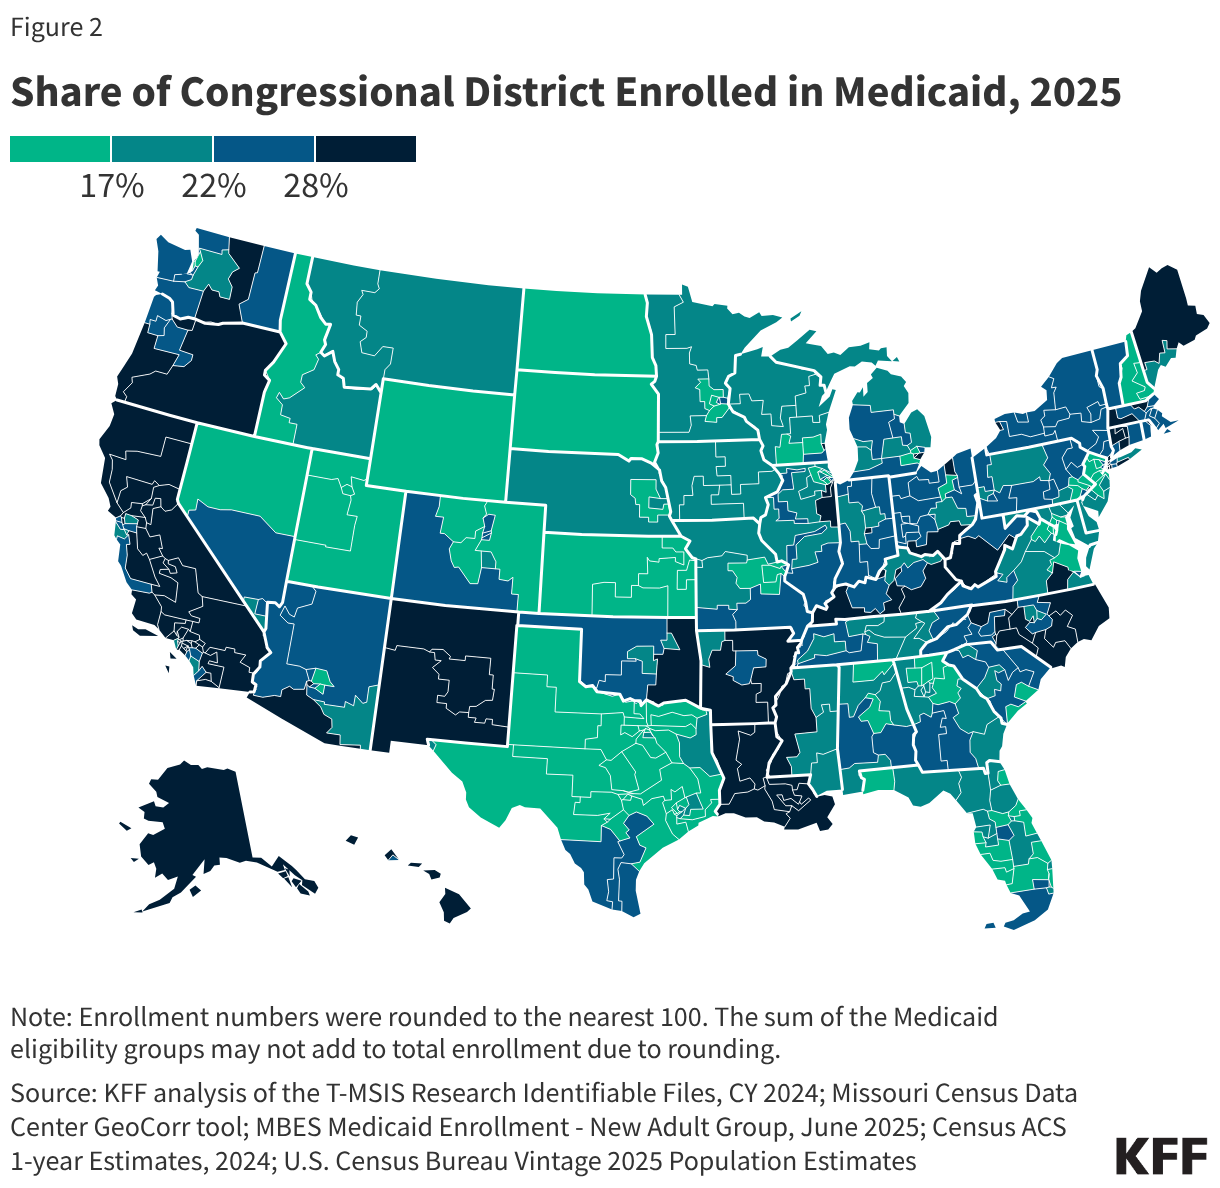
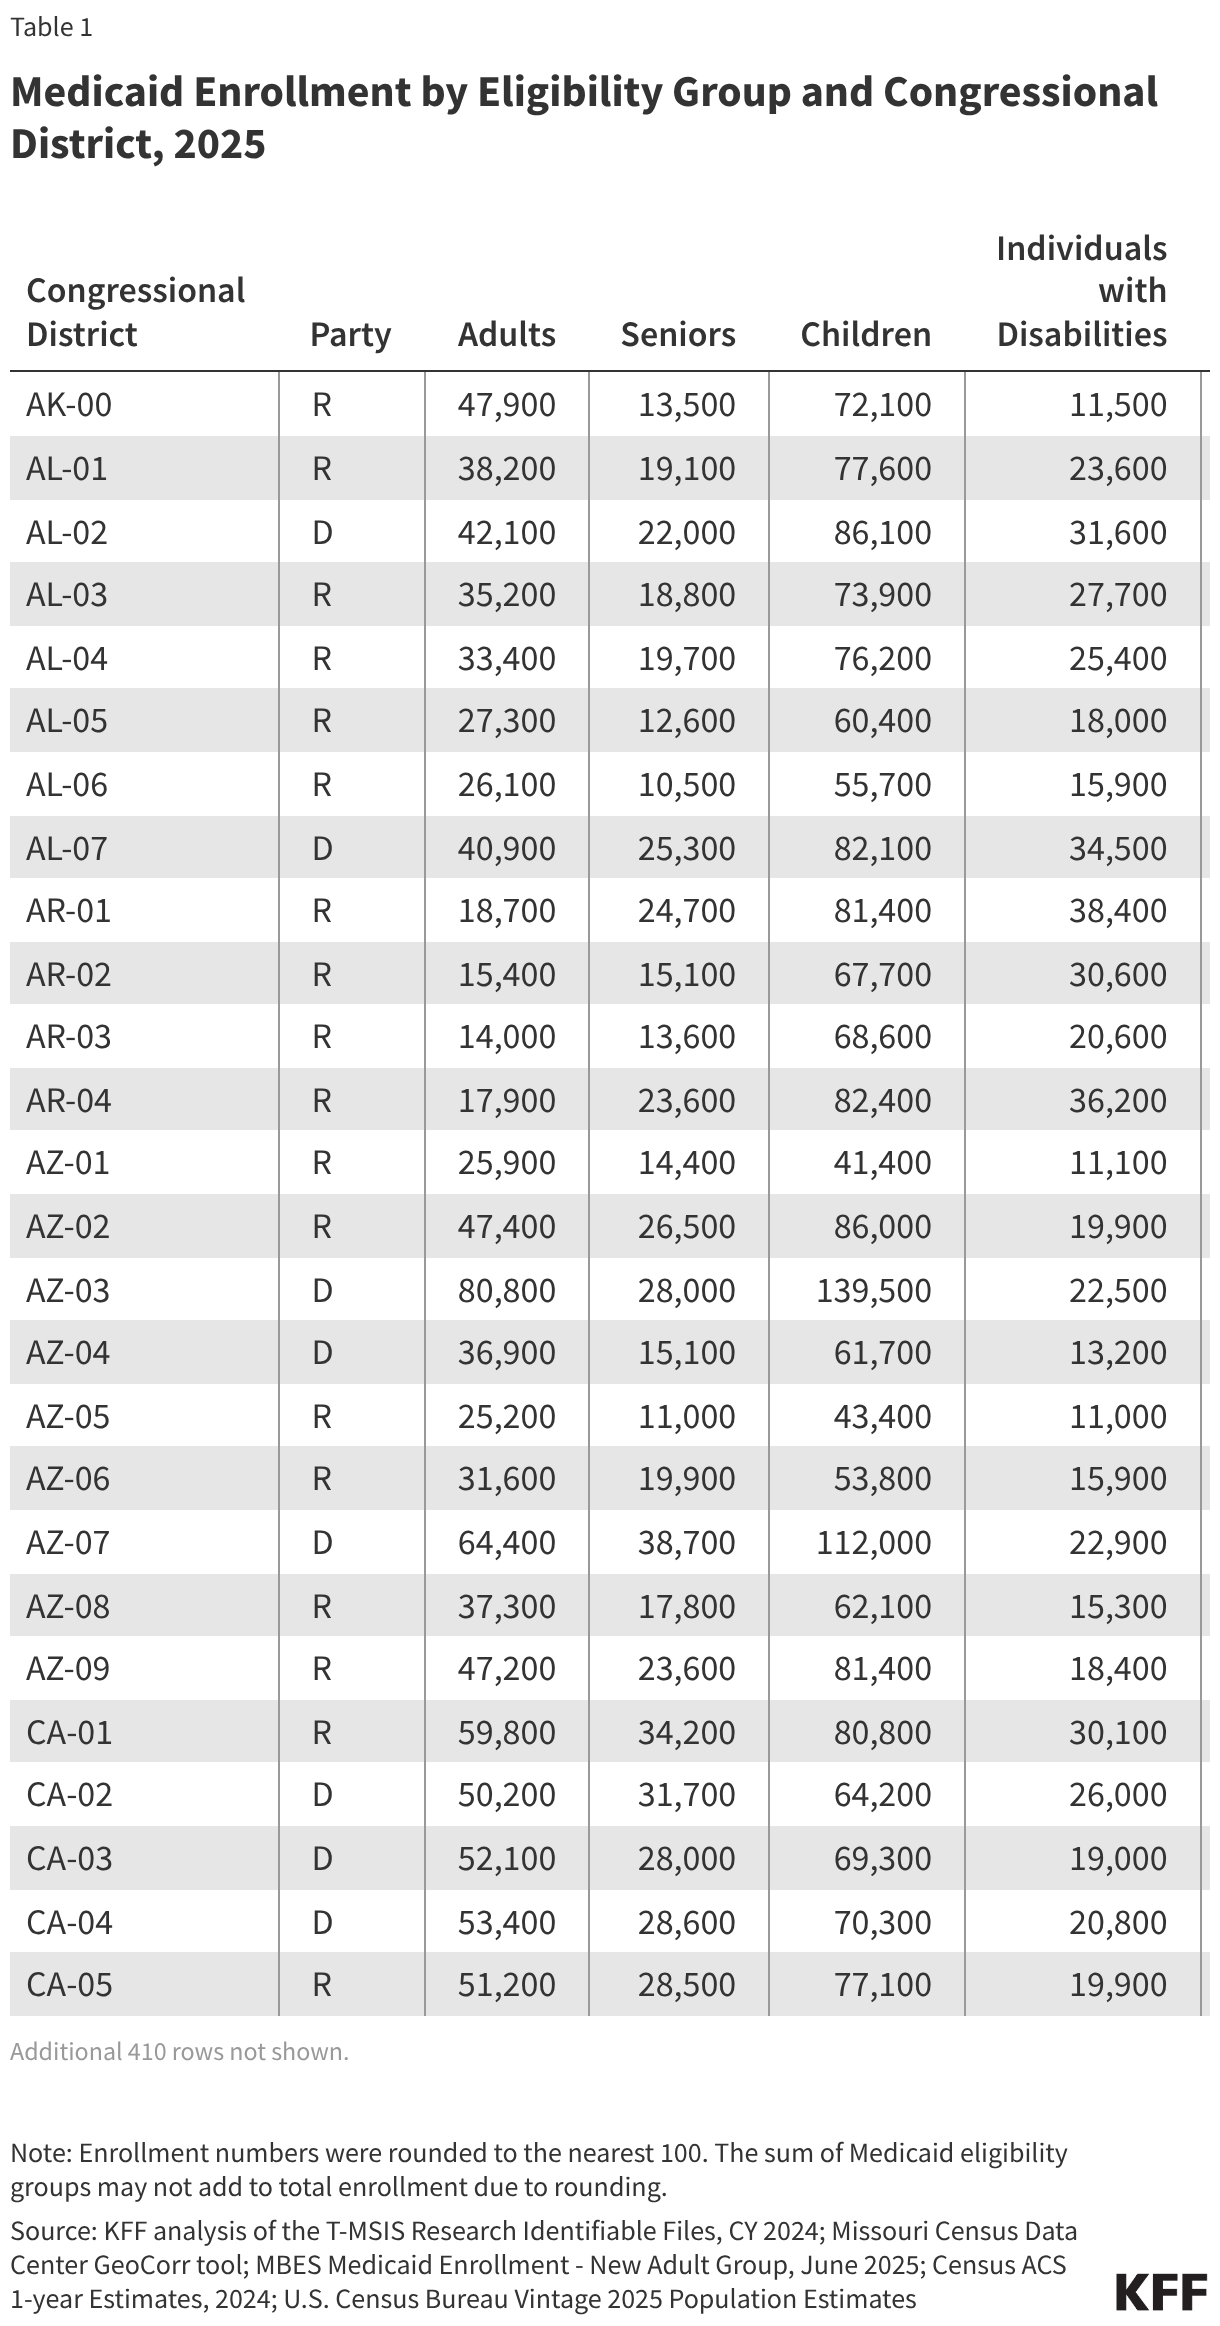
As the 2026 midterms approach, health care costs remain voters’ top health priority and economic worry. The interactive maps below illustrate how many people are enrolled in Medicaid in 2025 and what percentage of the population is enrolled in Medicaid for each congressional district. Enrollment numbers include enrollment in each of the major Medicaid eligibility groups. The analysis uses Medicaid administrative data to estimate Medicaid enrollment by eligibility group and Census data to estimate congressional district populations. Political affiliation refers to the party of the current incumbent. See Methods for more details. Key takeaways include:
- There are 52,900 or more Medicaid enrollees living in each congressional district, with enrollment as high as 496,500 in a district. In each congressional district, there are at least 3,600 Medicaid enrollees ages 65 and older, 3,900 enrollees eligible because of a disability, 7,500 child enrollees, and 6,600 other adult enrollees.
- In half of all Republican congressional districts, 20% or more of the population is enrolled in Medicaid, and in half of all Democratic districts, 25% or more of the population is enrolled in Medicaid.
- Republican districts have a higher share of Medicaid enrollees who are children or eligible because of a disability, compared with Democratic districts which have a higher share of expansion enrollees and adults ages 65 and older. However, this varies by specific district and depends on whether a state has adopted the Medicaid expansion; there are both Democratic and Republican districts with high shares of ACA expansion enrollees.
- The top 10 Republican districts with the highest number of Medicaid enrollees are: CA-22 (496,100); CA-23 (375,200); LA-05 (347,200); CA-20 (324,100); NY-11 (313,900); LA-03 (312,700); KY-05 (311,000); LA-04 (302,200); CA-01 (298,000); and WV-01 (289,000).
- The top 10 Democratic districts with the highest number of Medicaid enrollees are: NY-15 (496,500); CA-21 (450,600); CA-43 (449,400); CA-37 (431,500); CA-13 (427,900); CA-34 (426,200); NY-14 (419,200); NY-13 (404,500); CA-29 (395,800); and NY-08 (374,900).
Methods
Data: To calculate Medicaid enrollment by eligibility group and congressional district, this analysis uses the 2024 Transformed Medicaid Statistical Information System (T-MSIS) Research Identifiable Demographic-Eligibility and Claims Files, the Missouri Census Data Center’s GeoCorr 2022 data (downloaded in September 2026), the Medicaid new adult group enrollment data collected through the Medicaid Budget and Expenditure System (MBES) for June 2025 (downloaded in August 2026), the Census American Community Survey (ACS) 1-Year Estimates, 2024 (downloaded in August 2026), and the U.S. Census Bureau Vintage 2025 Population Estimates (downloaded in September 2026).
Assigning Medicaid Enrollees to Congressional Districts: This analysis used the Missouri Census Data Center’s GeoCorr tool to create a zip code-to-congressional district crosswalk. Using the crosswalk, Medicaid enrollees were assigned to congressional districts in the T-MSIS data.
In some cases, a zip code can be split among multiple congressional districts. In those cases, enrollees were randomly assigned to a congressional district based on a zip code-to-congressional district allocation factor from the GeoCorr tool that is calculated using the 2020 decennial census.
The analysis applied the T-MSIS distributions of enrollees in eligibility groups and congressional districts to the MBES administrative enrollment data. Those data report enrollment for adults eligible through the Affordable Care Act (ACA) and for all other Medicaid enrollees on a quarterly basis.
Calculating Congressional District Population: To estimate 2025 congressional district population, two approaches were used: one for states that were redistricted and another for states that did not redistrict.
Redistricted states: GeoCorr 2022’s county-to-congressional district population distributions were used to estimate the share of each county’s population in each congressional district. County crosswalks were used instead of zip code as Census data does not report population estimates at the zip code level. County population totals from the Census Bureau Vintage 2025 Population Estimates were applied to those distributions and summed to the congressional district level. The states that redistricted are Alabama, California, Florida, Louisiana, North Carolina, Ohio, Tennessee, Texas, and Utah.
Non-redistricted states: ACS 2024 congressional district populations were used to estimate the share of state population in each congressional district, and then those shares were applied to the Census Bureau Vintage 2025 state population estimates.
Assigning Political Party to Congressional Districts: The political party of the current incumbent was used to assign political party affiliation to each congressional district. For vacant congressional seats, FL-20 and TX-23, the Cook Political Report projections for the districts (accessed September 2026) were used instead. Their political affiliations are Democrat and Republican, respectively.