Key Facts About Hospitals

This analysis presents key facts to inform policy discussions about hospitals and hospital spending in the following categories:

Overview

Introduction

Copy link to Introduction

Hospitals account for nearly one third (31%) of total health care spending—$1.5 trillion in 2023—with expenditures projected to rise rapidly through 2032, contributing to higher costs for families, employers, Medicare, Medicaid, and other public payers. In the past, policymakers have looked to reduce spending on hospital care as part of broader efforts to make health care more affordable and reduce the federal deficit and national debt. For example, Republican lawmakers recently floated a number of proposals that could directly or indirectly affect the more than 6,000 hospitals across the country, including major reductions in Medicaid spending, reductions in Medicare spending for uncompensated care and bad debt, establishing site-neutral payments that would achieve Medicare savings by aligning payment rates for a given service across different sites of care, and eliminating federal tax-exempt status for nonprofit hospitals.

Reducing federal spending on hospital care would inevitably involve tradeoffs. On the one hand, doing so could reduce the federal deficit, help offset the cost of a tax bill or other policy priorities, and promote efficiencies. Some options that reduce Medicare reimbursement may also lead to lower beneficiary cost-sharing requirements and premiums. On the other hand, reducing federal payments to hospitals could shift costs onto patients and lead hospitals to offer fewer services—which may result in patients not getting need care—or poorer quality of care. Absorbing reductions in federal spending could be especially challenging for hospitals that are financially vulnerable, such as rural and safety-net hospitals

This analysis presents key facts about hospitals to inform policy discussions about hospitals and hospital spending. Topics include national spending on hospital care, characteristics of the hospital industry, rural hospitals, use of hospital care, out-of-pocket spending and medical debt, hospital prices, hospital finances, and charity care. (For additional information about the data used, see Data Sources.)  

National Hospital Spending

National Spending on Hospital Care

Copy link to National Spending on Hospital Care

Spending on hospital care totaled $1.5 trillion in 2023, representing nearly one third (31%) of national health expenditures in that year. Spending on hospital care was the single largest source of national health expenditures in 2023. Hospital care includes both inpatient services and outpatient services (like imaging services or surgical procedures that do not require an overnight stay). Other categories that account for a large share of national health expenditures include spending on physician and clinical services (20%) and retail prescription drugs (9%). (See the Peterson-KFF Health System Tracker for more on national health expenditures.)

Spending by Payer

Copy link to Spending by Payer

Private health insurance accounted for more than a third of spending on hospital care in 2023 (37%), followed by Medicare (25%) and Medicaid (19%). Private insurance includes coverage offered by employers and insurance purchased through the Affordable Care Act (ACA) health insurance Marketplaces and elsewhere. The federal government subsidizes private insurance through favorable tax treatment for employer-sponsored coverage and through subsidies for coverage purchased through the Marketplaces.

Medicare spending—which is financed by the federal government—includes hospital care provided by traditional Medicare and Medicare Advantage plans. Medicaid spending—which is jointly financed by states and the federal government—includes hospital care provided by fee-for-service Medicaid and Medicaid managed care plans. Federal, state, and local governments also cover hospital spending through other programs, such as the Veterans Health Administration, which is administered by the federal government.

Patient out-of-pocket spending accounted for a relatively small share of hospital spending (3%), though individuals also contribute to hospital spending through health insurance premiums, taxes, and lower wages. 

Spending as Percentage of GDP

Copy link to Spending as Percentage of GDP

Spending on hospital care as a percent of gross domestic product (GDP) is projected to increase from 5.5% in 2023 to 6.0% in 2032. Hospital spending as a share of GDP more than tripled from 1.7% in 1960 to 5.4% in 2010. Between 2010 and 2019, hospital spending as a share of GDP was relatively flat, but spiked in 2020 (i.e., the first year of the COVID-10 pandemic). The share eventually fell below 2019 pre-pandemic levels in 2022 before increasing to 5.5% in 2023, a year that marked the fastest growth rate of hospital spending (10.4%) since 1990. Hospital spending is projected to increase from 5.5% of GDP in 2023 to 6.0% in 2032.

Medicare and Medicaid Spending

Copy link to Medicare and Medicaid Spending

Hospital care accounted for about one third of Medicare and Medicaid spending in 2023 (37% and 32%, respectively). For purposes of comparison, hospital care represented a larger share of Medicare and Medicaid spending (37% and 32%, respectively) than physician and clinical services (25% and 14%) or retail prescription drugs (14% and 6%). Medicare is financed by the federal government while Medicaid is jointly financed by states and the federal government (Medicaid data include expenditures from both). Because hospital care accounts for a large share of Medicaid and Medicare expenditures, it is likely that any large reductions in program spending would impact hospitals. Policies that reduce spending on hospital care could involve tradeoffs, for example, to the extent that they lead hospitals to offer fewer services, reduce staff, or make other cuts, which could result in patients not getting needed care or in poorer quality of care.

Back to top

The Hospital Industry

Number of Hospitals

Copy link to Number of Hospitals

Most of the 6,093 hospitals in the United States (84%) are community hospitals. Community hospitals are short-term, non-federal, general and specialty hospitals that are open to the general public. While the majority of community hospitals are general medical and surgical hospitals (83%; not shown), the category also includes certain rehabilitation hospitals, acute long-term care hospitals, children’s hospitals, cancer hospitals, and other hospitals (such as rural emergency hospitals and surgical hospitals). Non-community hospitals include federal hospitals, like Veterans Affairs hospitals, and non-federal psychiatric hospitals, among other types (such as non-federal long-term care hospitals).

Openings and Closings

Copy link to Openings and Closings

From 2010 through 2023, more hospitals closed than opened. Over this 14-year period, 300 hospitals closed and 192 hospitals opened, or 108 more hospital closings than openings. Hospital closures often raise concerns about access to care, and this may especially be the case when there are few or no other hospitals or providers in the area offering a given set of services or when a safety-net hospital closes that had served as an access point for vulnerable populations.

Hospital closures outpaced openings to a greater extent in rural versus urban areas. From 2017 to 2023, there were more closures than openings in both rural and urban areas, and especially so in rural areas. In rural areas, 61 hospitals closed compared to 11 that opened, a net reduction of 50 hospitals. In urban areas, there were 87 hospital closures compared to 74 openings, a net reduction of 13 hospitals. Over the twenty-year period from 2005 to 2024, 193 rural hospitals closed.

Hospital Characteristics

Copy link to Hospital Characteristics

Most community hospitals (58%) are nonprofits. Nonprofit hospitals are often exempt from federal, state, and local taxes and, in return, are expected to provide benefits to the communities they serve. Nonprofit hospitals may in some circumstances be more attentive than their for-profit counterparts to the needs of their patients and communities, such as by maintaining needed but unprofitable service lines. Nonetheless, some policymakers and researchers have questioned the extent to which nonprofit hospitals behave differently than for-profit hospitals and whether these facilities provide enough community benefits to justify their tax exemption (see Figure 38 in the Hospital Finances section for an estimated value of tax exemption).

While most community hospitals are nonprofit entities, for-profit ownership is common among some types of community hospitals—including acute long-term care hospitals (82%) and rehabilitation hospitals (84%)—as well as non-federal psychiatric hospitals (50%).

Most community hospitals are nonprofit, and most are part of a larger health system. Most community hospitals (58%) are nonprofit, but a large minority are for-profit (24%) or government hospitals (18%). While about two thirds (69%) of community hospitals are part of a larger health system, the about one third remaining are independent. About one in ten (11% of) hospitals are operated by the Catholic Church. Catholic hospitals have received some media attention in recent years regarding restrictions on reproductive, gender-affirming, and end-of-life care.

About two in five (42% of) hospitals have at least 100 beds, though bed sizes vary; about a quarter (26%) have 25 or fewer beds while about one in seven (16%) have 300 beds or more. More than four in ten hospitals are teaching facilities (44%). About one in three (35%) are in rural (nonmetropolitan) areas.

Market Concentration and Consolidation

Copy link to Market Concentration and Consolidation

One or two health systems controlled the entire market for inpatient hospital care in nearly half of metropolitan areas in 2023. Consolidation may allow providers to operate more efficiently and help struggling providers keep their doors open in underserved areas, but it often reduces competition. A substantial body of evidence has found that consolidation can contribute to higher prices, with unclear effects on quality. One or two health systems provided all of the inpatient care in nearly half (47%) of metropolitan areas and at least 75% of the inpatient care in most metropolitan areas (83%) in 2023. Both cases meet the definition of a highly concentrated market based on thresholds in current antitrust guidelines (see below).

The number of health systems in a given metropolitan area tends to increase with the population of the region. For example, regions with four or more health systems accounted for 33% of all metropolitan areas but 77% of the U.S. population living in metropolitan areas.

Nearly all (97% of) metropolitan areas had highly concentrated markets for inpatient hospital care in 2023 based on thresholds used in current antitrust guidelines. One way to assess market competitiveness is to evaluate a measure of concentration known as the Herfindahl-Hirschman Index (HHI), which is based on the number of participants in a market and their respective shares. The measure runs from 0 (perfectly competitive) to 10,000 (monopoly market). Nearly all (97% of) metropolitan areas had highly concentrated markets for inpatient hospital care in 2023 when applying thresholds used in current merger guidelines from the Federal Trade Commission and Department of Justice to these regions. Based on the thresholds used in prior merger guidelines, a somewhat smaller share (92%) of metropolitan areas had highly concentrated markets for inpatient hospital care in 2023.

As was the case when looking at counts of health systems in MSAs, larger metropolitan areas tended to be more competitive than less populated metropolitan areas, though many were still highly concentrated. For example, 43 of the 54 metropolitan areas with more than one million residents—including those encompassing Houston, Denver, and Atlanta—had highly concentrated hospital markets.

The share of hospitals affiliated with health systems increased from 58% in 2010 to 69% in 2023, while the share of hospitals that were independent declined. About two thirds of hospitals (69%) are now part of a larger system, an increase from 58% in 2010. A smaller share of rural than urban hospitals were part of a health system in 2023 (52% versus 78%), though a majority of hospitals were part of a system in both rural and urban areas. Shares have also increased over time for both rural and urban areas: from 43% in 2010 to 52% in 2023 among rural hospitals and from 66% in 2010 to 78% in 2023 among urban hospitals.

The ten largest health systems in the country operated about one in five (22% of) non-federal general acute care hospital beds in 2023. Consolidation has also contributed to the emergence of large health systems. For example, the ten largest health systems accounted for about one in five (22% of) non-federal general acute care hospital beds in 2023. These systems are the size of large corporations. For instance, HCA Healthcare, the largest system in terms of beds, had greater operating revenues than each of Netflix, Uber, and Starbucks in 2023. Health systems can include many types of providers beyond hospitals (such as ambulatory surgical centers, physician practices, outpatient clinics, home health agencies, and hospices) and sometimes also offer health insurance plans. 

An increasing share of physicians are employed by a hospital or are part of a practice that is at least partially owned by a hospital or health system. Between 2012 and 2022, the share of physicians employed by a hospital or part of a practice that is at least partially owned by a hospital or health system increased from 29% to 41% based on AMA survey data. Another study found that more than half of physicians were employed directly or indirectly by hospitals or health systems as of January 2024.

Instances where hospitals or health systems employ physicians or buy up physician practices are known as “vertical consolidation.” Vertical consolidation between hospitals and physicians could benefit patients in some instances if, for example, it leads to more integrated and better coordinated care across providers. At the same time, with more and more physicians owned by hospitals and health systems, health systems gain market power, which may lead to higher prices and lower quality by dampening competitive pressure on providers. Prices may also increase following vertical consolidation given that Medicare and other payers often pay higher rates for a given outpatient service when provided by a hospital than in other settings, like freestanding physician offices.

Workforce

Copy link to Workforce

Hospitals account for more than 4% of all U.S. workers. Hospitals employed 6.7 million individuals in 2023, making them the sixth largest employer in the country when comparing different industry subsectors. Hospitals followed educational services; food services and drinking places; professional, scientific, and technical services; administrative and support services; and ambulatory health care services in employment rankings. Physicians and other employees in the ambulatory health care services subsector may have close ties to hospitals in some instances (e.g., be owned by the same system as a hospital or see patients at a hospital).

Hospitals accounted for at least 5.0% of total employment in 17 states in 2023 and represented 7.8% of total employment in West Virginia, which was the highest percentage across states.

Back to top

Rural Hospitals

Prevalence of Rural Hospitals

Copy link to Prevalence of Rural Hospitals

About one third (35%) of community hospitals are in rural areas. In 2023, 1,796 community hospitals operated in rural (nonmetropolitan) areas. Of these rural hospitals, 758 were in micropolitan areas while the remaining 1,038 were not. Regions that are neither metropolitan nor micropolitan areas do not include and are not closely connected to any substantial population center.

Rural Hospital Characteristics

Copy link to Rural Hospital Characteristics

Most hospitals in rural areas were nonprofit (58%) and affiliated with a health system (52%) and half had 25 or fewer beds in 2023. Hospitals in rural areas had similar rates of nonprofit ownership as those in urban areas but were much more likely to be government-owned (33% versus 10%) and were much less likely to have for-profit ownership (9% versus 32%). Rural hospitals were also much less likely than urban hospitals to be affiliated with a broader health care system (52% versus 78%), though system affiliation has increased in both rural and urban areas over time (see Figure 12 in the Hospital Industry section). Finally, rural hospitals tend to be smaller than urban hospitals. For example, half of rural hospitals had 25 or fewer beds compared to 14% of urban hospitals. While nearly a quarter of hospitals in urban areas had at least 300 beds (23%), this was only the case for 1% of those in rural areas.

Rural Discharges by Payer

Copy link to Rural Discharges by Payer

Medicare covered a larger share of hospital discharges in rural than urban areas while private insurance covered a smaller share in rural than urban areas in 2023. Medicare shares were 53% in rural areas versus 45% in urban areas, while private insurance (not including Medicare and Medicaid plans) accounted for 19% of discharges in rural areas versus 24% in urban areas. Medicaid also covered a slightly smaller share of discharges in rural versus urban areas (19% versus 21%).

Private insurers generally reimburse at higher rates than Medicare and Medicaid (see Prices section for comparisons with Medicare), though the extent to which this is true in rural areas is unclear. Medicare provides more generous reimbursement for most rural hospitals through special rural payment designations, such as for critical access hospitals (rural hospitals with at most 25 beds that with some exceptions are a minimum distance from other facilities). Many state Medicaid programs also have special payment rules for hospitals in rural areas, such as by paying higher rates or based on costs or through supplemental payments. Commercial prices also likely differ in rural areas given the unique market structure of these regions, though it is unclear how rates compare.

Rural Profit Margins

Copy link to Rural Profit Margins

Operating margins were lower than average among rural hospitals in 2023. Operating margins were lower among hospitals in rural (nonmetropolitan) areas than hospitals in urban (metropolitan) areas (3.1% versus 5.4%, respectively). Operating margins were especially low among the nearly 1,000 hospitals in rural areas that were not micropolitan areas (1.7%) (i.e., that do not include and are not closely connected to any substantial population center).

Policymakers have had concerns about the financial health of rural hospitals and the implications for access to care and the local economy. Rural hospitals often face unique financial challenges. For example, they often have low patient volume, which may lead to higher costs, on average, and limit the ability of rural hospitals to offer specialized services. While, as noted above, the government provides additional funds for rural hospitals, including through Medicare rural payment designations (such as for critical access hospitals), rural hospitals continue to have lower operating margins than average.

Recent policy discussions have considered options for supporting rural hospitals, including in the context of discussions about reductions in Medicaid and Medicare spending. Even with an infusion of additional funds, it may be difficult to sustain some rural hospitals, such as those in areas with shrinking populations. In 2023, Medicare began to offer a new rural emergency hospital designation created by Congress, which provides support to hospitals that operate 24/7 emergency departments but do not provide inpatient care, recognizing that some regions cannot support a broader suite of services. In general, maintaining access to services at local rural hospitals involves tradeoffs in scenarios where other providers—such as outpatient clinics and large regional hospitals—are less expensive or offer higher quality of care.

Rural Openings and Closings

Copy link to Rural Openings and Closings

Hospital closures outpaced openings in rural areas from 2017 to 2023. During that seven-year period, 61 hospitals closed compared to 11 that opened, a net reduction of 50 hospitals. Over the twenty-year longer period from 2005 to 2024, 193 rural hospitals closed. Rural hospital closures often raise concerns about access to care, and this may especially be the case when there are few or no other hospitals or providers in an area offering a given set of services and for conditions that require time-sensitive care, such as heart attacks and childbirth.

Back to top

Use of Hospital Care

Inpatient Utilization

Copy link to Inpatient Utilization

Hospital inpatient utilization has decreased over time. This is true for both hospital inpatient days and admissions per capita. From 2000 to 2023, the number of hospital inpatient days per 1,000 people fell from 684 to 561, an 18% decrease. Much of this decrease occurred from 2005 to 2014, when inpatient days per 1,000 decreased by 15%. Contributing to the decrease in inpatient days over time was a decrease in both inpatient admissions and average length of stay. Inpatient admissions per 1,000 people decreased by 19% from 2000 to 2023, with much of the change also occurring from 2005 to 2014. The average length of stay decreased from 5.8 in 2000 to 5.4 in 2019, with much of the change occurring from 2000 to 2009, before jumping up during the pandemic (see below). Decreases in inpatient use over time are partly due to increases in procedures performed in outpatient settings.

There were relatively large changes in hospital inpatient utilization during the pandemic. Inpatient days per 1,000 people decreased by 5% in 2020 before increasing towards 2019 pre-pandemic levels in 2021-2023. Inpatient admissions per 1,000 people decreased by 9% in 2020; levels wavered in 2021 and 2022 before increasing again by 2% in 2023, at which point they remained 8% below 2019 pre-pandemic levels. Average length of stay increased from 5.4 in 2019 to 6.0 in 2022 before falling to 5.8 in 2023. (See the Peterson-KFF Health System Tracker for more on trends in health care utilization.)

Outpatient Utilization

Copy link to Outpatient Utilization

While hospital inpatient utilization has decreased over time, hospital outpatient utilization has increased. Hospitals provide a wide array of services on an outpatient basis, including clinic visits, imaging services, drug infusion services, and outpatient surgical procedures. The number of hospital outpatient visits per 1,000 people increased from 1,853 in 2000 to 2,426 in 2023, a 31% increase. One factor likely underlying this trend is the general movement of care from inpatient to outpatient settings. Another factor may be that reimbursement rates are often higher for a given outpatient service when provided in a hospital than in other care settings, which could create an incentive to move services from physician offices to hospital outpatient departments, including by hospitals buying up physician practices.

Outpatient visits per 1,000 people decreased in 2020, the first year of the pandemic, before increasing to around 2019 pre-pandemic levels in later years. In 2023, outpatient visits per 1,000 people exceeded pre-pandemic levels by 1%.

Discharges by Payer

Copy link to Discharges by Payer

Medicare and Medicaid together accounted for about two thirds (67%) of all hospital discharges in 2023. Nearly half of hospital discharges were attributed to Medicare (46%) and more than one fifth were attributed to Medicaid (21%). Private insurance (not including Medicare or Medicaid plans) accounted for 24% of discharges. Four percent were self-pay discharges, which typically includes uninsured patients and insured patients who pay directly rather than use their coverage. It is also possible that uninsured patients could be included under “other” in some instances.

Payer mix varies across hospitals, which has implications for hospitals’ role in the safety net and their finances. For example, private insurance accounted for 24% of discharges overall but at least 33% of discharges among the top ten percent of hospitals based on private insurance shares and 9% or less among the bottom ten percent of hospitals. Private insurers generally reimburse at higher rates than Medicare and Medicaid (see Prices section for comparisons with Medicare). Medicaid accounted for 21% of hospital discharges overall but at least 27% of discharges among the top ten percent of hospitals based on Medicaid shares and 4% or less among the bottom ten percent.

Medicare Advantage Inpatient Days

Copy link to Medicare Advantage Inpatient Days

Medicare Advantage steadily increased as a share of inpatient days between 2015 and 2023, while the share attributable to traditional Medicare decreased. In particular, the share of total inpatient days attributed to Medicare Advantage enrollees grew from 13% in 2015 to 24% in 2023 among general short-term hospitals in the U.S. During this same period, the share of inpatient days attributed to traditional Medicare declined from 34% to 24%. As of 2023, half of all Medicare inpatient days were attributable to Medicare Advantage patients. The rise in Medicare Advantage enrollment has implications for beneficiaries and hospitals, as Medicare Advantage differs from traditional Medicare. For example, plans often require prior authorization before covering certain services and establish networks of providers, among other factors.

Pregnancy & Hospitalizations

Copy link to Pregnancy & Hospitalizations

Medicaid covers about four in ten (41% of) births nationally. Medicaid covered at least four in ten births in 25 states and DC in 2023 and covered more than half of births in four states: Louisiana, Mississippi, New Mexico, and Oklahoma. The share was the largest in Louisiana, where Medicaid covered nearly two in three (64% of) births. (See prior KFF work for more about women and Medicaid.)

Maternal and neonatal stays accounted for more than one in five (22% of) hospitalizations in 2021. Maternal stays accounted for about one in ten (11% of) hospitalizations in 2021, and neonatal stays accounted for the same share (hospital stays for a mother and newborn are recorded separately). Other types of hospitalizations were medical (50%), surgical (18%), injury (5%), and mental health and substance abuse (5%) discharges.

Common Inpatient Diagnoses

Copy link to Common Inpatient Diagnoses

Excluding maternal and neonatal stays, sepsis was the most common reason for a hospitalization in 2021, followed by COVID-19, heart failure, and diabetes with complication. Excluding maternal and neonatal stays, the most common reasons for a hospital stay in 2021 were sepsis (739 stays per 100,000), COVID-19 (468 stays per 100,000), heart failure (328 stays per 100,000), and diabetes with complication (206 stays per 100,000). COVID-19 hospitalizations have decreased substantially since 2021. Hospital stays in general were much more common among people ages 75 and older: 30,084 stays per 100,000 compared to 6,665 stays per 100,000 people under 18 (most of which were stays for newborns).

The most common hospitalizations when excluding maternal and neonatal stays varied with age. For instance, people under 18 were most commonly hospitalized for depressive disorders; acute bronchitis; epilepsy, convulsions; and asthma. People ages 18 to 44 were most commonly hospitalized for sepsis, COVID-19, schizophrenia spectrum and other psychotic disorders, and depressive disorders. People ages 75 and older were most commonly hospitalized for sepsis, heart failure, COVID-19, and arrhythmia.

Back to top

Out-of-Pocket Spending and Medical Debt

Out-of-Pocket Spending

Copy link to Out-of-Pocket Spending

More than two in five (23% of) patients with a hospital stay in 2022 spent more than $3,000 out of pocket on health care. The rate among individuals who were hospitalized was nearly four times the rate (6%) among people without a hospital stay. Half (50%) of all individuals with a hospital stay had at least $1,000 in out-of-pocket spending, compared to 19% of people without a hospital stay. (See the Peterson-KFF Health System Tracker for more on differences in health care expenditures across the population.)

Total out-of-pocket spending among individuals with a hospital stay includes inpatient hospital care, hospital outpatient department visits, office-based visits, and prescription drugs, among other things. Out-of-pocket costs associated with hospital care may be especially burdensome for uninsured patients, insured patients with high deductibles or relatively less generous coverage, and low-income patients who are not eligible for hospital financial assistance programs or do not know that they are eligible.

Hospital costs have direct implications for affordability among patients receiving treatment and also affect the broader population. Hospital costs impact health insurance premiums and also affect wages and taxes because employers and the government ultimately cover a portion of these costs. Patient out-of-pocket spending accounts for a relatively small share of spending on hospital care (3% in 2023 based on national health expenditure data; see Figure 2 in the Hospital Spending section), with government and private insurers covering the bulk of hospital expenses.

Medical Debt

Copy link to Medical Debt

More than one in six hospitalized adults (18%) had over $250 in medical debt in 2022. The rate among adults who were hospitalized was more than two times the rate of those without a hospital stay (7%). (See the Peterson-KFF Health System Tracker and the KFF Health Care Debt Survey for more on medical debt.) Medical debt takes into account amounts owed to hospitals and other providers.  

Hospitals typically have financial assistance programs, which provide free or discounted services to eligible patients who are unable to afford their care. However, eligibility criteria vary across hospitals, financial assistance programs may not cover the full cost of care, and not all eligible patients receive assistance (e.g., because they do not know to apply).

Among hospitalized adults with over $250 in medical debt in 2022, the amount of debt exceeded $5,000 for about four in ten patients (39%). That again was greater than the corresponding rate (22%) among adults with over $250 in medical debt but without a hospital stay. 

More than two thirds (69%) of adults with at least $5,000 in medical debt say that a hospitalization caused at least some of their debt. Additionally, the majority of people with at least $5,000 in medical debt (77%) attributed at least part of their debt to emergency care, which is typically provided by hospitals. Many of those with at least $5,000 in medical debt cited other services that may be provided in hospitals, including lab fees or diagnostic tests (77%), doctor visits (69%), and outpatient surgery (38%). 

Back to top

Hospital Prices

Price Growth by Payer

Copy link to Price Growth by Payer

Prices for hospital care paid by private insurance have grown faster than Medicare and Medicaid rates. Inpatient hospital prices paid by private health insurance plans (and other payers aside from Medicare or Medicaid) increased by 50% from June 2014 to December 2024 based on the Producer Price Index. This is twice the growth rate of inpatient hospital prices for Medicare (25%) and more than twice the growth rate for Medicaid (19%) over the same period. There were similar differences when looking at increases in prices for hospital outpatient care (42% versus 17% for Medicare and 6% for Medicaid). (See Peterson-KFF Health System Tracker for more on medical inflation).

Prices Paid by Private Insurance

Copy link to Prices Paid by Private Insurance

Prices paid by private insurance for hospital care were 267% of Medicare rates on average in 2022 and varied widely across the country. This is based on the RAND Price Transparency Study—which uses claims data from a large population of commercial patients—and reflects facility claims for both hospital inpatient and outpatient services (while excluding associated professional claims). A KFF review similarly found that commercial prices were nearly double Medicare rates for hospital services when averaging findings across studies. Commercial-to-Medicare price ratios based on the RAND data varied widely across the country, from 166% in Arkansas to 380% in Florida. (See Peterson-KFF Health System Tracker for more on commercial health care prices and variation across the country.) Private payers often benchmark their reimbursement to a percent of Medicare rates.

Policymakers have explored a number of options to rein in commercial prices in an effort to make care more affordable, including by increasing the competitiveness of health care markets and directly regulating prices and spending. 

Prices paid by private insurance as a percent of Medicare can vary widely across hospitals within metropolitan areas. For example, in the New York City-Newark-New Jersey City metropolitan area, the prices paid by private insurance for hospital care were less than 199% of Medicare rates for a quarter of hospitals but were more than 354% for another quarter. Differences in the prices paid as a percent of Medicare rates could reflect a variety of factors, including market power and negotiating leverage, quality, cost structure, and the types of services a given hospital provides. Insurers may try to steer patients away from hospitals with high prices or exclude those hospitals from their provider networks altogether, though doing so may be challenging, especially in the case of highly regarded, “must have” hospitals with local clout and name recognition.

Back to top

Hospital Finances

Profit Margins

Copy link to Profit Margins

Hospital margins rebounded in 2023 following a large decrease in 2022. Total margins for hospitals decreased from 10.8% in 2021 to 2.3% in 2022 before increasing to 6.4% in 2023. Similarly, operating margins decreased from 8.9% in 2021 to 2.7% in 2022 before increasing to 5.2% in 2023. While both increased in 2023, they remained below 2019 pre-pandemic levels (6.5% for operating margins and 7.6% for total margins). Total margins reflect profit margins earned on all activities while operating margins reflect profit margins earned on patient care and other operating activities (rather than on other sources such as investments).

Decreases in operating margins in 2022 were likely due to the erosion of COVID funds, costs associated with labor shortages, and increased supply expenses due to high inflation rates, among other factors. Improvements in 2023 may have been due a number of factors, including stabilizing labor expenses, decreases in average length of stay, and increases in revenue. Industry reports indicate that hospital margins improved in 2024 relative to 2023.

Operating margins were relatively high among for-profit and system-affiliated hospitals and relatively low among hospitals with low market shares and rural hospitals in 2023. For-profit hospitals had much higher operating margins than nonprofit and government hospitals (14.0% versus 4.4% and 3.4%, respectively) in 2023. Differences in operating margins across these and other groups of hospitals could reflect a variety of factors. For instance, for-profit hospitals may have a greater motivation than other hospitals to operate efficiently and engage in other strategic behaviors to increase their margins, such as focusing on relatively profitable services lines, dropping unprofitable service lines (like obstetrics), or locating in wealthier areas that have more residents with commercial insurance and fewer with public or no insurance.

Operating margins were lower among hospitals in rural (nonmetropolitan) areas than hospitals in urban (metropolitan) areas (3.1% versus 5.4%, respectively). Operating margins were especially low among the nearly 1,000 hospitals in rural areas that were not micropolitan areas (1.7%). Regions that are neither metropolitan nor micropolitan areas do not include and are not closely connected to any substantial population center.

Prior KFF analysis provides additional information about differences in margins across hospitals.

Operating margins were lower than average among hospitals with high shares of Medicaid patients and higher than average among hospitals with high shares of commercial patients in 2023. More specifically, operating margins were relatively low (2.3%) among hospitals with high shares of Medicaid patients and were relatively high among hospitals with low shares of Medicaid patients (7.0%). (This compares operating margins among hospitals in the top versus bottom quartiles based on Medicaid as a share of total discharges, weighted by revenues). Notably, operating margins in 2023 were relatively low among hospitals with high Medicaid shares in both rural and urban areas (1.7% and 2.3%, respectively) (data not shown). Some policymakers have been attentive to the financial stability of safety-net hospitals, including those in both urban and rural areas, given their role in providing access to patients with limited resources and other sources of vulnerability. The share of patients covered by Medicaid may signal the extent to which a hospital serves as a safety net for low-income patients.

Operating margins were higher among hospitals with a relatively large share of commercial patients than hospitals with a relatively small share of commercial patients (7.5% versus 3.3%). One factor that likely plays a role in these results is that commercial payers generally reimburse hospital care at higher rates than Medicare and Medicaid (see Prices section for comparisons with Medicare).

Tax Exemption

Copy link to Tax Exemption

The estimated value of tax exemption for nonprofit hospitals grew from about $19 billion in 2011 to about $28 billion in 2020. Over the years, some policymakers have questioned the extent to which nonprofit hospitals—which account for nearly three-fifths (58%) of community hospitals (see Figures 8 and 9 in the Hospital Industry section)–provide enough benefit to their communities to justify tax exemption.

The estimated value of tax exemption for nonprofit hospitals was about $28 billion in 2020 based on a prior KFF analysis. About half of this amount is related to federal tax-exempt status, including the estimated value of not having to pay federal corporate income taxes ($10.3 billion) and assumptions that individuals contribute more to tax-exempt hospitals because they can deduct their donations ($2.5 billion) and that hospitals can issue bonds at lower interest rates because the interest is not taxed ($1.6 billion). About half is related to state and local tax-exempt status, including the estimated value of not having to pay state or local sales taxes ($5.7 billion), local property taxes ($5.0 billion) or state corporate income taxes ($3.0 billion).

The value of tax exemption increased in most years (7 out of 9) from 2011 to 2020. The large decrease in the value of tax exemption in 2018 coincided with the implementation of the Tax Cuts and Jobs Act of 2017, which permanently reduced the federal corporate income tax rate from 35 to 21 percent and therefore decreased the value of being exempt from federal income taxes. The large increase in the value of tax exemption in 2020 may in part reflect unique circumstances related to the COVID-19 pandemic, including the large amounts of government relief provided to hospitals.

Estimating the value of tax exemption requires a number of assumptions. Another analysis using a different methodology estimated that the value of tax exemption was $37 billion in 2021, with the largest differences being much higher estimated value of sales and property tax exemptions.

340B Drug Pricing Program

Copy link to 340B Drug Pricing Program

Purchases through the 340B Drug Pricing Program, most of which are made by hospitals, have increased substantially over time. The 340B Drug Pricing Program requires manufacturers participating in Medicaid to sell outpatient drugs to eligible nonprofit and government providers at a substantial discount, with the intent of supporting entities caring for low-income and other underserved populations, such as certain disproportionate share hospitals. The 340B program has grown substantially over time, with total drug purchases growing from $2.4 billion in 2005 to $66.3 billion in 2023.

Hospitals account for the large majority of these drug purchases, and more than 2,600 hospitals participated in the program as of January 2023. The pharmaceutical industry has raised concerns that hospitals are not always using the 340B program to help patients afford health care, while hospitals say that the 340B program provides funds to help safety-net hospitals care for underserved populations and invest in operations. Policymakers have considered a variety of 340B reforms, including options that would preserve the ability of providers to dispense 340B drugs through contract pharmacies, increase transparency, tighten regulation of the program, or scale back its scope.

Hospital Expenses

Copy link to Hospital Expenses

Labor costs were the largest expense category for hospitals in 2023, followed by supply and pharmacy expenses. Labor costs made up almost half (46%) of all hospital expenses in 2023 based on a large sample of community hospitals. That includes the costs of hospital employees but not contract labor (e.g., nurses temporarily hired through staffing agencies), which are part of “other” expenses. Most labor costs were related to direct patient care in 2022 based on another data source. Supplies (12%) and pharmacy (9%) were the next largest expense categories.

Back to top

Charity Care

Distribution of Charity Care

Copy link to Distribution of Charity Care

Half of all hospitals reported that charity care costs represented 1.2% or less of their operating expenses in 2023, though the level of charity care varied substantially across facilities. Hospital charity care programs, also known as “financial assistance programs,” provide free or discounted services to eligible patients who are unable to afford their care. While charity care costs represented 0.1% of operating expenses or less on the lower end of the spectrum (for 10% of hospitals), they represented 6% or more among a similar share of hospitals on the higher end. Differences in charity care likely reflect a variety of factors, such as the extent to which patients require financial assistance, hospitals’ eligibility criteria and application procedures, efforts to notify patients of their eligibility, and state requirements (e.g., that hospitals at a minimum extend eligibility to certain groups of patients).

Charity Care and Medicaid Expansion

Copy link to Charity Care and Medicaid Expansion

Charity care costs in 2023 were generally higher in states that had not expanded Medicaid. As a result of the Affordable Care Act, states have the option of expanding Medicaid to nearly all adults with incomes up to 138% of the federal poverty level. Eight of the ten states with the highest average charity care costs as a percent of operating expenses in 2023 had not expanded Medicaid as of January of that year (one did so in December 2023). For example, Texas had both the highest uninsured rate (16%) and the highest average charity care costs as a percent of operating expenses (6.6%) in the country. Conversely, all thirteen states where average charity care costs as a percent of operating expenses were less than 1.0% had expanded Medicaid. Medicaid expansion can improve hospital finances by extending coverage to uninsured patients who may otherwise qualify for hospital charity care or be unable to pay their bills.

Average charity care costs as a percent of operating expenses across the nation were 2.2% in 2023 (which is higher than the median reported in Figure 41 due to a relatively small share of hospitals with particularly high charity care costs).

Back to top

Data Sources

About the Data

Copy link to About the Data

Data sources used for Key Facts About Hospitals are listed below. Some figures pull from other sources, including prior KFF analyses and KFF State Health Facts, which include additional information about the data and methodology. Numbers have been rounded.

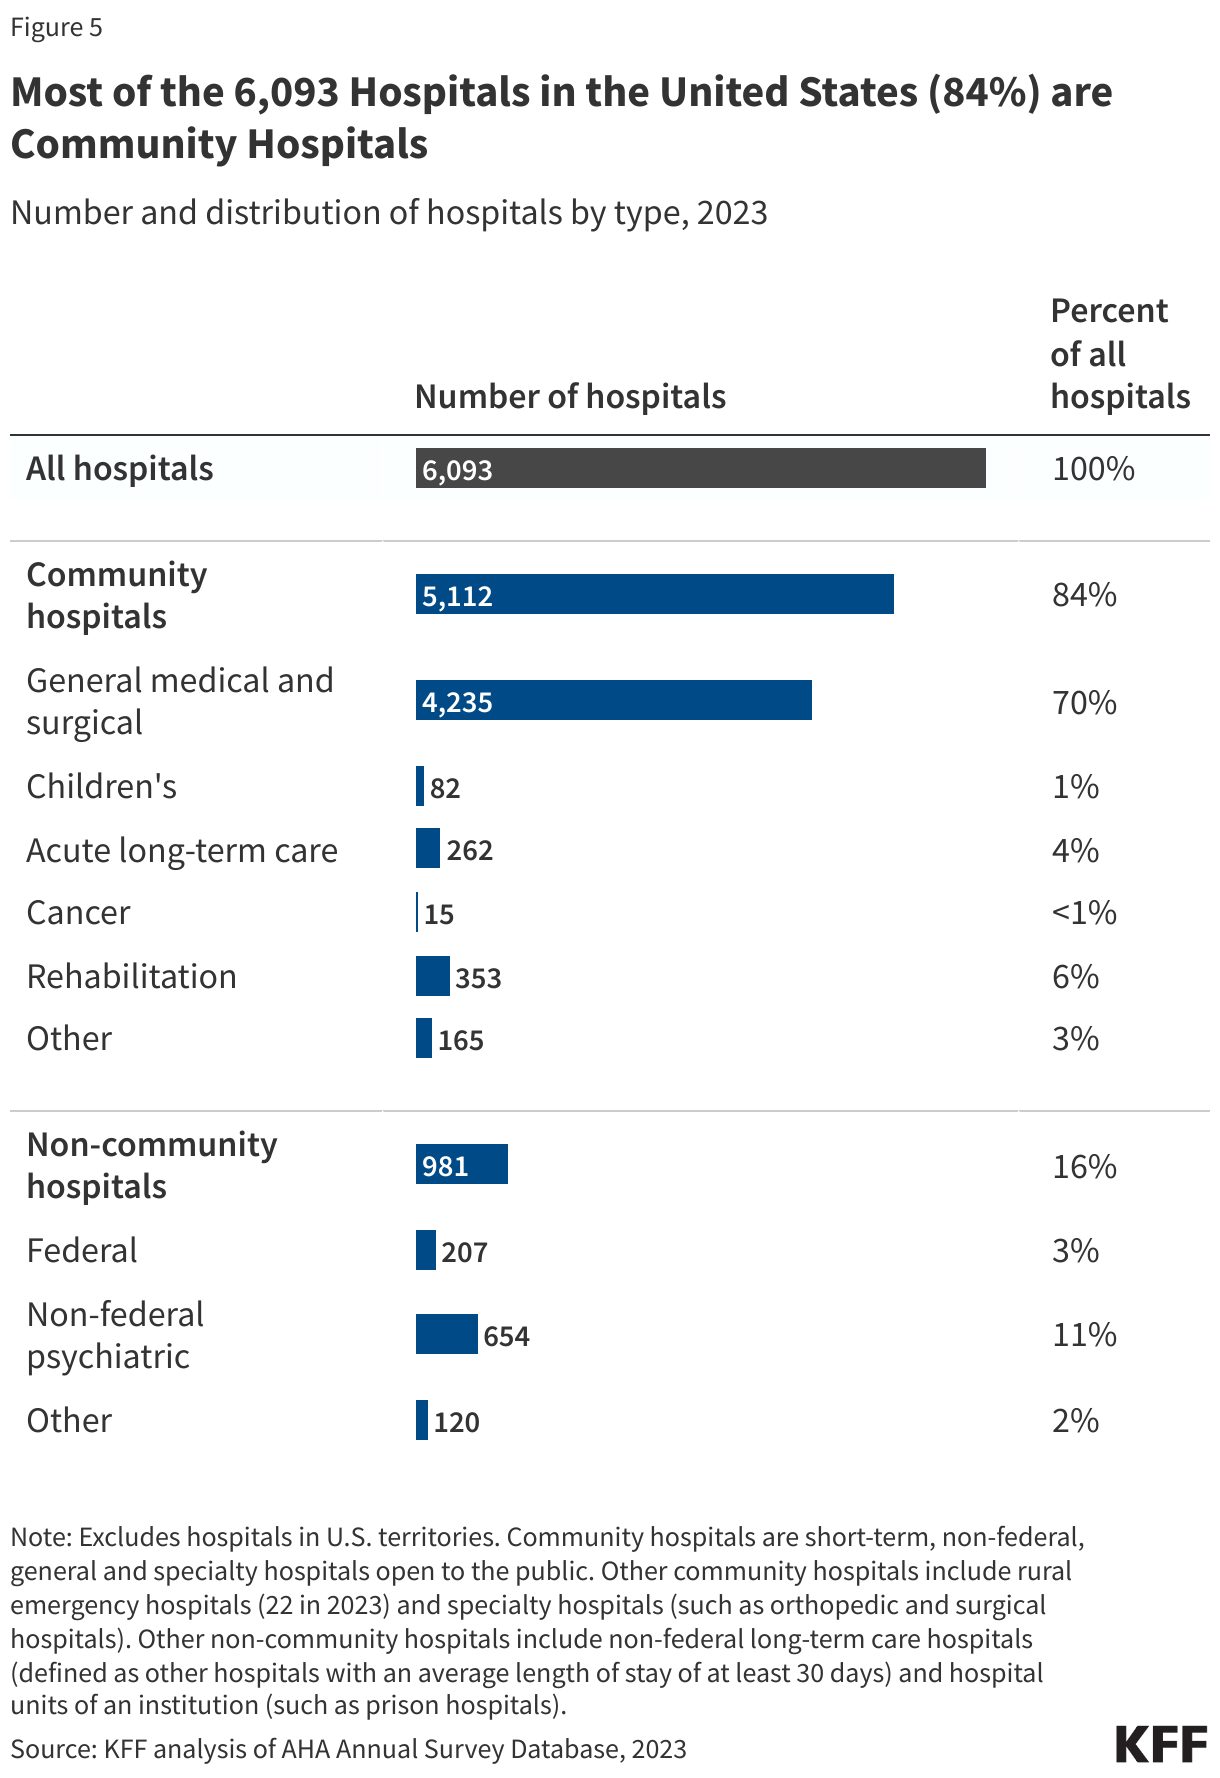
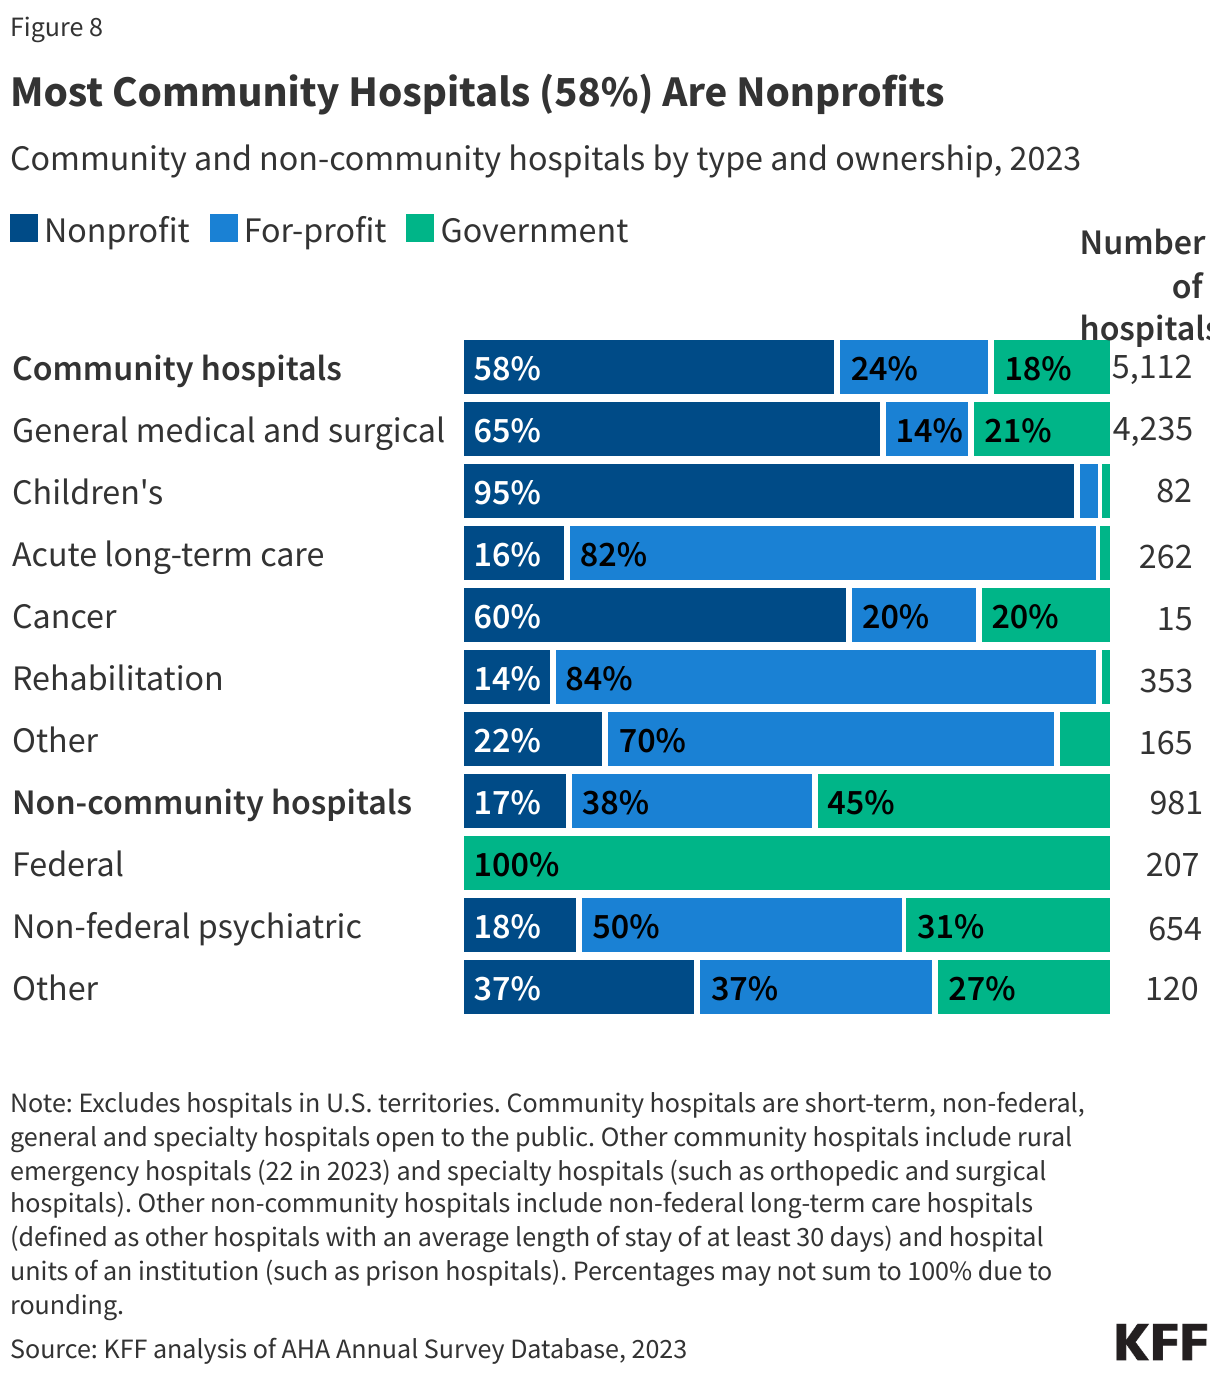
American Hospital Association (AHA) Annual Survey. Data from an annual survey of all hospitals in the United States and its associated areas. Non-federal psychiatric hospitals were defined to include psychiatric hospitals as well as hospitals that identified their hospital type as “substance use disorder” or “intellectual disabilities.”

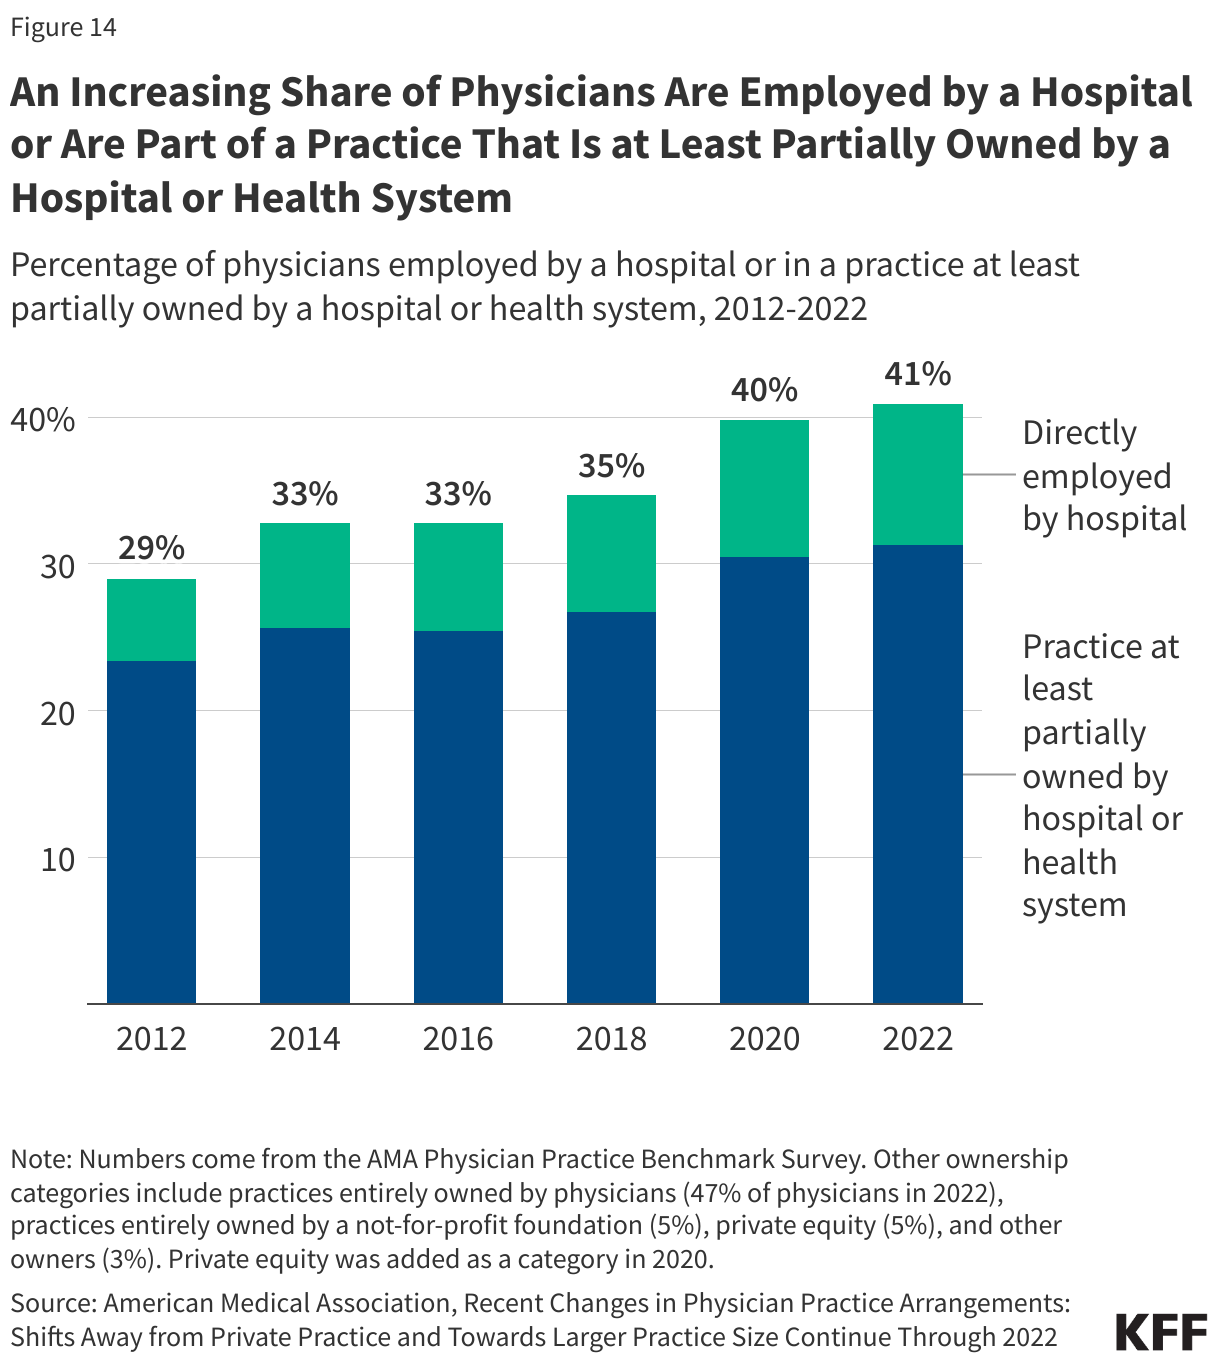
American Medical Association (AMA) Physician Practice Benchmark Survey. As described by the AMA, the Physician Practice Benchmark Survey is a nationally representative survey of “post-residency physicians who provide at least 20 hours of patient care per week, are not employed by the federal government, and practice in one of the 50 states or [DC].”

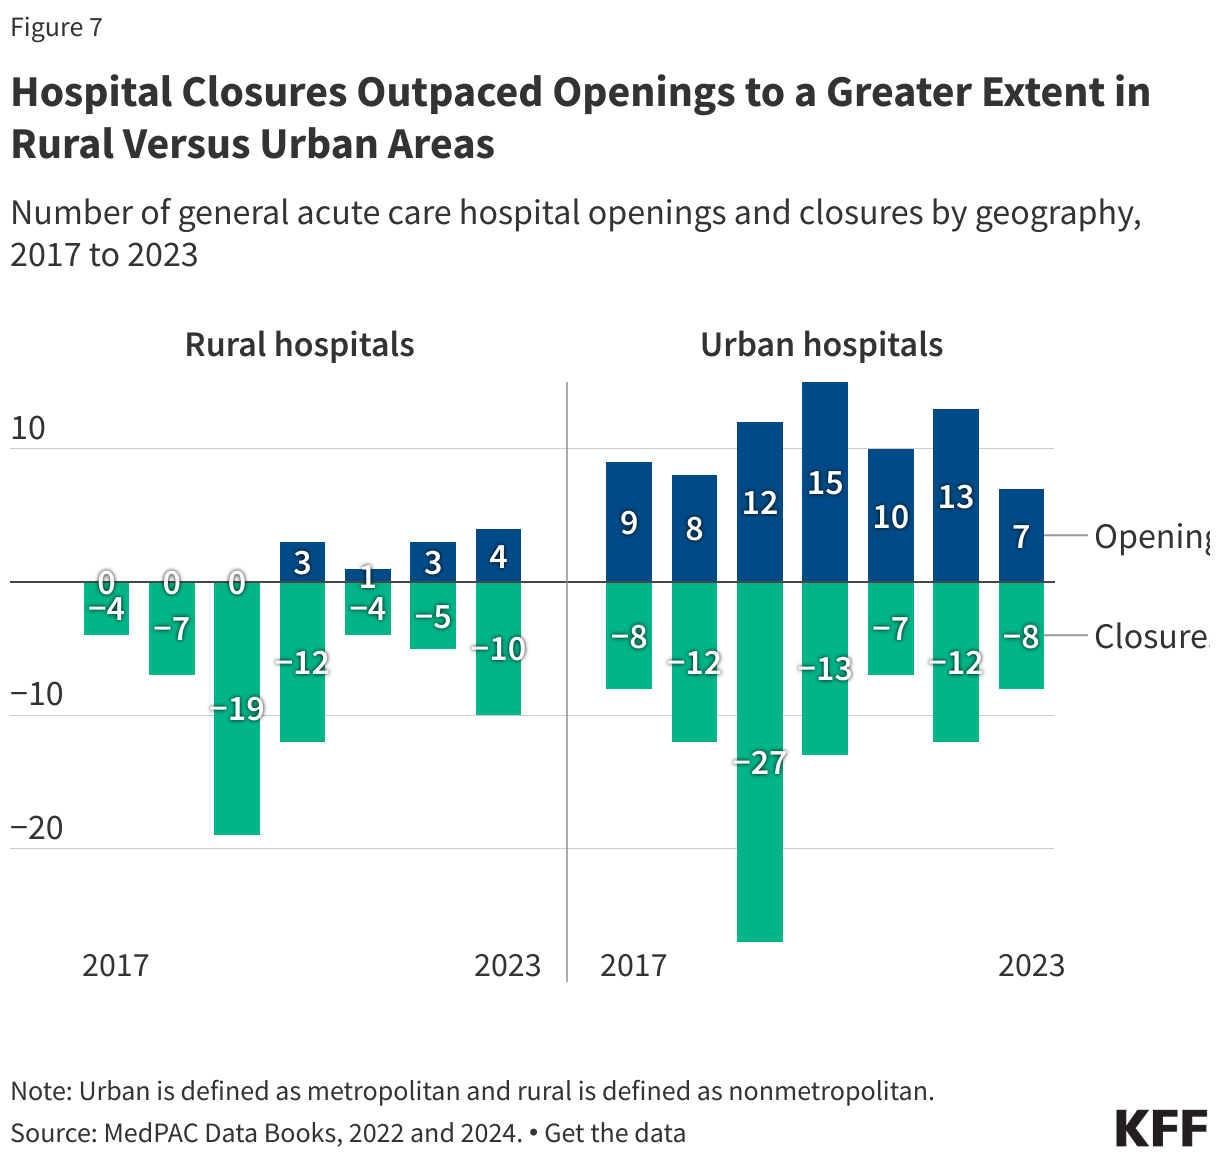
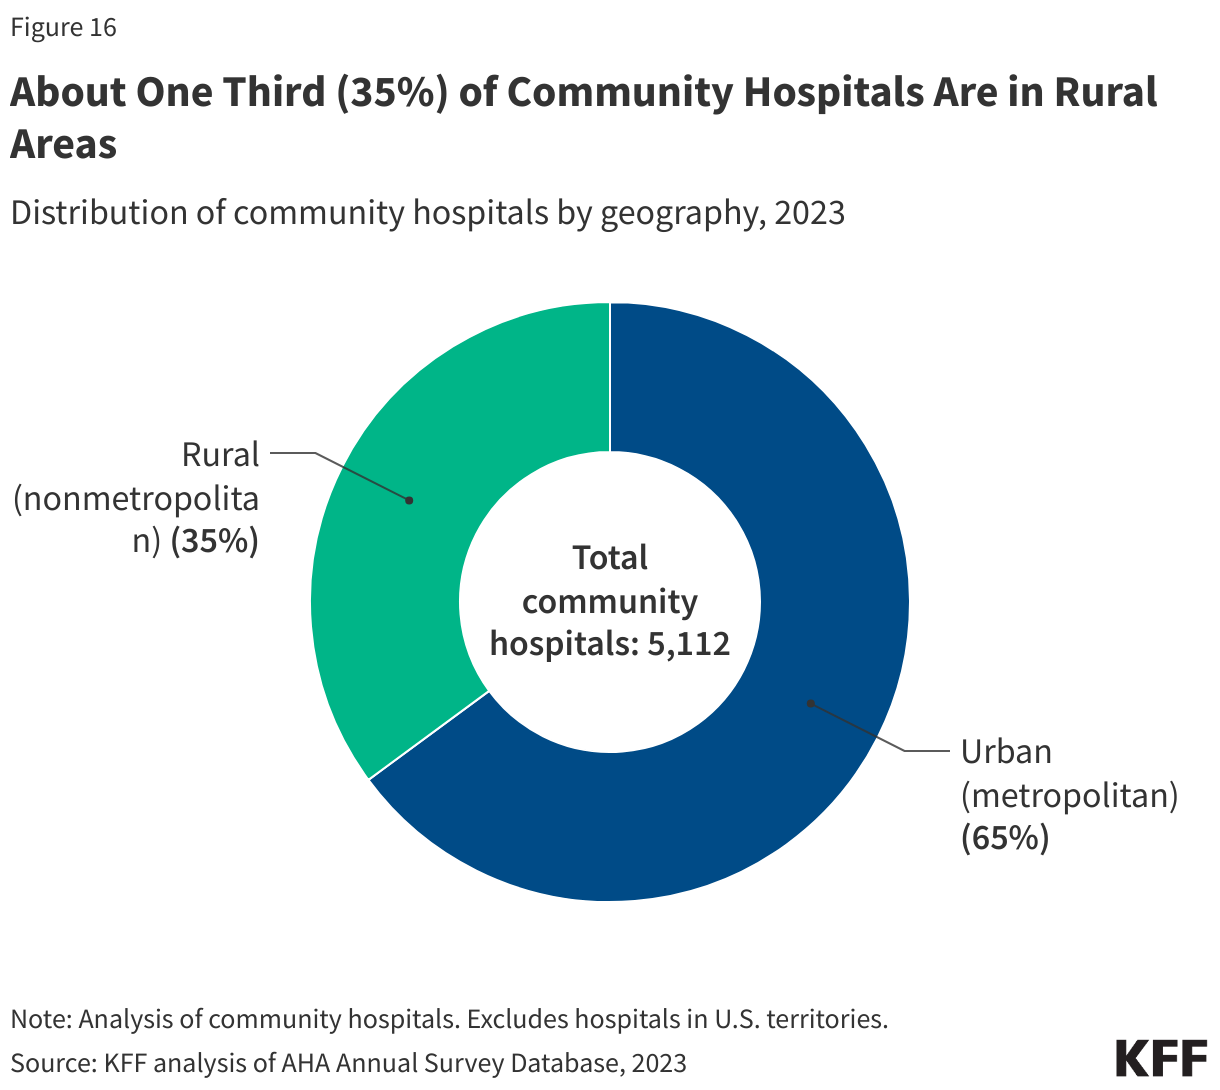
Census Bureau delineation files. The Census Bureau delineation files map counties and county equivalents to metropolitan areas, micropolitan areas, and other regions. These files were used to group hospitals into metropolitan, micropolitan, and other areas. A metropolitan area is a county or group of counties that contains at least one urban area with a population of 50,000 or more people. A micropolitan area is a county or group of counties that contains at least one urban area with a population of at least 10,000 but less than 50,000. Urban and rural regions were defined as metropolitan and nonmetropolitan areas, respectively.

Census Bureau population estimates. We relied on annual population estimates for the 50 states and DC as of July 1 of a given year from the Census Bureau’s Population Estimates Program.

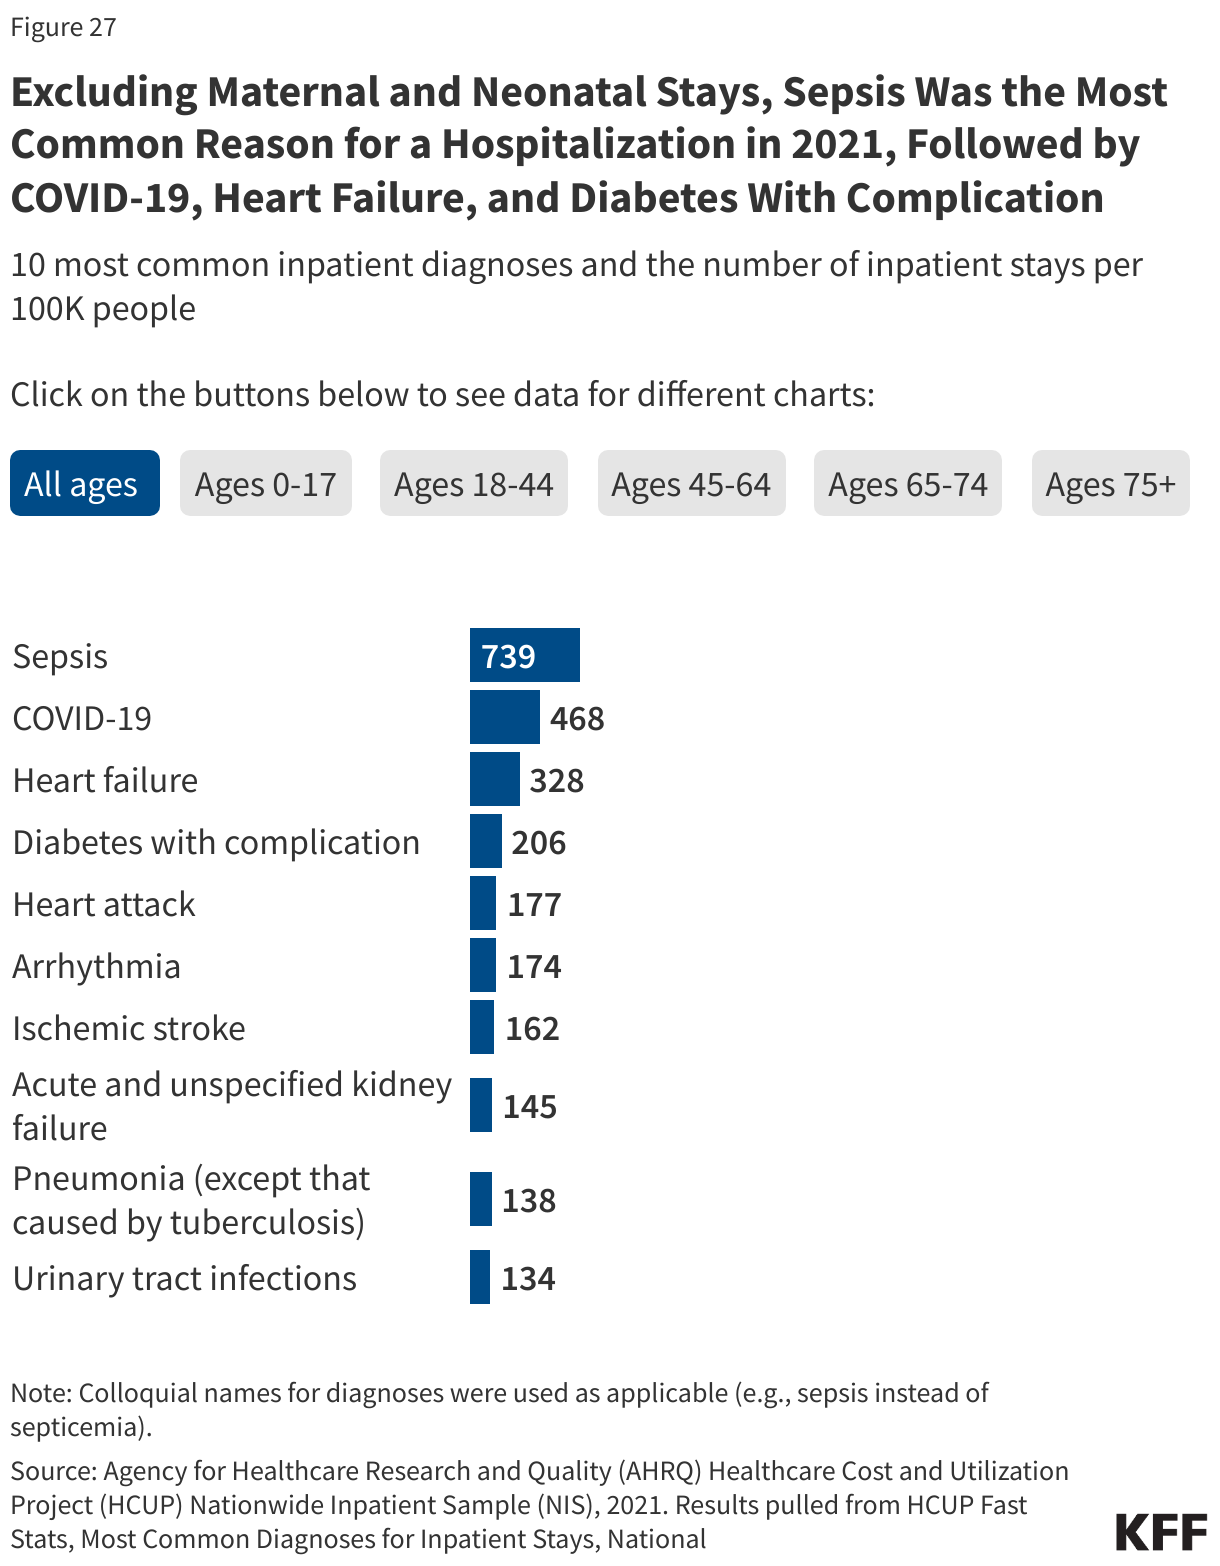
Healthcare Cost and Utilization Project (HCUP) National Inpatient Sample (NIS). The NIS is a sample that includes about 20% of all inpatient discharges from U.S. community hospitals (aside from rehabilitation and long-term care hospitals). It is nationally representative of non-federal short-term hospitals in the U.S. and is sponsored by the Agency for Healthcare Research and Quality. Primary diagnoses are grouped into clinical categories based on Clinical Classifications Software Refined (CCSR). The categories used for rankings are mutually exclusive; when a diagnosis falls under multiple clinical categories, the stay is assigned to a single category based on hierarchical guidelines.

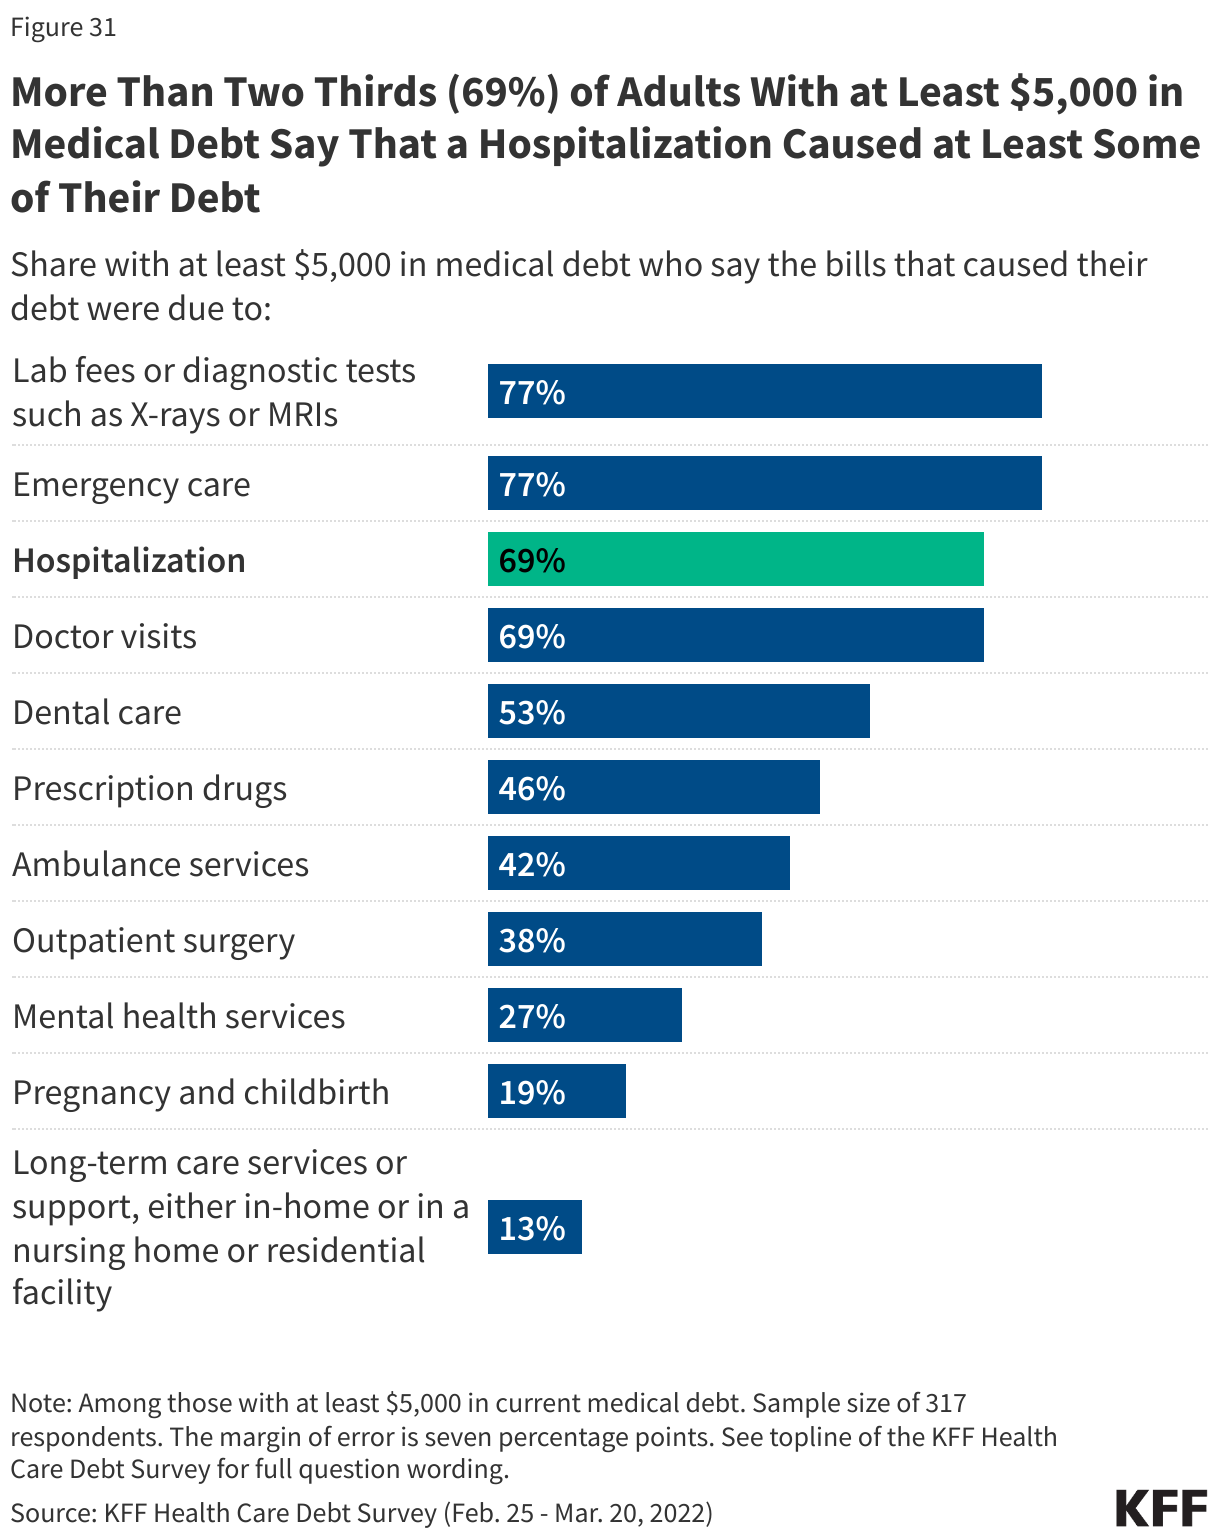
KFF Health Care Debt Survey. The KFF Health Care Debt Survey is a nationally representative survey of U.S. adults that was conducted from February 25 through March 20, 2022.

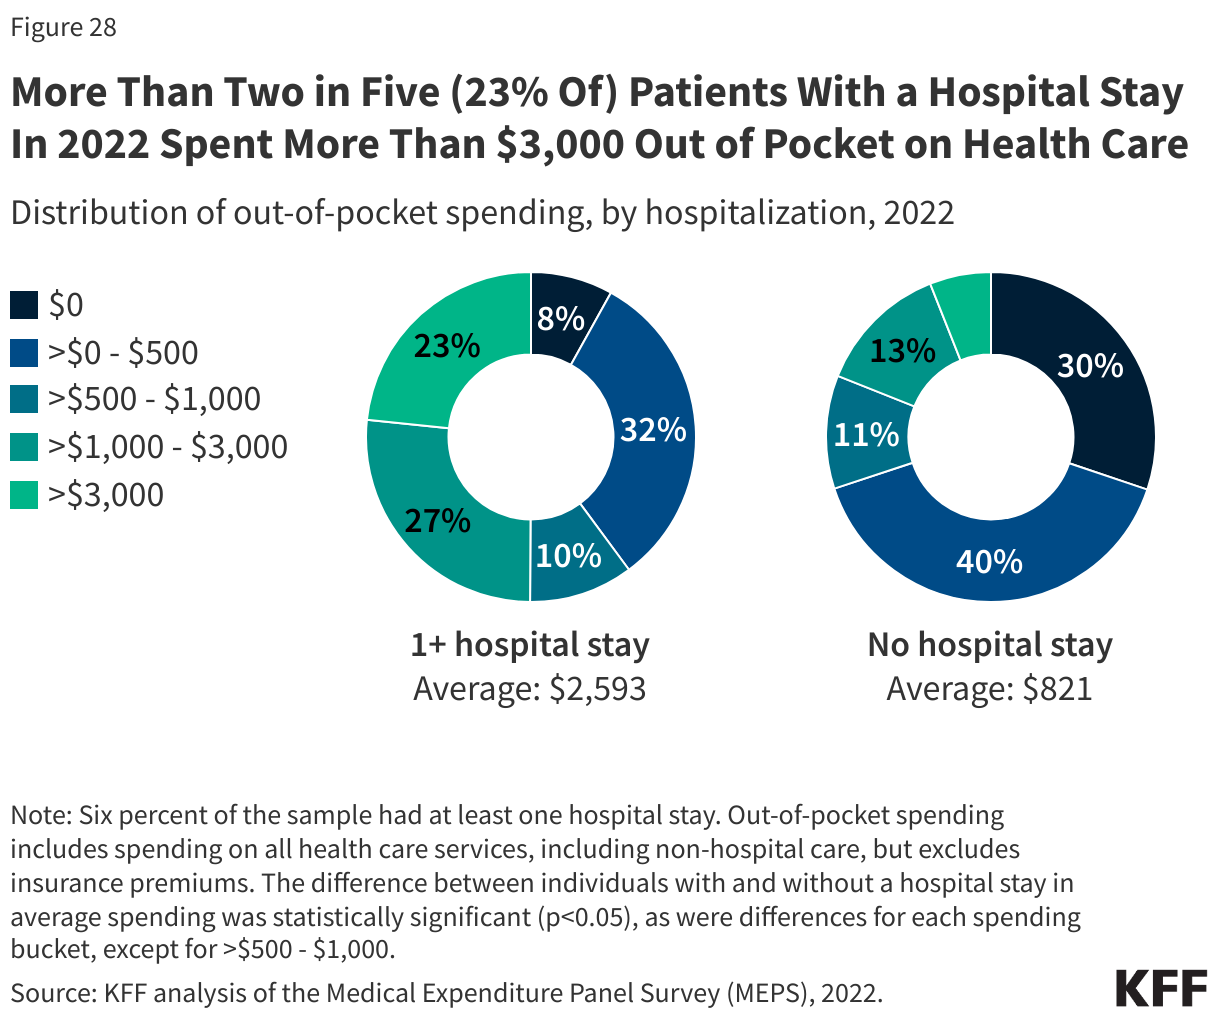
Medical Expenditures Panel Survey (MEPS). MEPS is a nationally representative survey of the U.S. civilian non-institutionalized population that includes information about health care expenditures and sources of payment, among other things. The analysis of out-of-pocket spending relied on the MEPS Household Component (HC).

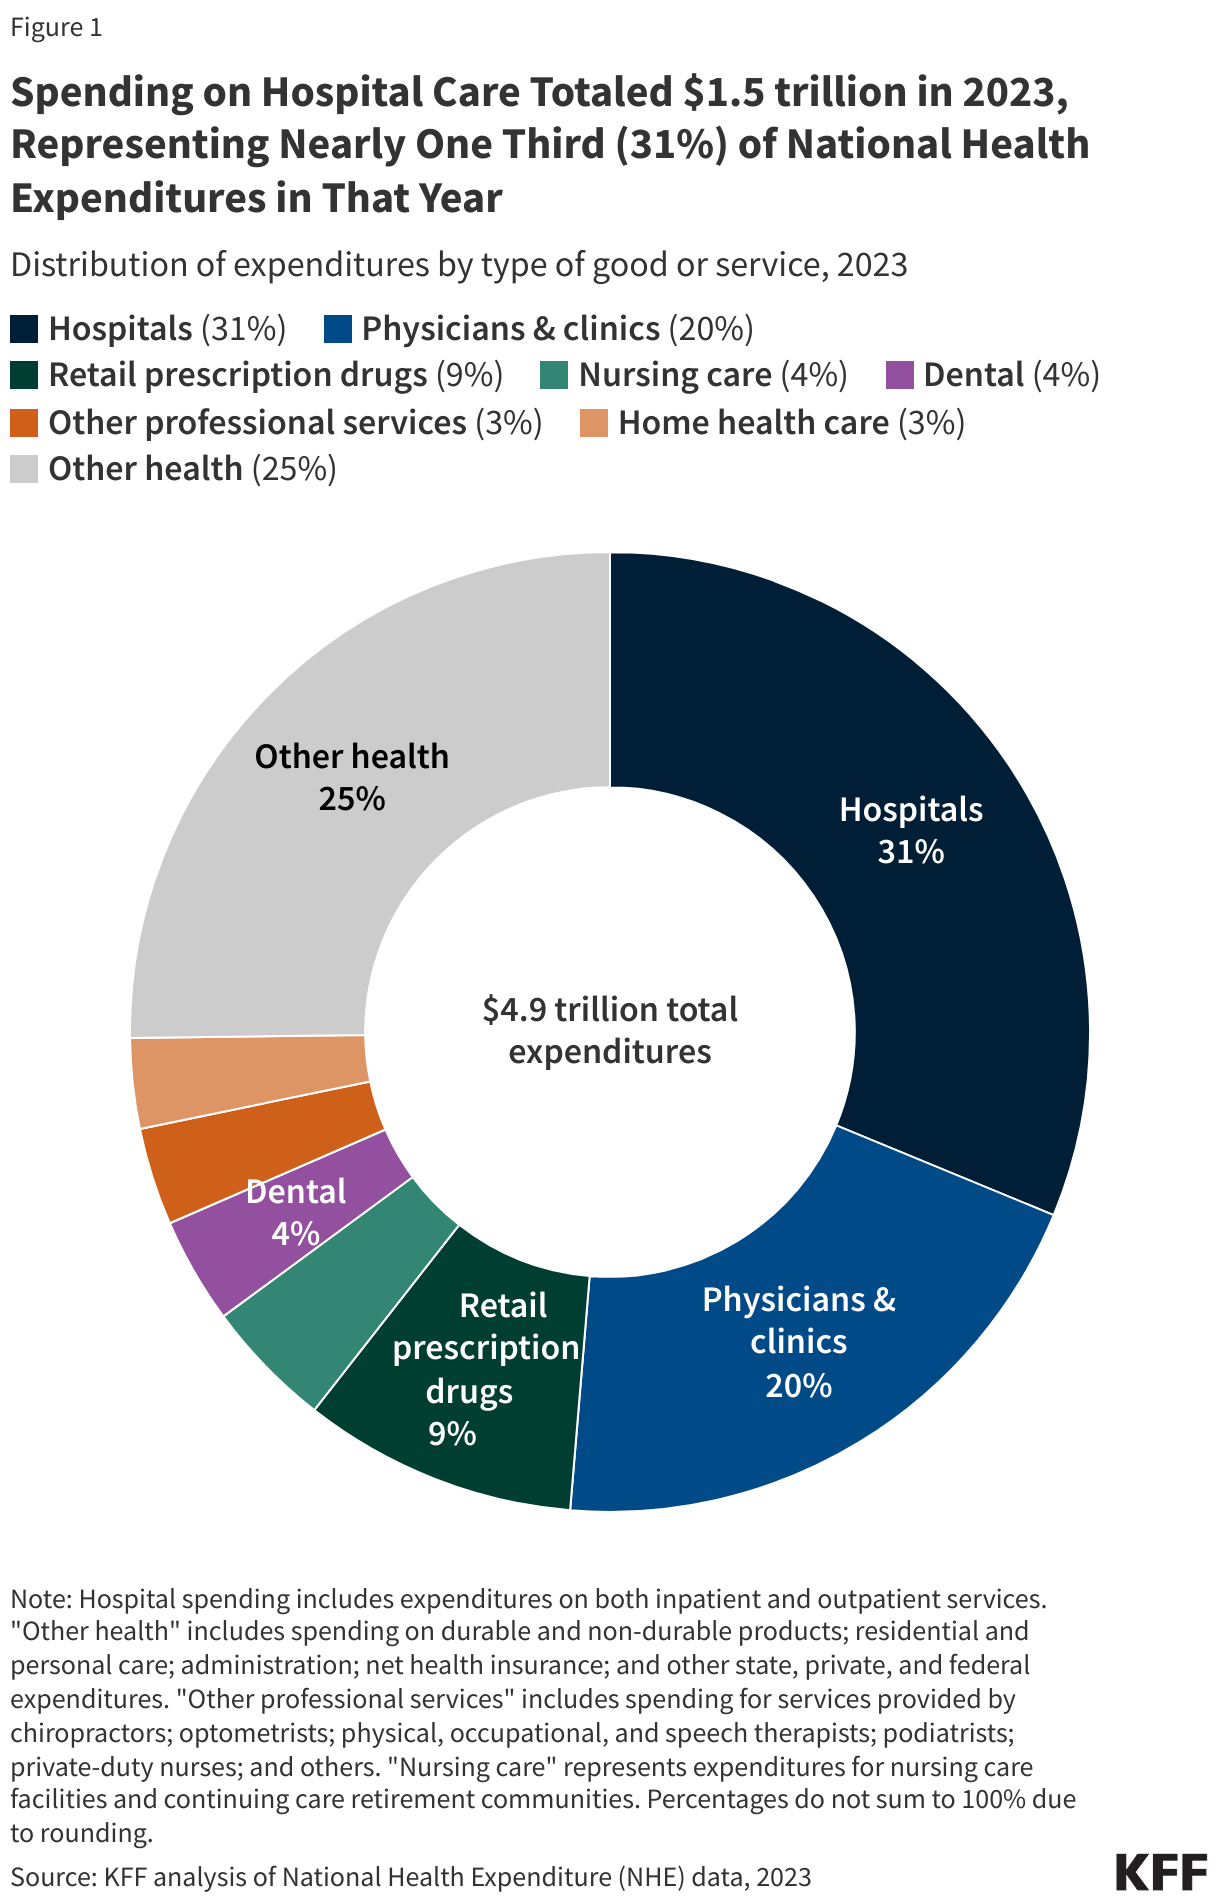
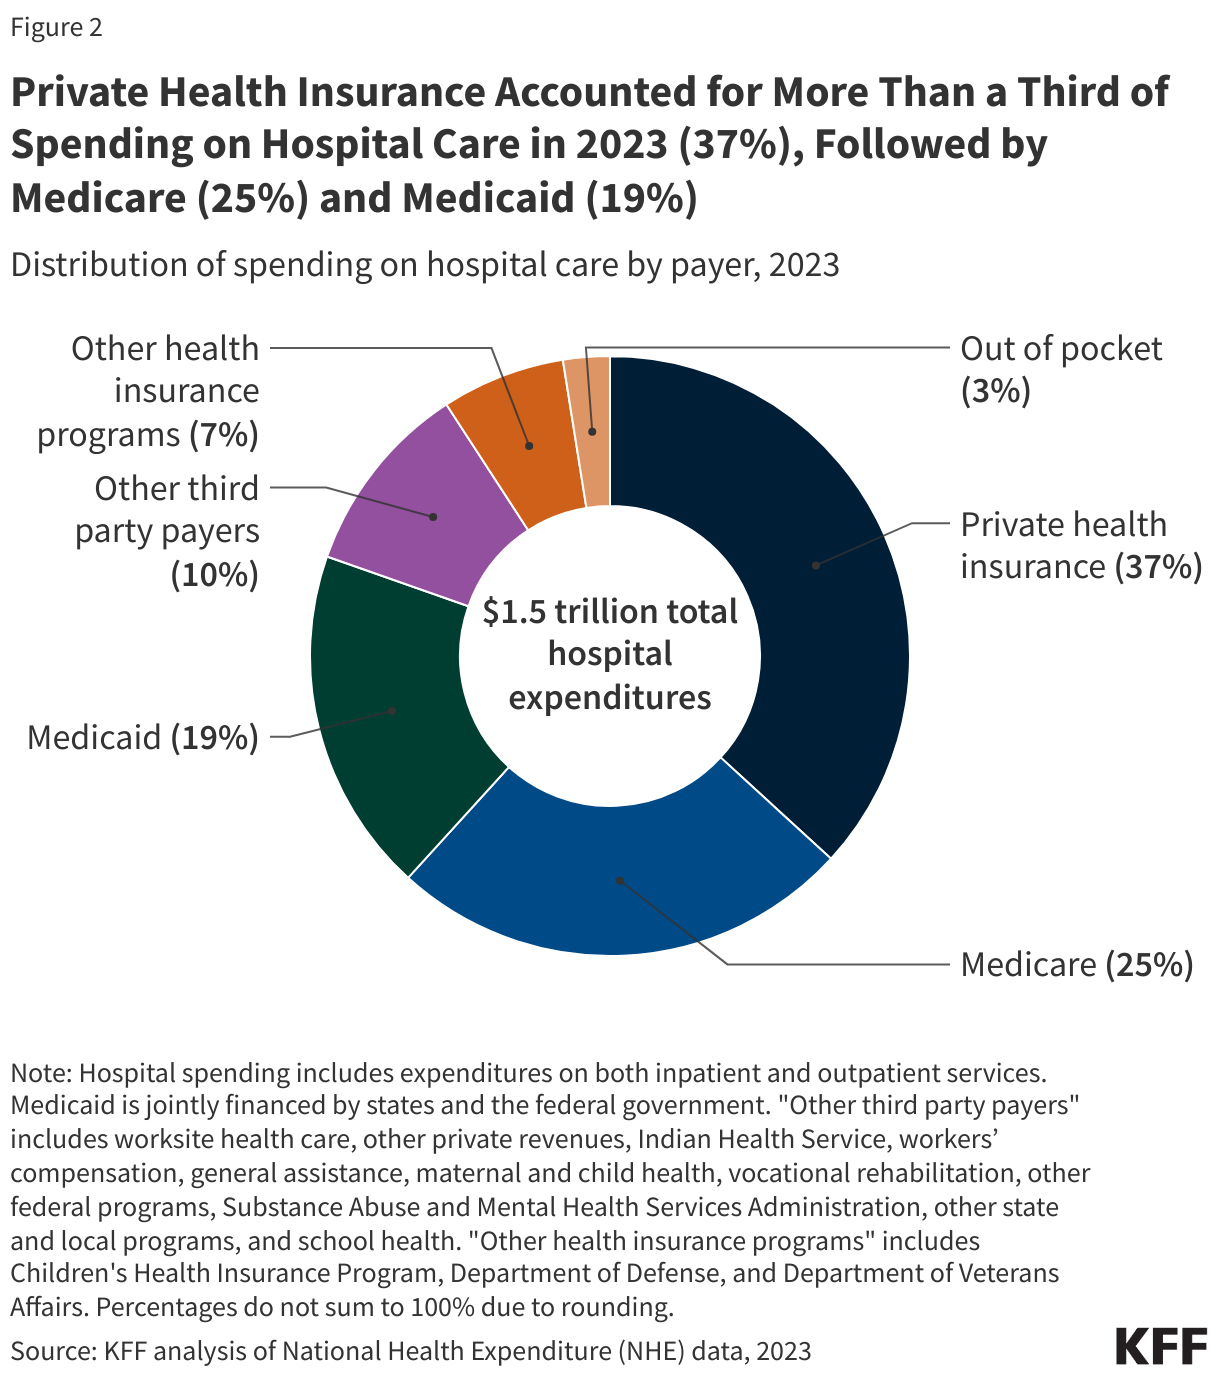
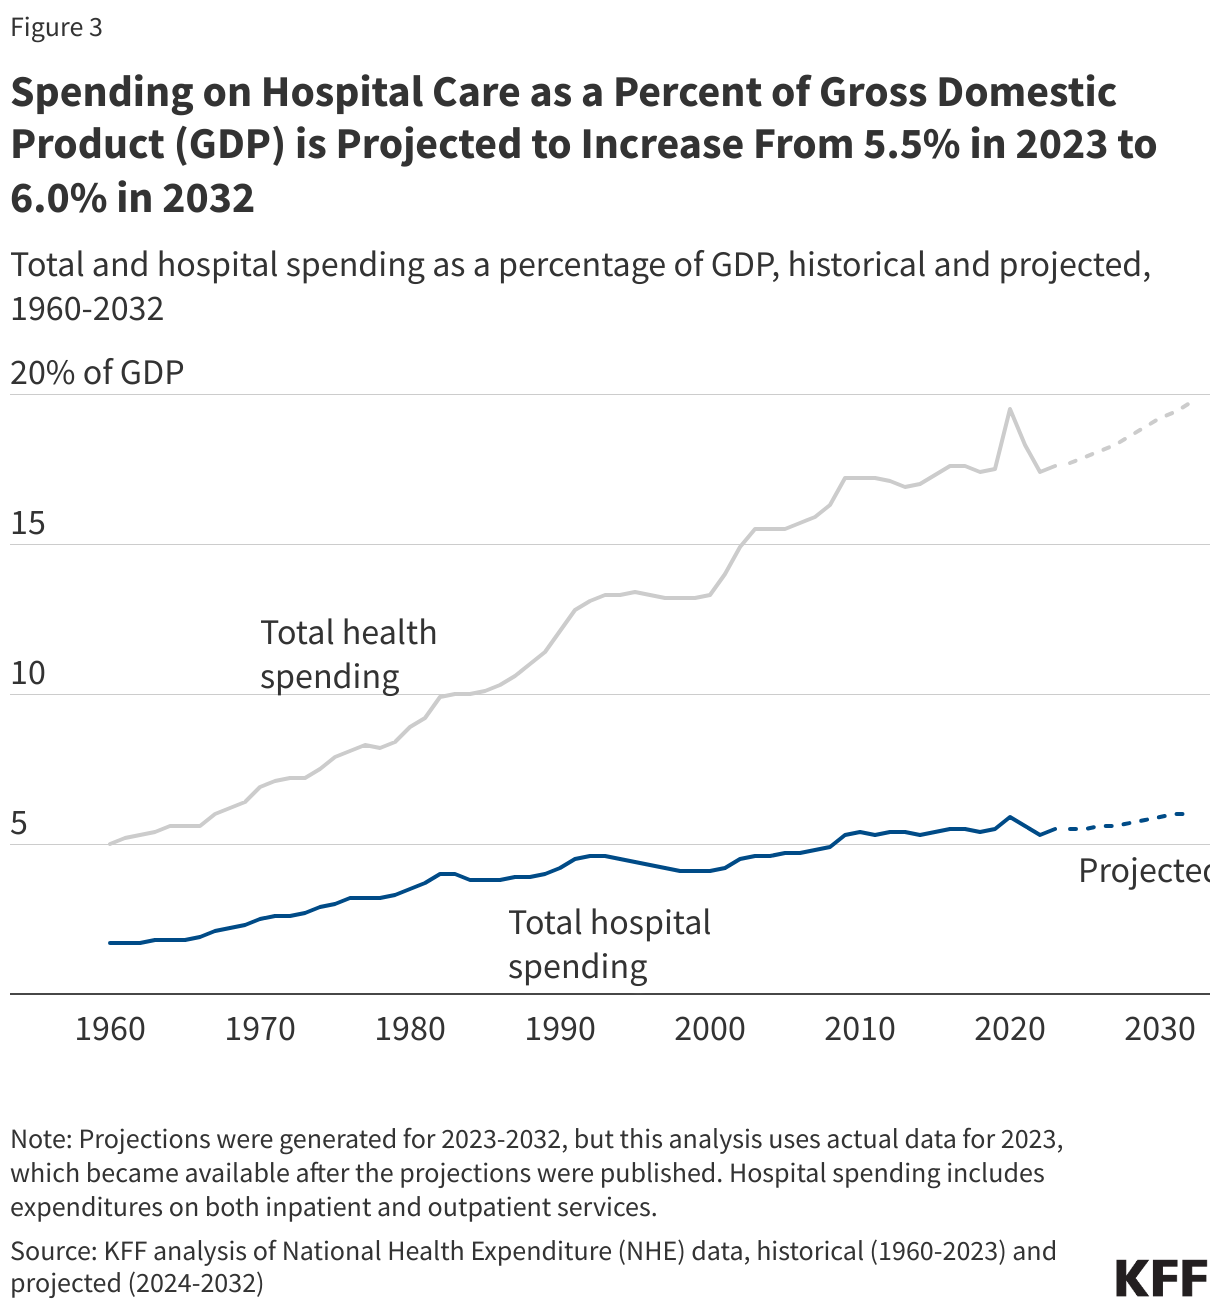
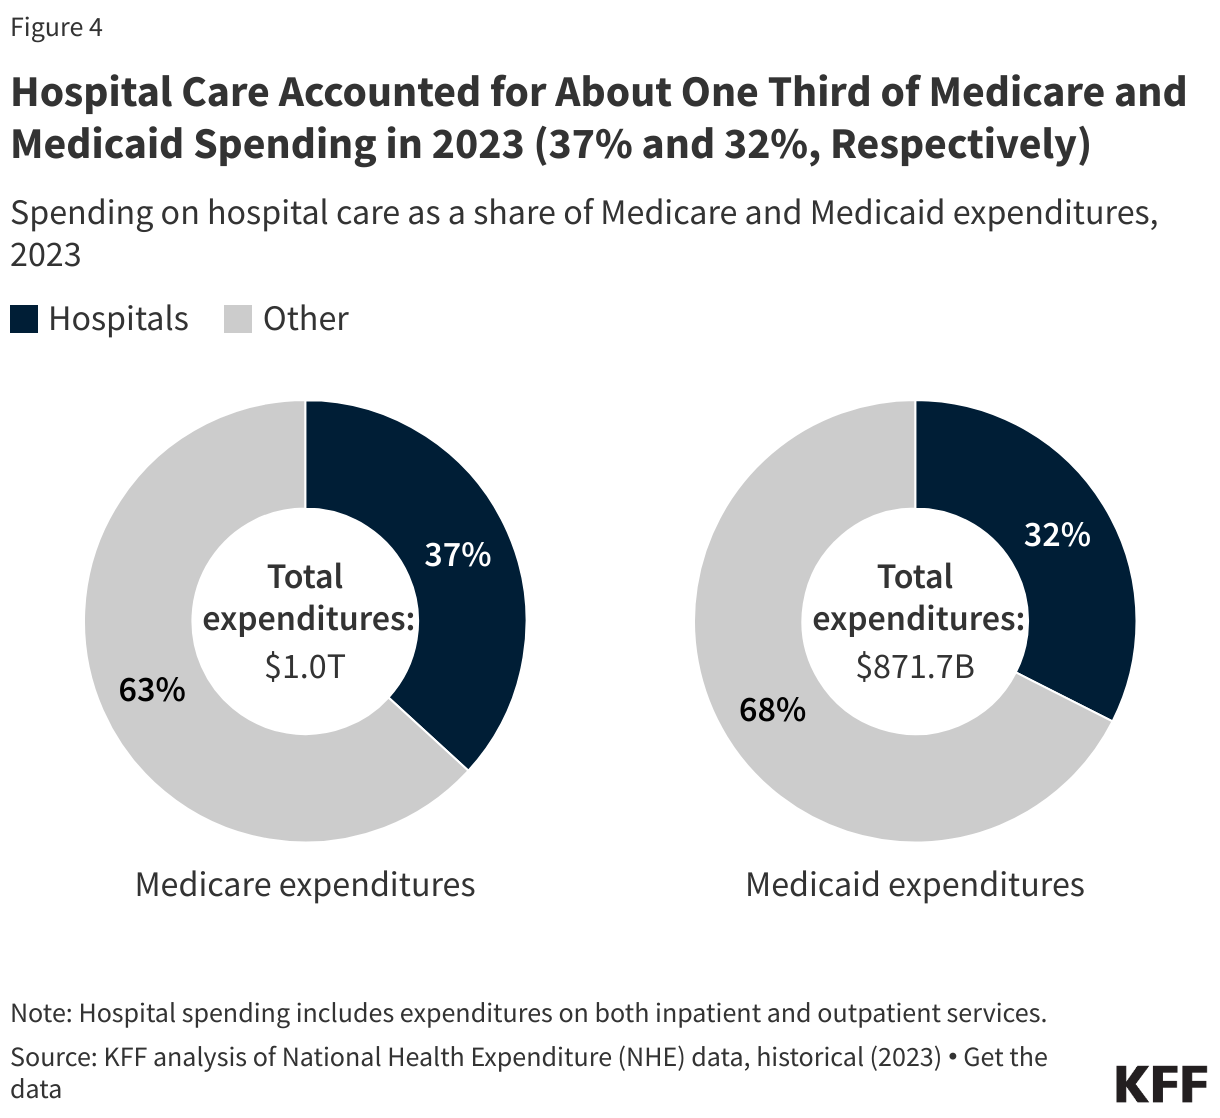
National Health Expenditures. These data are published annually by the Centers for Medicare & Medicaid Services and provide estimates of national spending on health care, by payer and by type of service.

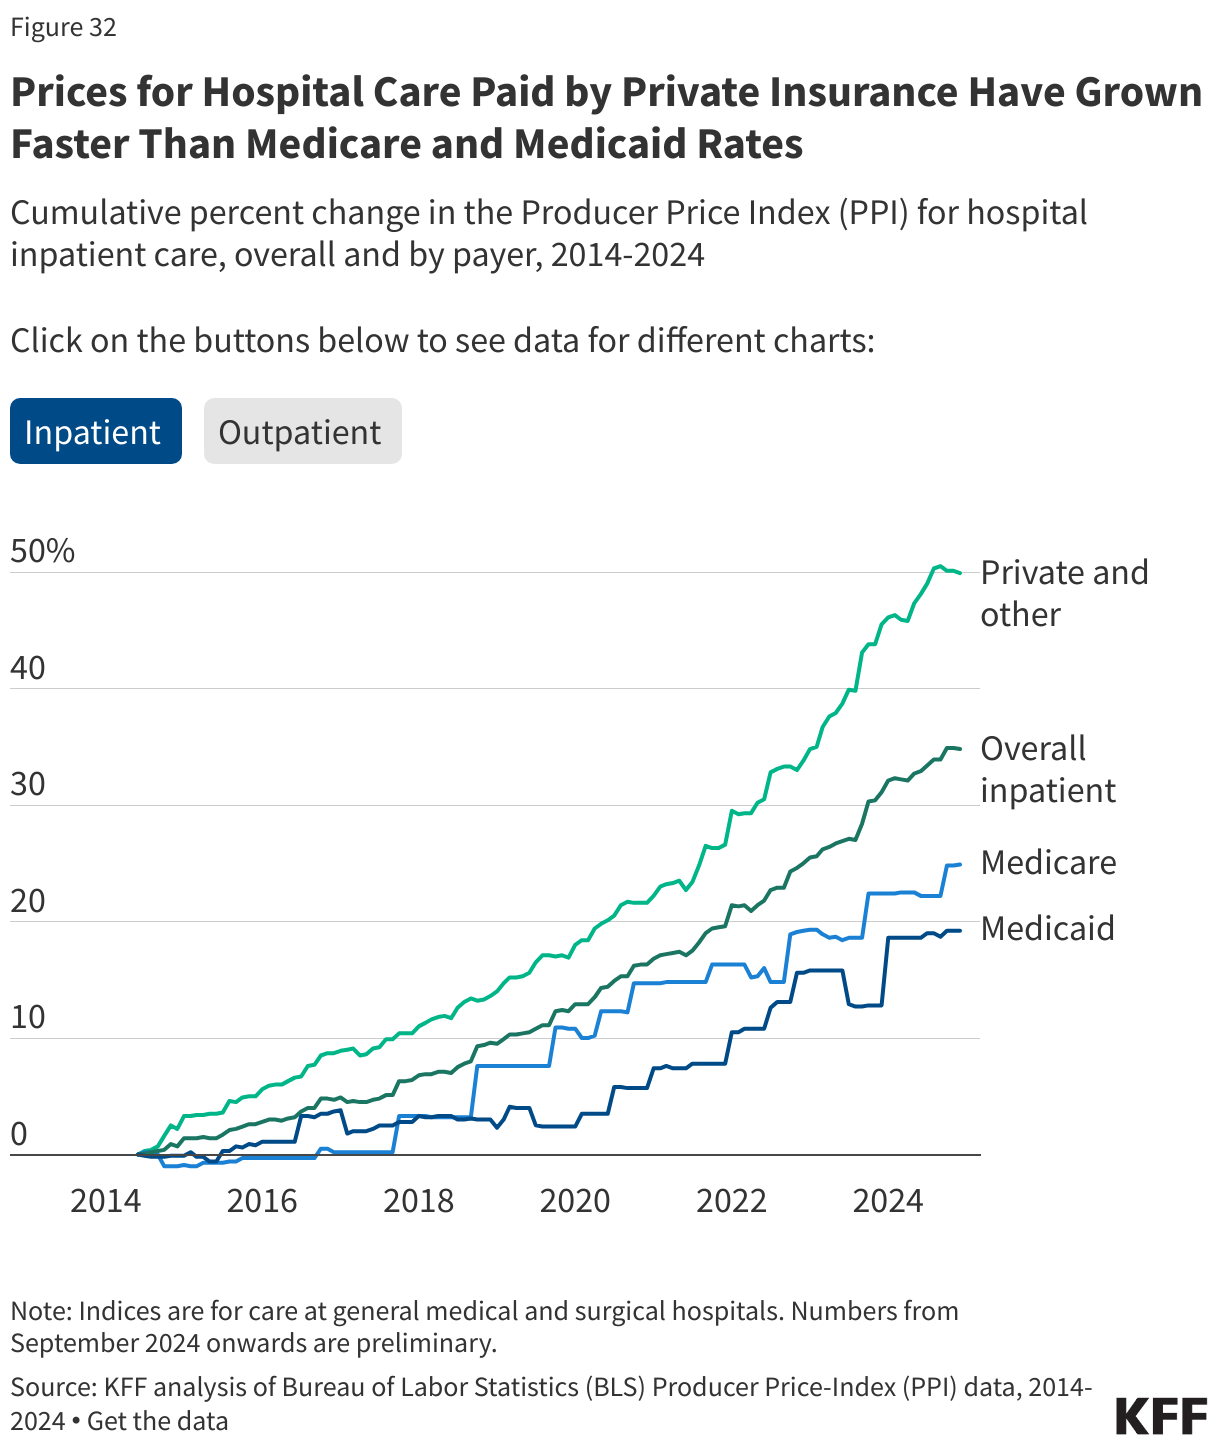
Producer Price Index (PPI). These data come from the Bureau of Labor Statistics (BLS). As BLS notes, PPI indices measure “the average change over time in selling prices received by domestic producers of goods and services.” The health care PPIs reflect the reimbursement that providers receive for health care services. The Medicare, Medicaid, and private and other patient PPIs are mutually exclusive. The Medicare and Medicaid PPIs take account of private Medicare and Medicaid plans. The PPI may exclude supplemental payments that are paid to hospitals as a lump sum.

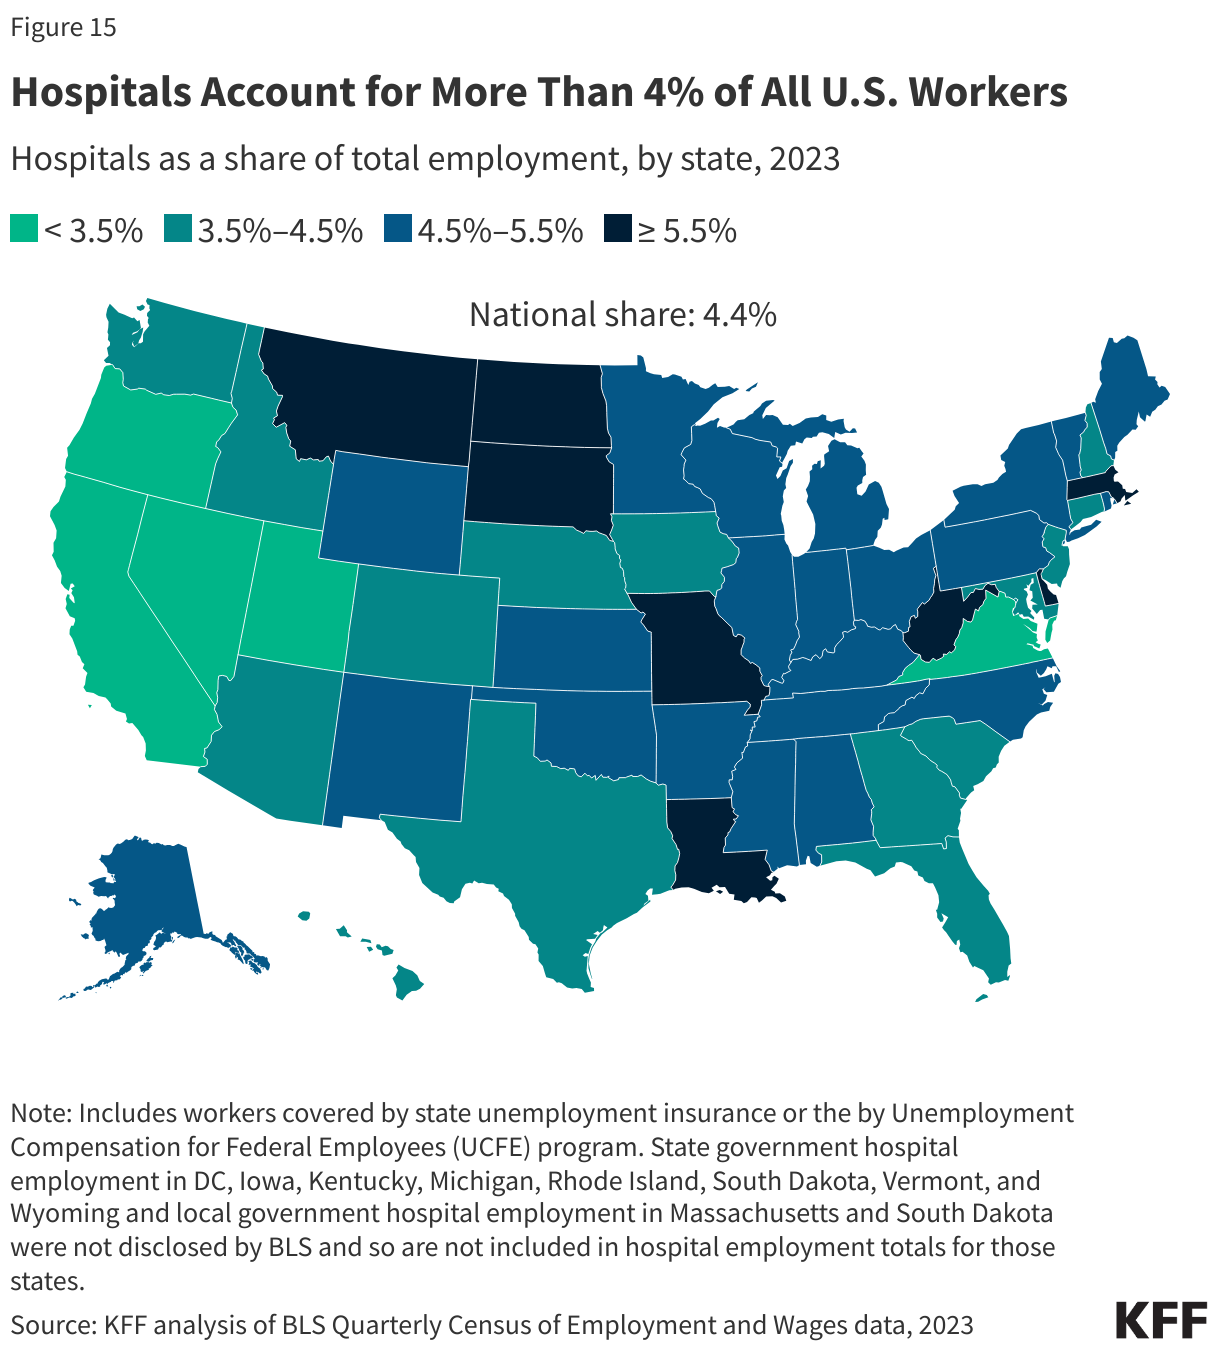
Quarterly Census of Wages and Employment (QCEW). These data also come from BLS. As BLS notes, the QCEW data provide a “quarterly count of employment and wages reported by employers covering more than 95 percent of U.S. jobs.” The QCEW includes workers covered by state unemployment insurance laws as well as federal workers covered by the Unemployment Compensation for Federal Employees (UCFE) program. Analyses of hospital and other employment relied on the average annual employment numbers reported by BLS. Industry subsector rankings were based on 3-digit NAICS codes. Employment for a given industry subsector and employer type were not included in totals when not disclosed by BLS.  

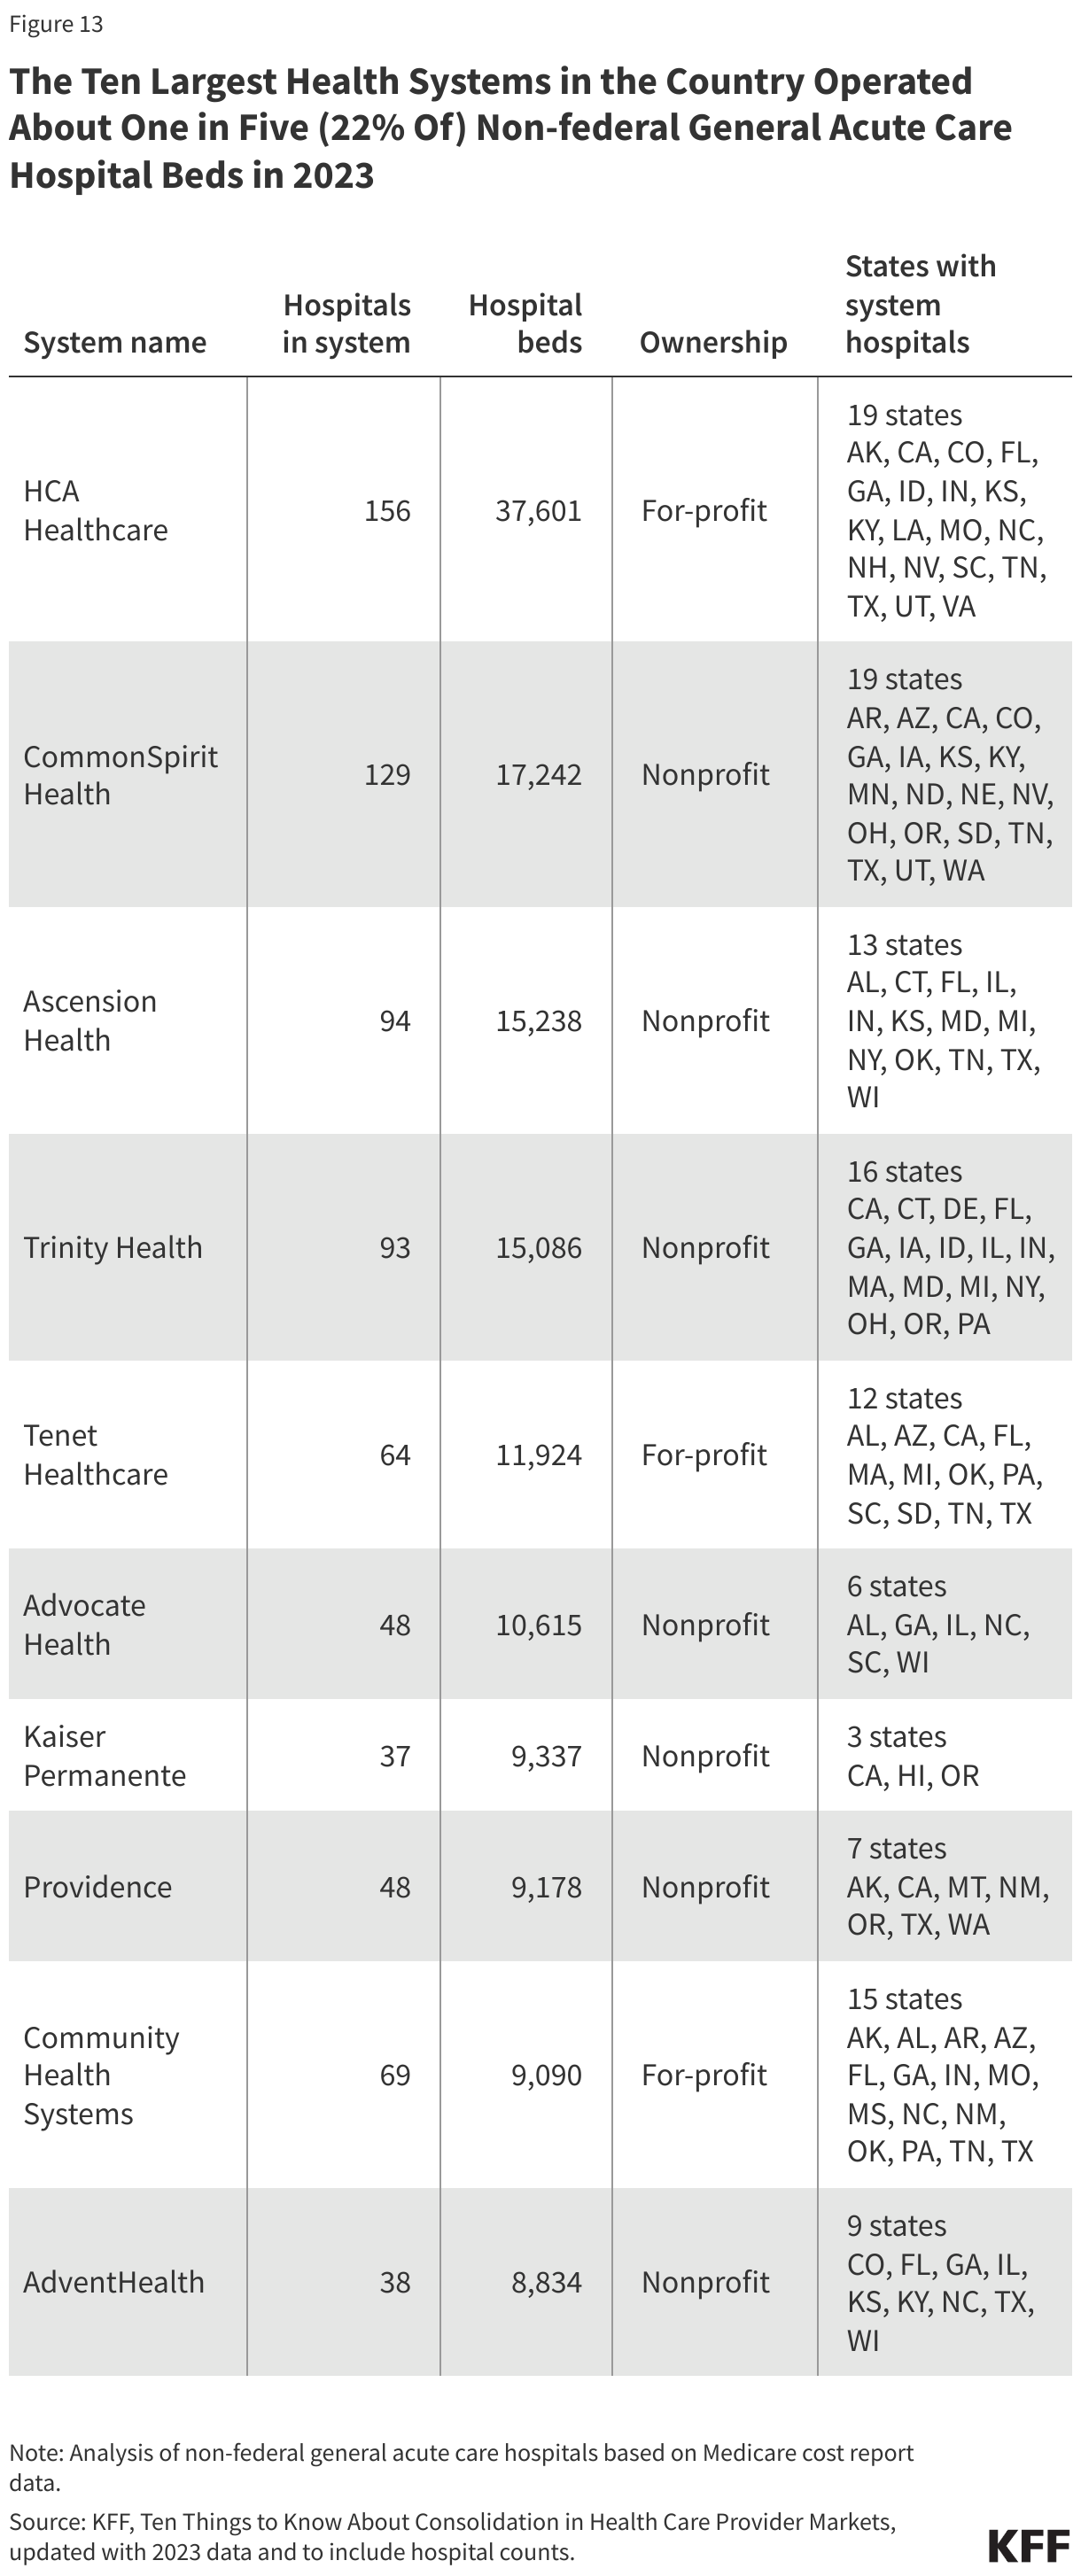
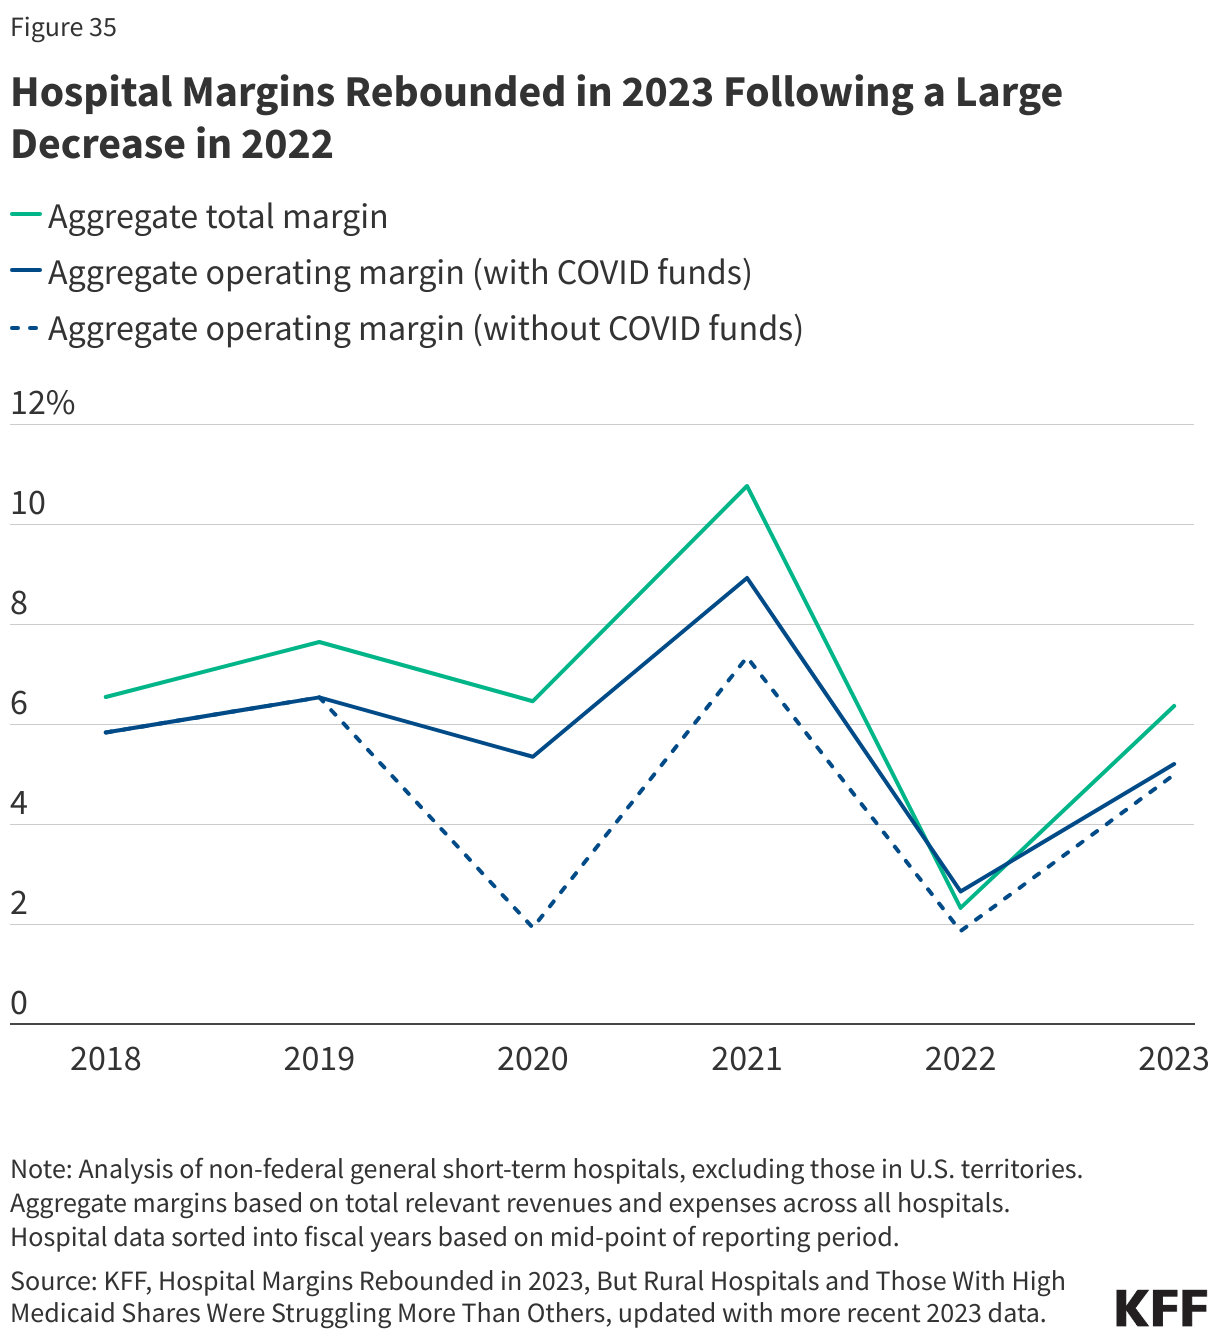
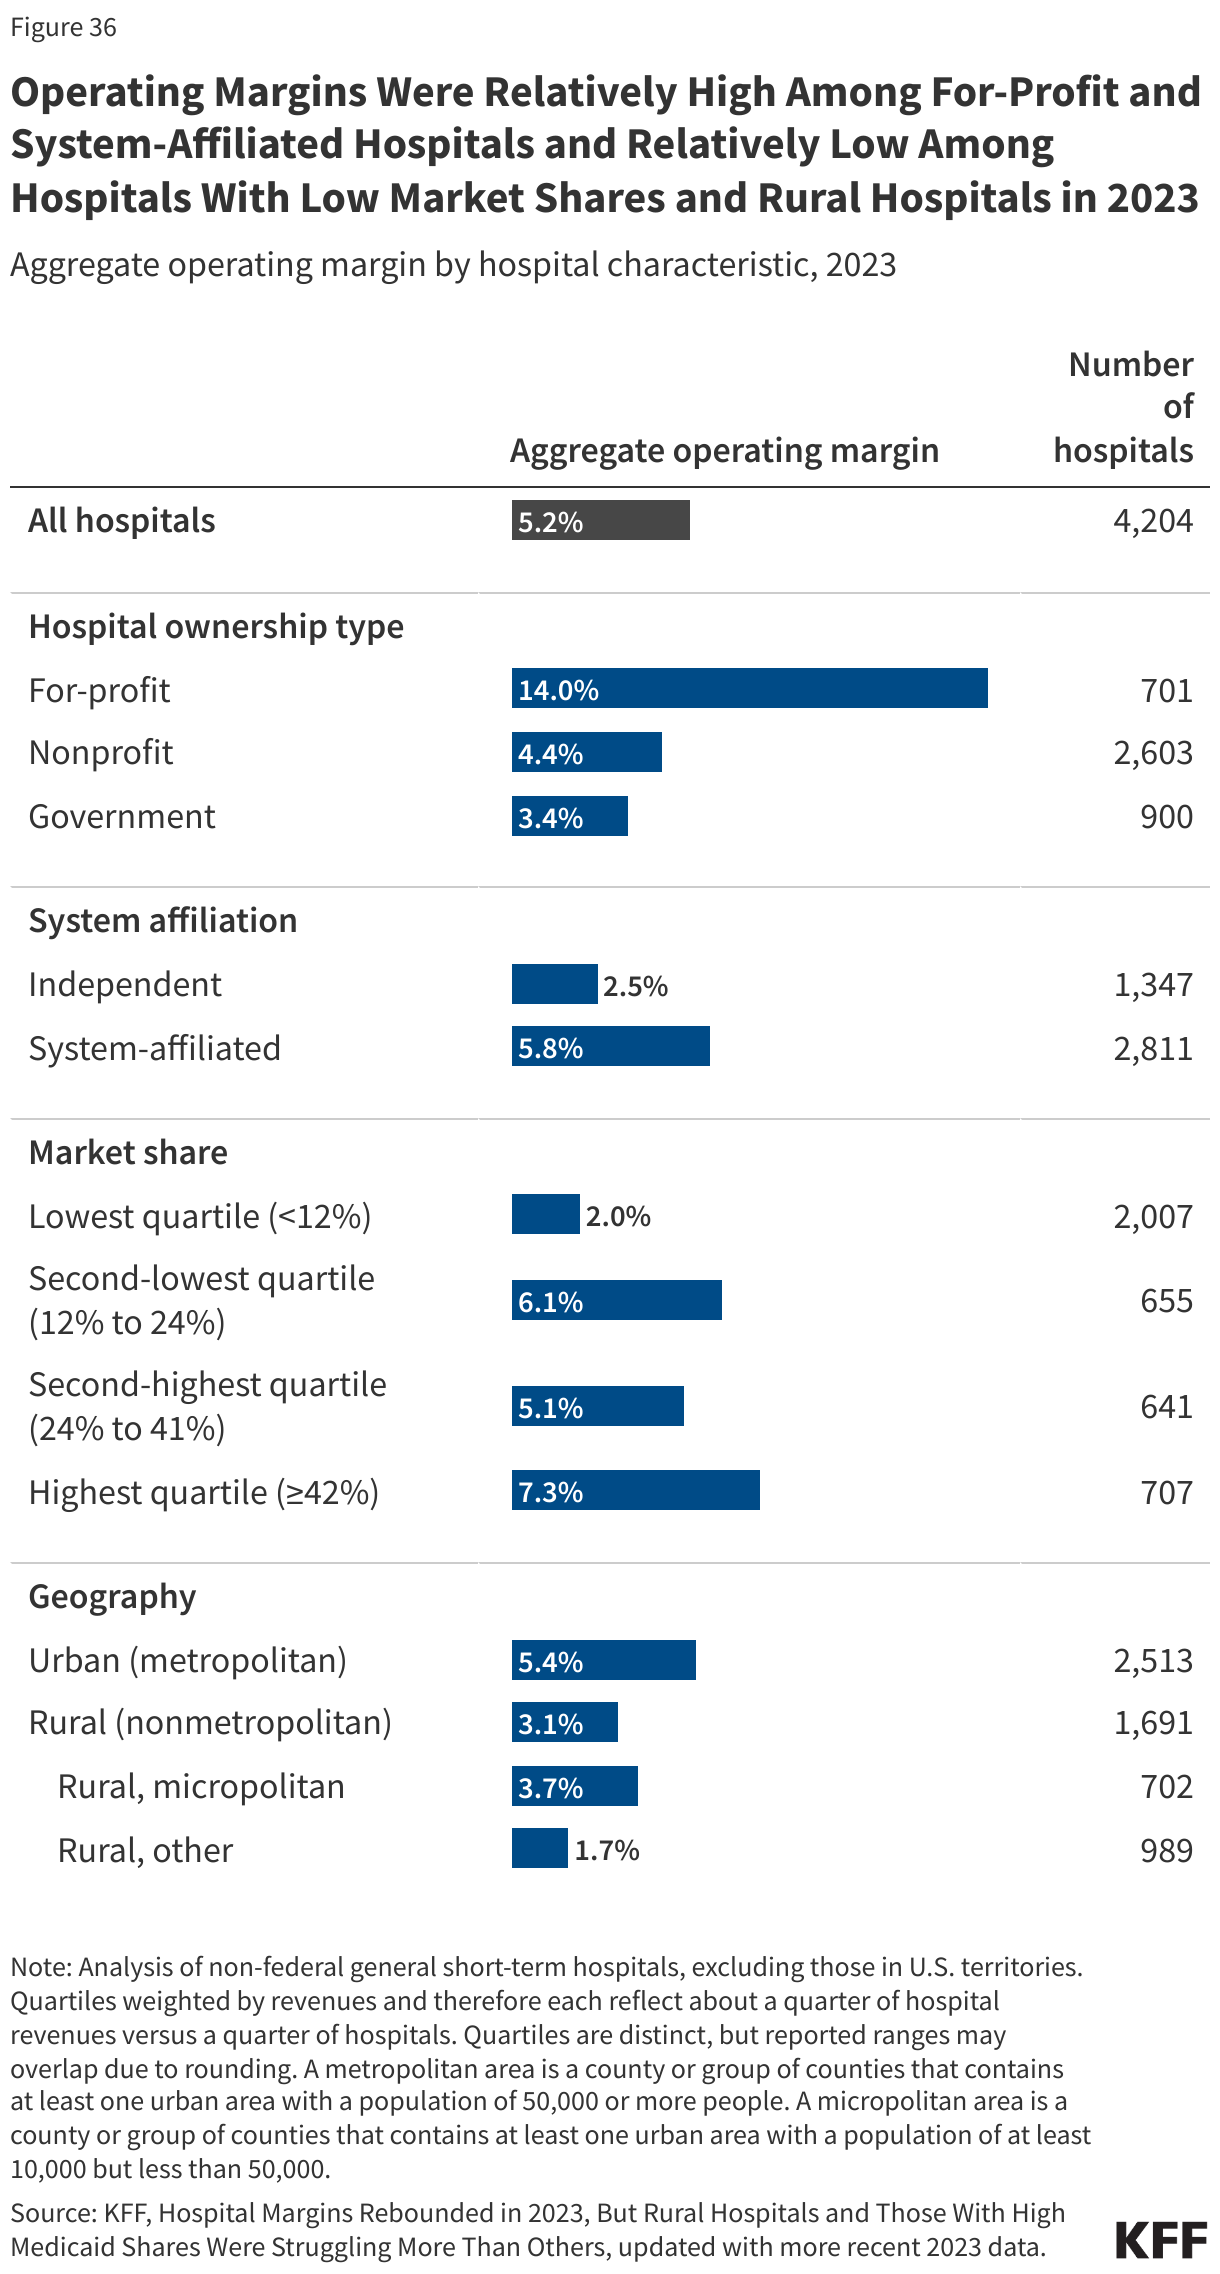
RAND Hospital Data. These data are a cleaned and processed version of annual cost reports that Medicare-certified hospitals are required to submit to the federal government. Cost reports include information about hospital characteristics, utilization, and finances. The RAND Hospital Data also crosswalk hospitals to health systems based on the Agency for Healthcare Research and Quality (AHRQ) Compendium of U.S. Health Systems.

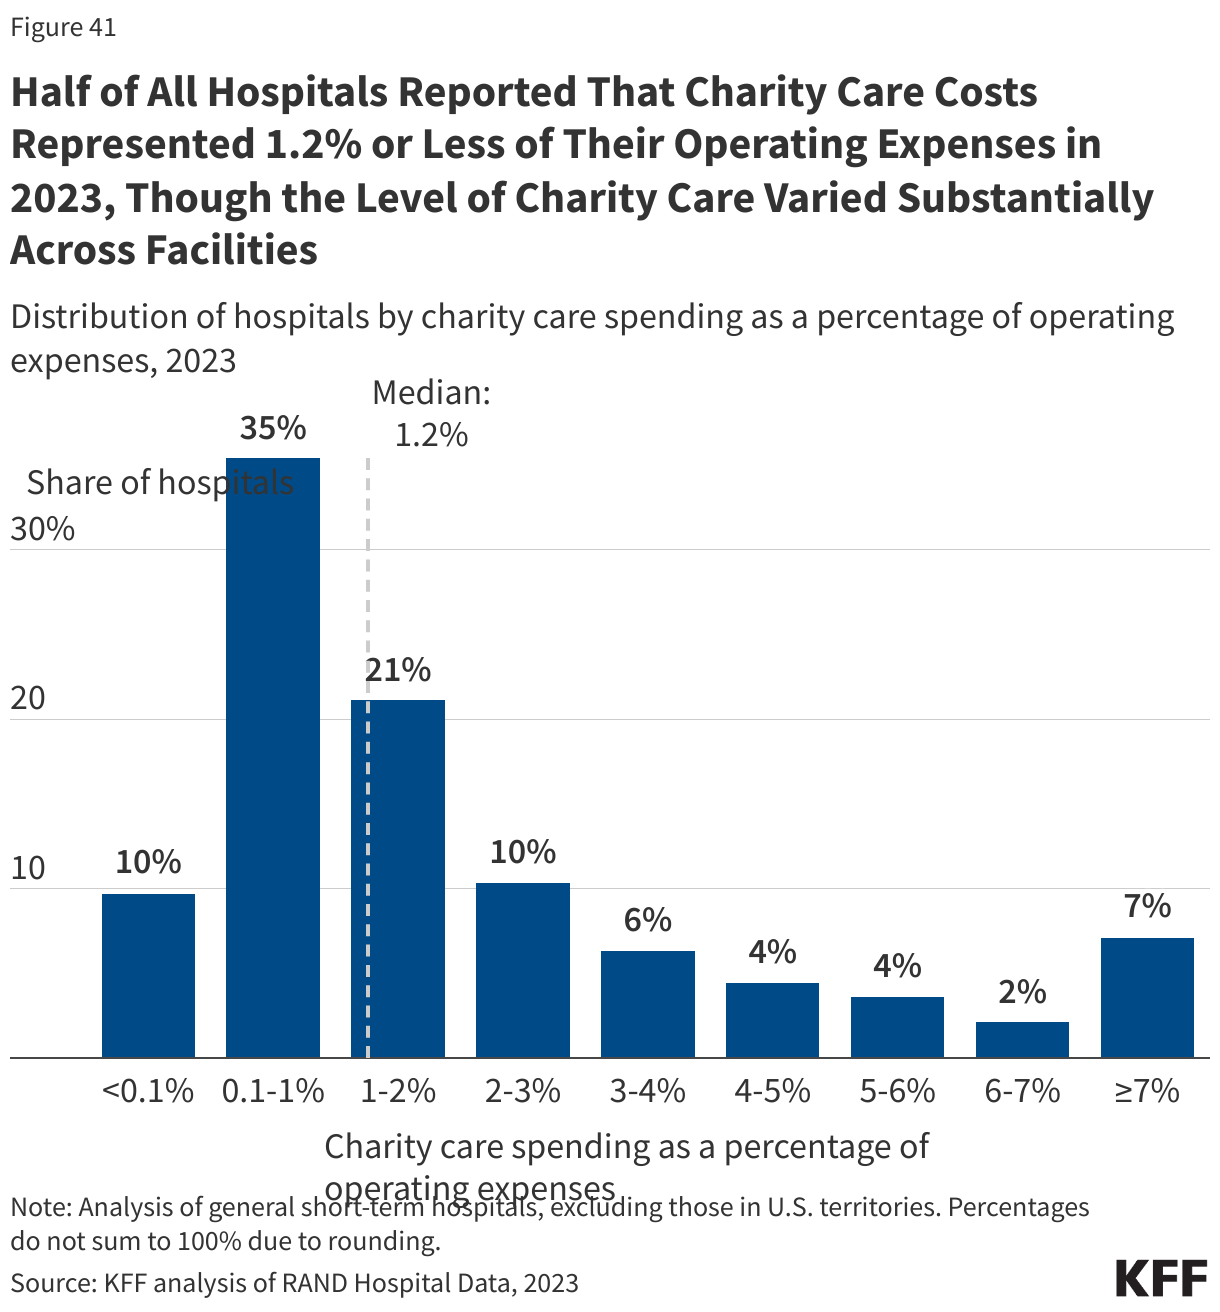
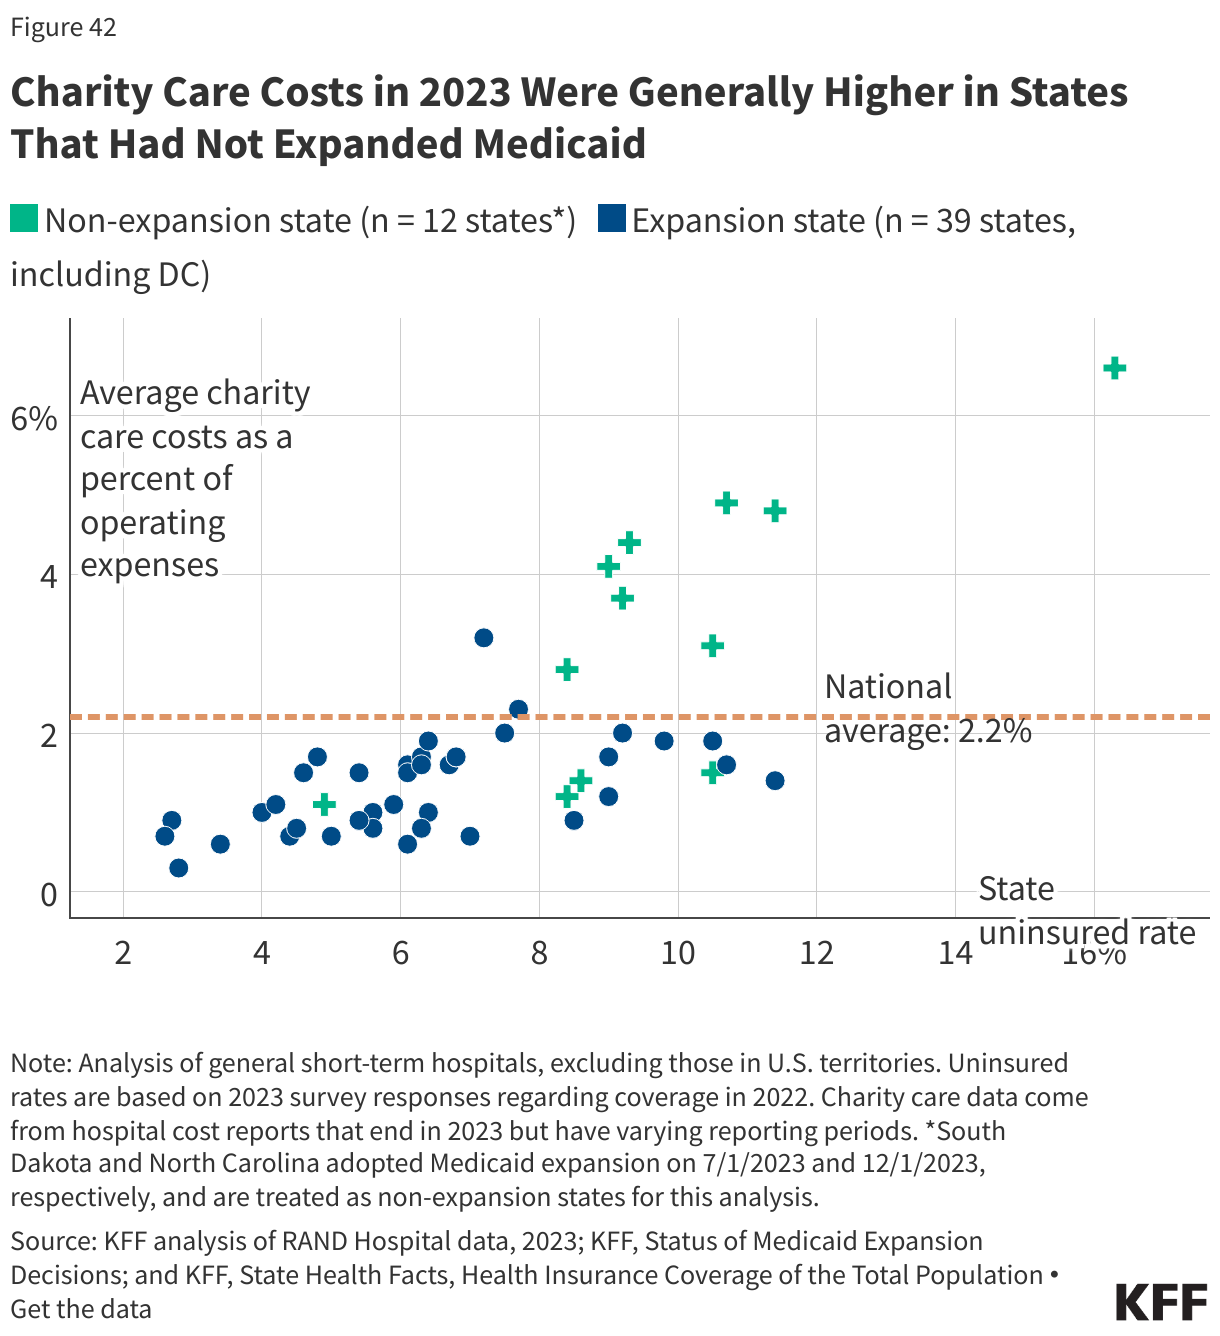
For charity care analyses, missing charity care costs were recoded as $0 if the hospital reported total unreimbursed and uncompensated care costs. Hospitals were excluded if they had missing or negative operating expenses or charity care costs, outlier amounts of charity care as a percent of operating expenses (≥18.1%), or reporting periods less than or greater than one year. Cost report instructions indicate that hospitals should report amounts related to both charity care and uninsured discounts as part of their charity care costs. MedPAC has noted that current HCRIS calculations favor hospitals with higher markups, and it has recommended revisions that would put hospitals on more equal footing and reduce reported charity care costs on average.

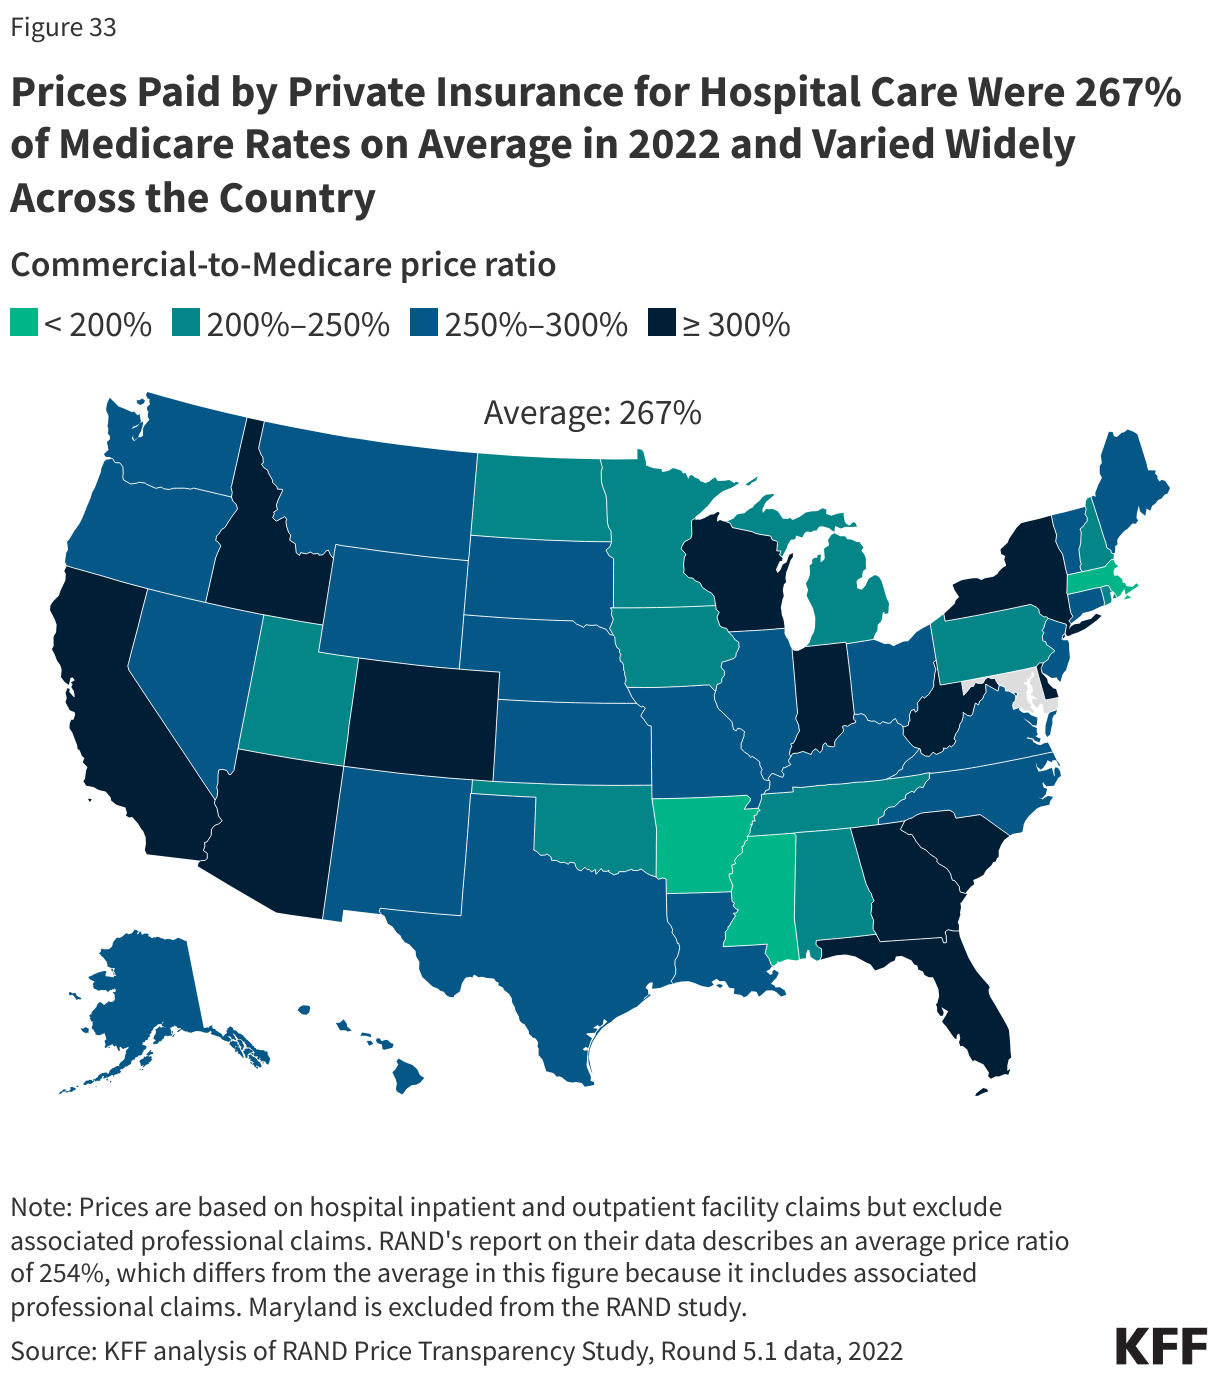
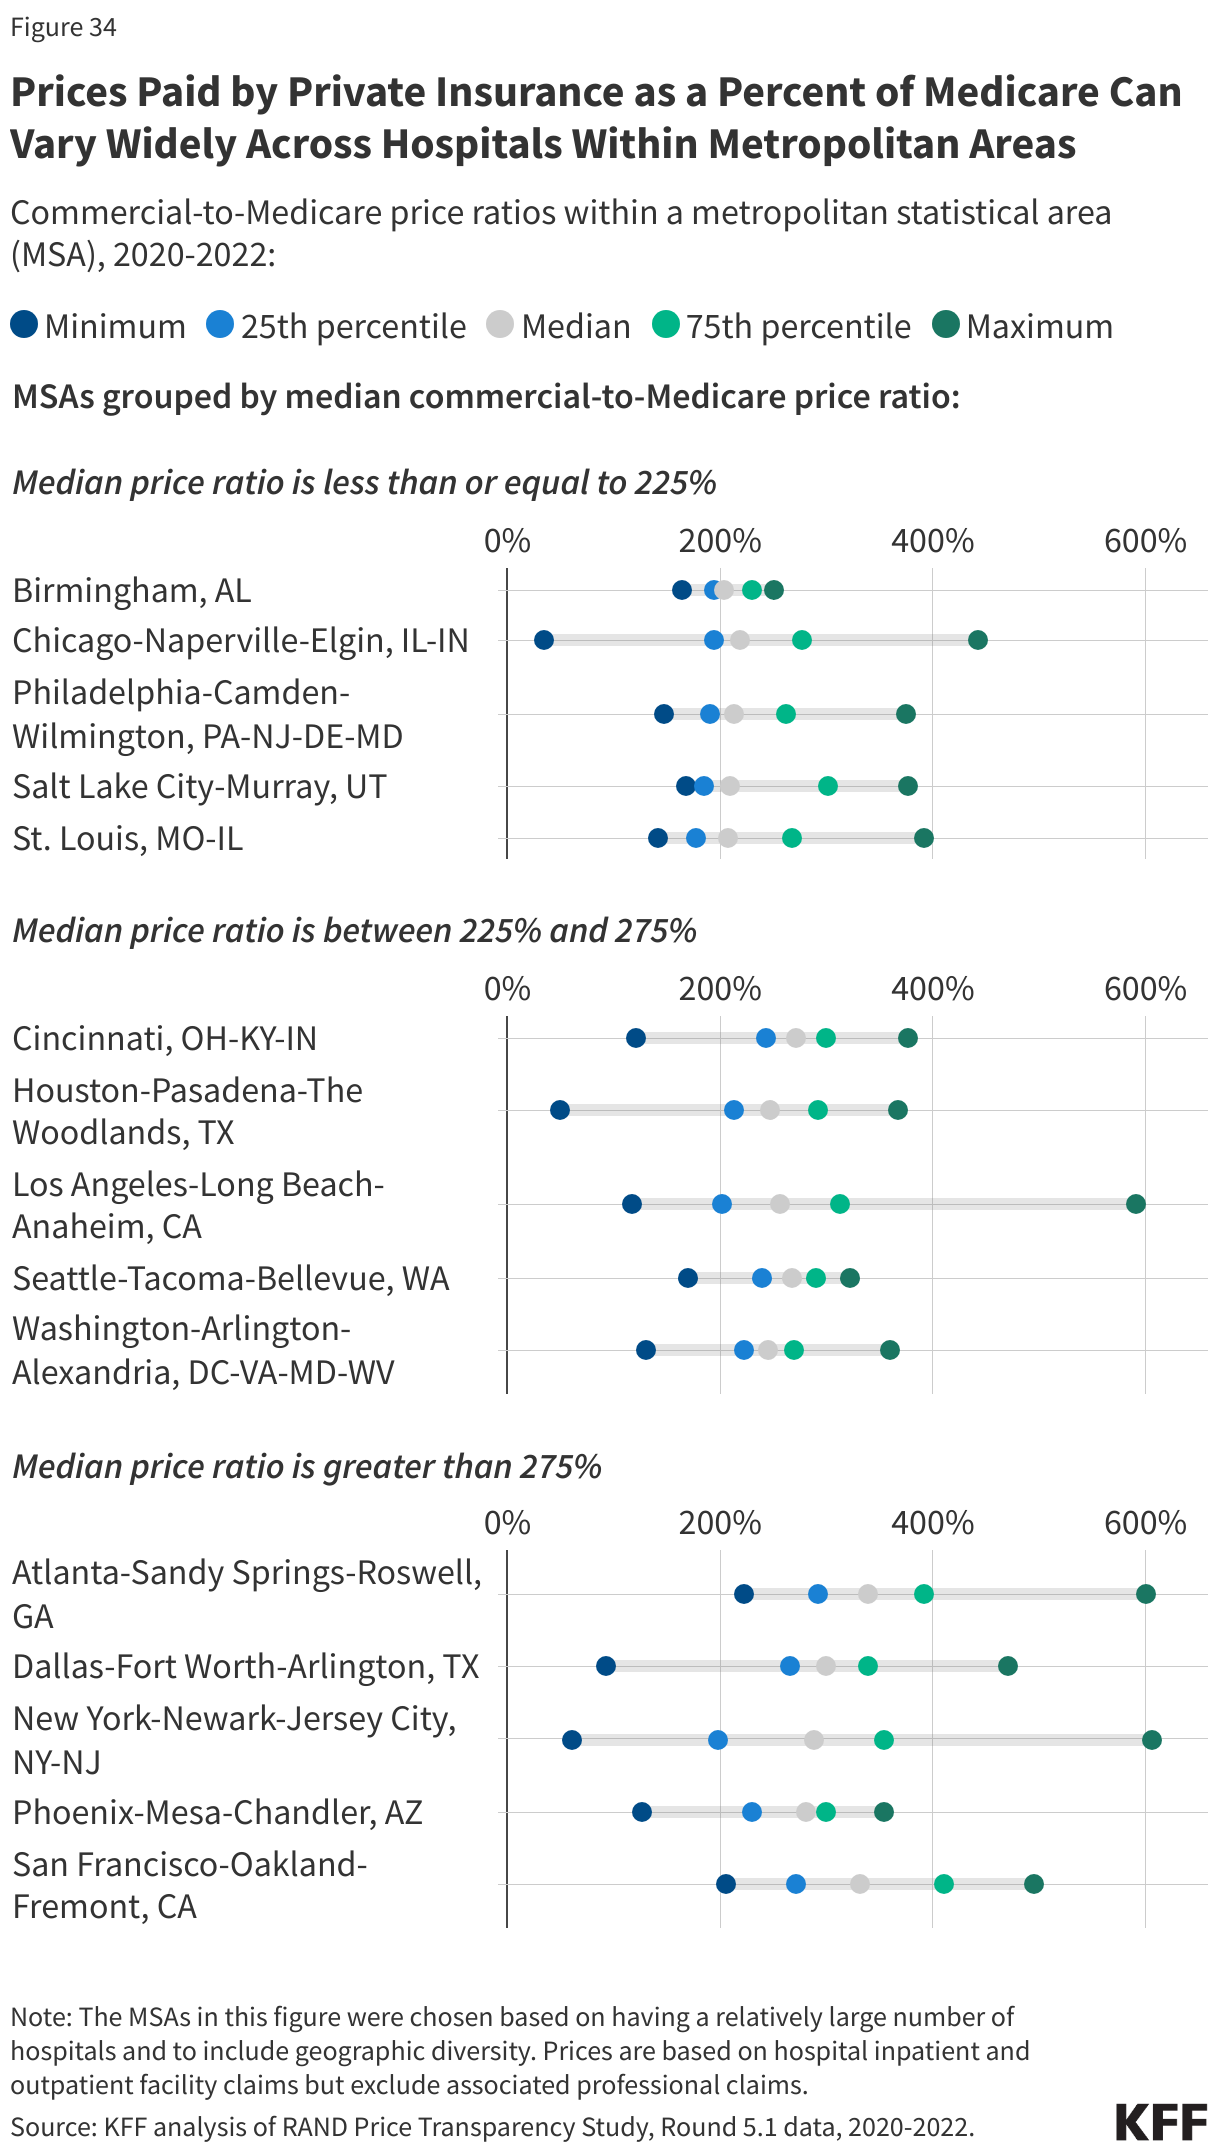
RAND Price Transparency Study, Round 5.1. These data are based on commercial claims for employer-sponsored health insurance plan enrollees collected from participating self-insured employers and health plans as well as from all-payer claims databases (APCDs) from 12 states. Commercial-to-Medicare price ratios are based on the actual allowed amount from the claims and an estimate of the allowed amount had Medicare covered the same services. Ratios presented in key facts include facility claims for hospital inpatient and outpatient services but exclude associated professional claims (which are also available through the RAND study). Analyses of metropolitan areas exclude hospitals for which RAND did not disclose relevant data while state and national analyses include all hospitals in the RAND study.

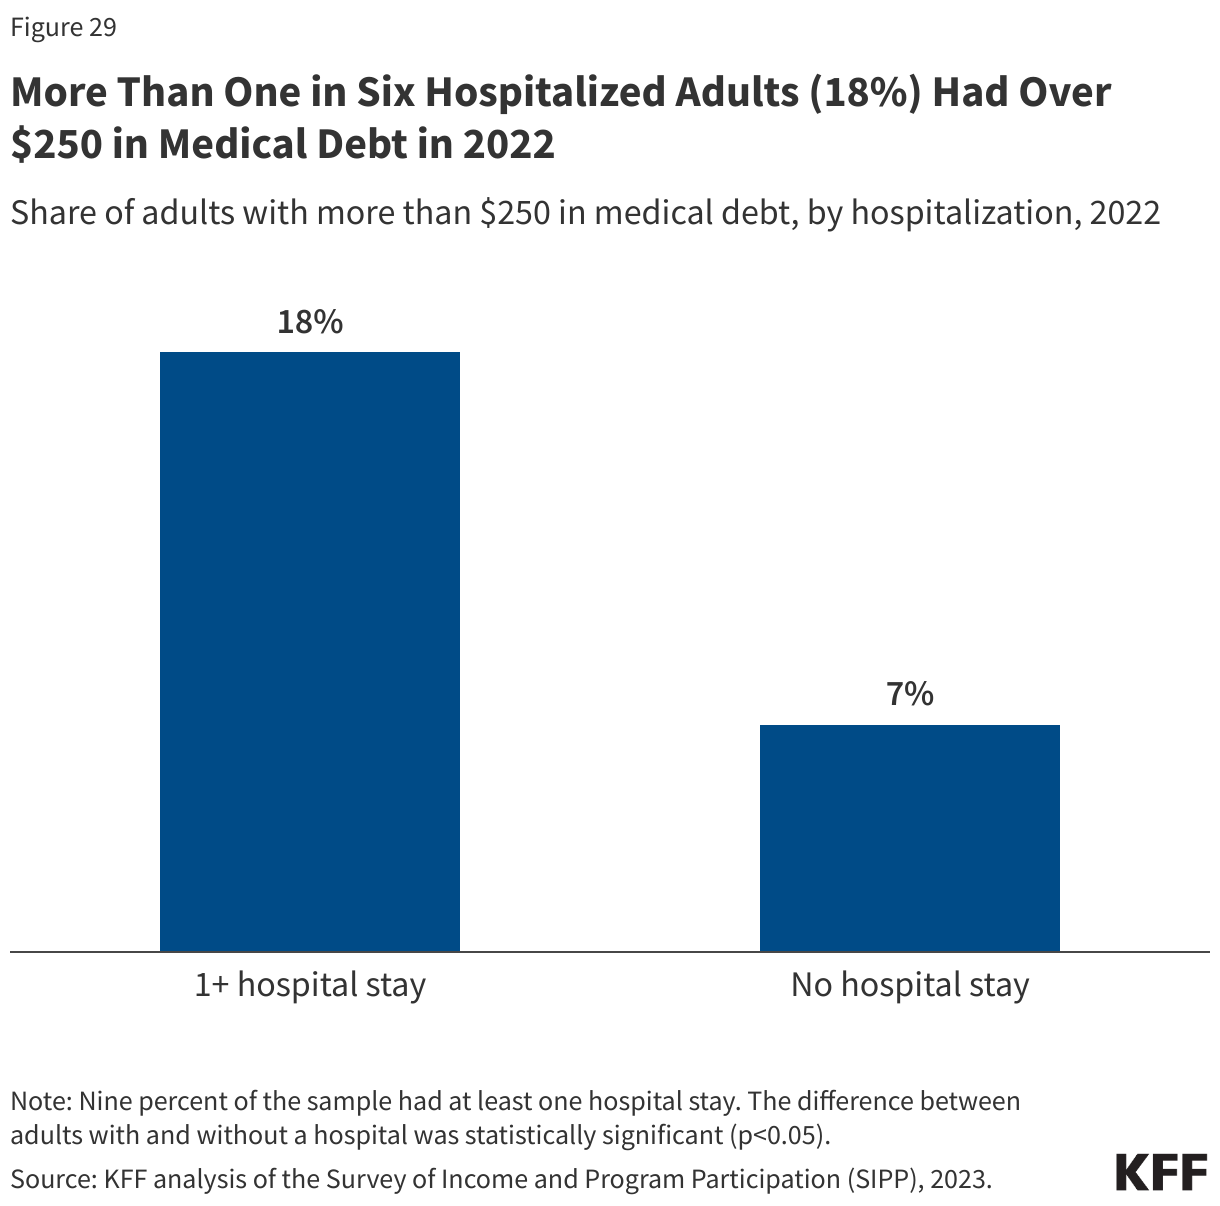
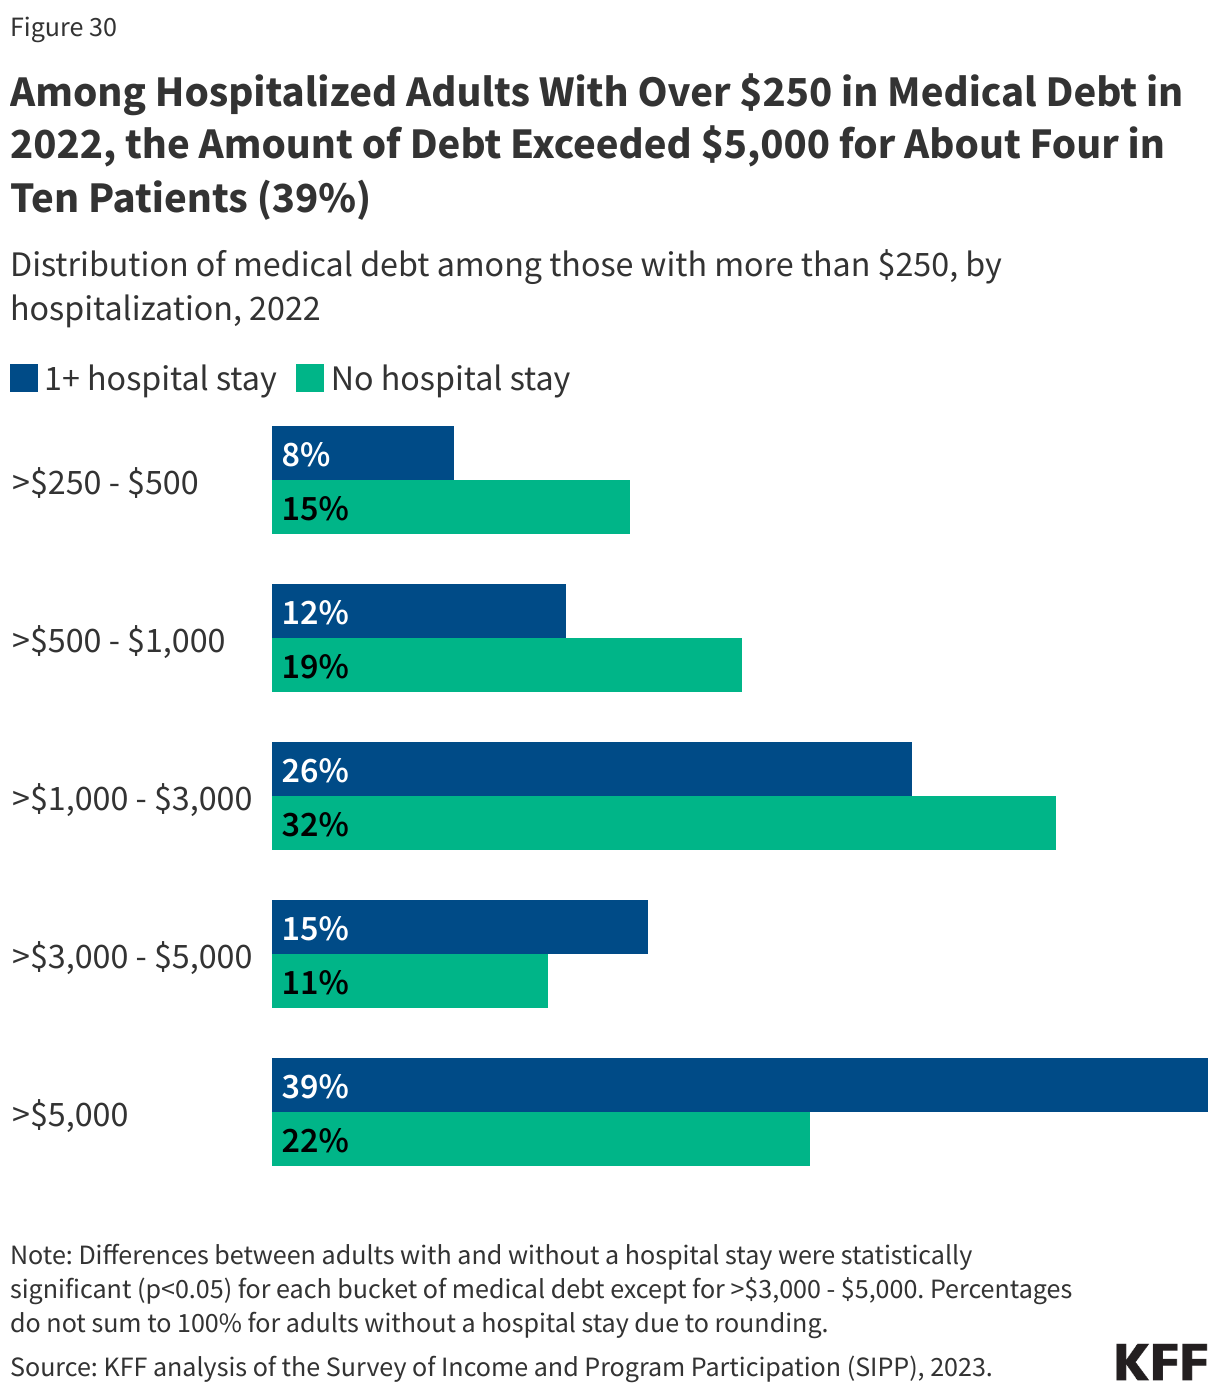
Survey of Income and Program Participation (SIPP). SIPP is a nationally representative survey of the civilian noninstitutionalized population. Among other questions, SIPP asks individuals ages 15 and older about their medical debt. The analysis of medical debt further restricted the sample to adults ages 18 and older.

Back to top

KFF Headquarters: 185 Berry St., Suite 2000, San Francisco, CA 94107 | Phone 650-854-9400
Washington Offices and Barbara Jordan Conference Center: 1330 G Street, NW, Washington, DC 20005 | Phone 202-347-5270

www.kff.org | Email Alerts: kff.org/email | facebook.com/KFF | twitter.com/kff

The independent source for health policy research, polling, and news, KFF is a nonprofit organization based in San Francisco, California.