Home // Racial Equity and Health Policy // Key Data on Health and Health Care by Race and Ethnicity

Key Data on Health and Health Care by Race and Ethnicity

Executive Summary

Introduction

Copy link to Introduction

Racial and ethnic disparities in health and health care remain a persistent challenge in the United States. The COVID-19 pandemic’s uneven impact on people of color drew increased attention to inequities in health and health care, which have been documented for decades and reflect longstanding structural and systemic inequities rooted in historical and ongoing racism and discrimination. KFF’s 2023 Survey on Racism, Discrimination, and Health documents ongoing experiences with racism and discrimination, including in health care settings. While inequities in access to and use of health care contribute to disparities in health, inequities across broader social and economic factors that drive health, often referred to as social determinants of health, also play a major role. Using data to identify disparities and the factors that drive them is important for developing interventions and directing resources to address them, as well as for assessing progress toward achieving greater equity over time.

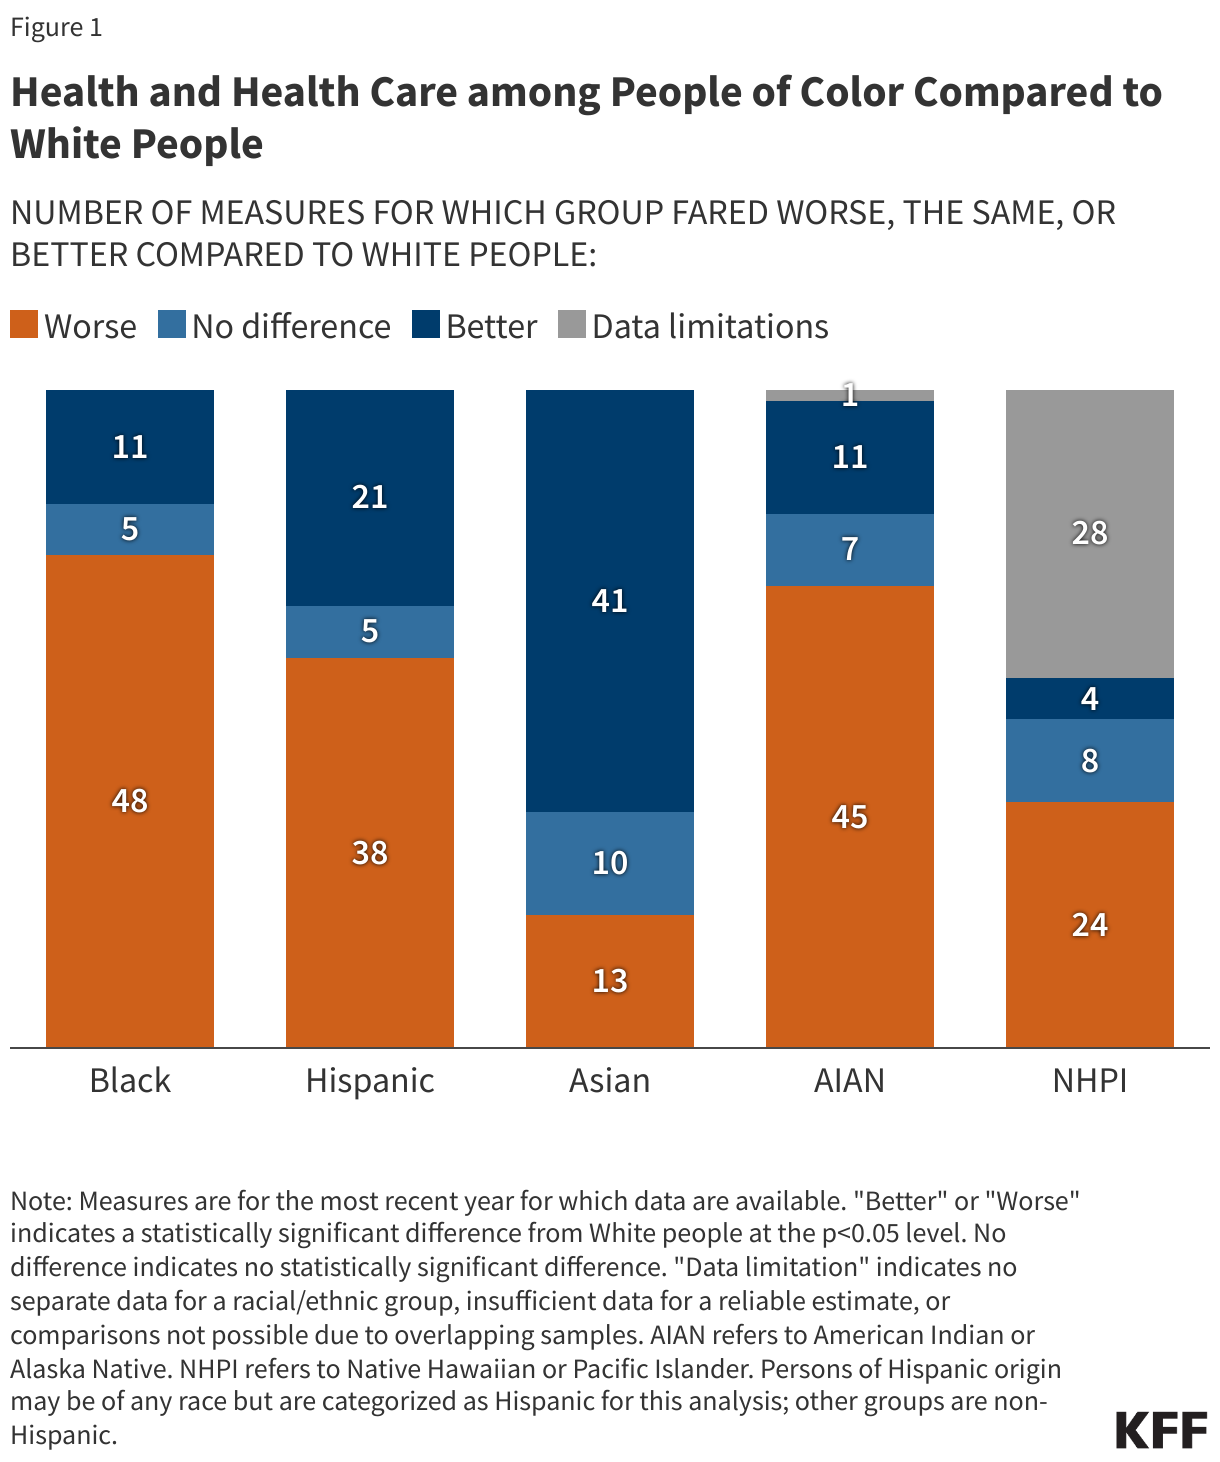
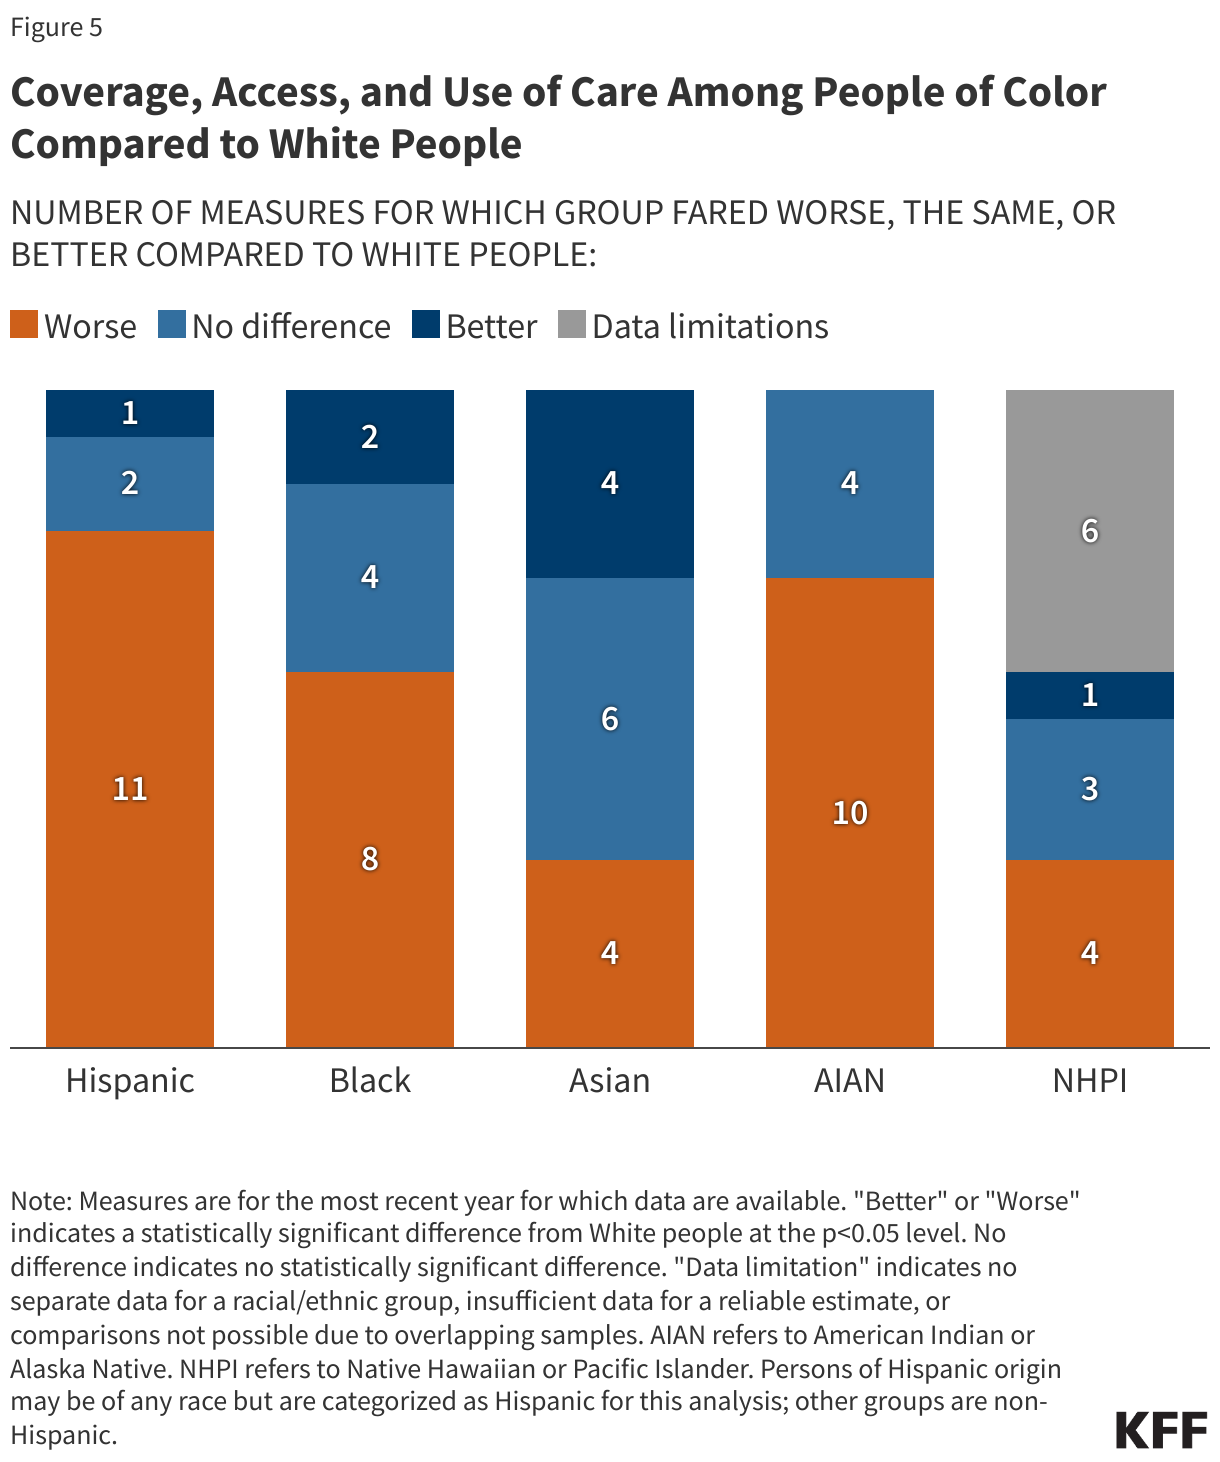
This analysis examines how people of color fare compared to White people across 64 measures of health, health care, and social determinants of health using the most recent data available from federal surveys and administrative sets as well as the 2023 KFF Survey on Racism, Discrimination, and Health, which provides unique nationally-representative measures of adults’ experiences with racism and discrimination, including in health care (see About the Data). Where possible, we present data for six groups: White, Asian, Hispanic, Black, American Indian or Alaska Native (AIAN), and Native Hawaiian or Pacific Islander (NHPI). People of Hispanic origin may be of any race, but we classify them as Hispanic for this analysis. We limit other groups to people who identify as non-Hispanic. When the same or similar measures are available in multiple datasets, we use the data that allow us to disaggregate for the largest number of racial and ethnic groups. Future analyses will reflect new federal standards that will utilize a combined race and ethnicity approach for collecting information and include a new category for people who identify as Middle Eastern or North African. Unless otherwise noted, differences described in the text are statistically significant at the p<0.05 level.

We include data for smaller population groups wherever available. Instances in which the unweighted sample size for a subgroup is less than 50 or the relative standard error is greater than 30% — which are outside of what we would typically include in analysis like this — are noted in the figures, and confidence intervals for those measures are included in the figure. Although these small sample sizes may impact the reliability, validity, and reproducibility of data, they are important to include because they point to potential underlying disparities that are hidden without disaggregated data. For some data measures throughout this brief we refer to “women” but recognize that other individuals also give birth, including some transgender men, nonbinary, and gender-nonconforming persons.

Key Takeaways

Copy link to Key Takeaways

Black, Hispanic, and AIAN people fare worse than White people across the majority of examined measures of health and health care and social determinants of health (Figure 1). Black people fare better than White people for some cancer screening and incidence measures, although they have higher rates of cancer mortality. Despite worse measures of health coverage and access and social determinants of health, Hispanic people fare better than White people for some health measures, including life expectancy, some chronic diseases, and most measures of cancer incidence and mortality. These findings may, in part, reflect variation in outcomes among subgroups of Hispanic people, with better outcomes for some groups, particularly recent immigrants to the U.S. Examples of some key findings include:

  • Nonelderly AIAN (19%) and Hispanic (18%) people were more than twice as likely as their White counterparts (7%) to be uninsured as of 2022.
  • Among adults with any mental illness, Hispanic (40%), Black (38%), and Asian (36%) adults were less likely than White adults (56%) to receive mental health services as of 2022.
  • Roughly, six in ten Hispanic (63%), AIAN (63%), and Black (58%) adults went without a flu vaccine in the 2022-2023 season, compared to less than half of White adults (49%).
  • AIAN (67.9 years) and Black (72.8 years) people had a shorter life expectancy compared to White people (77.5 years) as of 2022, and AIAN, Hispanic, and Black people experienced larger declines in life expectancy than White people between 2019 and 2022; however, all racial and ethnic groups experienced a small increase in life expectancy between 2021 and 2022.
  • Black (10.9 per 1,000) and AIAN (9.1 per 1,000) infants were at least two times as likely to die as White infants (4.5 per 1,000) as of 2022. Black and AIAN women also had the highest rates of pregnancy-related mortality.
  • AIAN (24%) and Black (21%) children were more than three times as likely to have food insecurity as White children (6%), and Hispanic children (15%) were over twice as likely to have food insecurity than White children (6%) as of 2022.

Asian people in the aggregate fare the same or better compared to White people for most examined measures. However, they fare worse for some measures, including receipt of some routine care and screening services, and some social determinants of health, including home ownership, crowded housing, and experiences with racism. They also have higher shares of people who are noncitizens or who have limited English proficiency (LEP), which could contribute to barriers to accessing health coverage and care. Moreover, the aggregate data may mask underlying disparities among subgroups of the Asian population. Asian people also report experiences with discrimination in daily life, which is associated with adverse effects on mental health and well-being.

Data gaps largely prevent the ability to identify and understand health disparities for NHPI people. Data are insufficient or not disaggregated for NHPI people for a number of the examined measures. Among available data, NHPI people fare worse than White people for the majority of measures. There are no significant differences for some measures, but this largely reflects the smaller sample size for NHPI people in many datasets, which limits the power to detect statistically significant differences.

These data highlight the importance of continued efforts to address disparities in health and health care and show that it will be key for efforts to address factors both within and beyond the health care system. While these data provide insight into the status of disparities, ongoing data gaps and limitations hamper the ability to get a complete picture, particularly for smaller population groups and among subgroups of the broader racial and ethnic categories. As the share of people who identify as multiracial grows, it will be important to develop improved methods for understanding their experiences. How data are collected and reported by race and ethnicity is important for understanding disparities and efforts to address them. Recent changes to federal standards for collecting and reporting racial and ethnic data are intended to better represent the diversity of the population and will likely support greater disaggregation of data to identify and address disparities.

Racial Diversity Within the U.S. Today

TOTAL POPULATION BY RACE AND ETHNICITY

Copy link to TOTAL POPULATION BY RACE AND ETHNICITY

About four in ten people (42%) in the United States identify as people of color (Figure 2). This group includes 19% who are Hispanic, 12% who are Black, 6% who are Asian, 1% who are AIAN, less than 1% who are NHPI, and 5% who identify as another racial category, including individuals who identify as more than one race. The remaining 58% of the population are White. The share of the population who identify as people of color has been growing over time, with the largest growth occurring among those who identify as Hispanic or Asian. The racial diversity of the population is expected to continue to increase, with people of color projected to account for over half of the population by 2050. Recent changes to how data on race and ethnicity are collected and reported may also influence measures of the diversity of the population.

RACIAL DIVERSITY BY STATE

Copy link to RACIAL DIVERSITY BY STATE

Certain areas of the country—particularly in the South, Southwest, and parts of the West—are more racially diverse than others (Figure 3). Overall, the share of the population who are people of color ranges from 10% or fewer in Maine, Vermont, and West Virginia to 50% or more of the population in California, District of Columbia, Georgia, Hawaii, Maryland, Nevada, New Mexico, and Texas. Most people of color live in the South and West. More than half (59%) of the Black population resides in the South, and nearly eight in ten Hispanic people live in the West (38%) or South (39%). About three quarters of the NHPI population (75%), almost half (49%) of the AIAN population, and 43% of the Asian population live in the Western region of the country.

TOTAL POPULATION BY AGE, RACE, AND ETHNICITY

Copy link to TOTAL POPULATION BY AGE, RACE, AND ETHNICITY

People of color are younger compared to White people. Hispanic people are the youngest racial and ethnic group, with 31% ages 18 or younger and 56% below age 35 (Figure 4). Roughly half of Black (48%), AIAN (50%), and NHPI (51%) people are below age 35, compared to 42% of Asian people and 38% of White people.

Health Coverage, Access to and Use of Care

RACIAL DISPARITIES IN HEALTH COVERAGE, ACCESS, AND USE

Copy link to RACIAL DISPARITIES IN HEALTH COVERAGE, ACCESS, AND USE

Overall, Hispanic and AIAN people fare worse compared to White people across most examined measures of health coverage, and access to and use of care (Figure 5). Black people fare worse than White people across half of these measures, and experiences for Asian people are mostly similar to or better than White people across these examined measures. NHPI people fare worse than White people across some measures, but several measures lacked sufficient data for a reliable estimate for NHPI people.

HEALTH COVERAGE

Copy link to HEALTH COVERAGE

Despite gains in health coverage across racial and ethnic groups over time, nonelderly AIAN, Hispanic, NHPI, and Black people remain more likely to be uninsured compared to their White counterparts. After the Affordable Care Act (ACA), Medicaid, and Marketplace coverage expansions took effect in 2014, all racial and ethnic groups experienced large increases in coverage. Beginning in 2017, coverage gains began reversing and the number of uninsured people increased for three consecutive years. However, between 2019 and 2022, there were small gains in coverage across most racial and ethnic groups, with pandemic enrollment protections in Medicaid and enhanced ACA premium subsidies. Despite these gains over time, disparities in health coverage persist as of 2022. Nonelderly AIAN (19%) and Hispanic (18%) people have the highest uninsured rates (Figure 6). Uninsured rates for nonelderly NHPI (13%) and Black (10%) people are also higher than the rate for their White counterparts (7%). Nonelderly White (7%) and Asian (6%) people have the lowest uninsured rates.

ACCESS TO AND USE OF CARE

Copy link to ACCESS TO AND USE OF CARE

Most groups of nonelderly adults of color are more likely than nonelderly White adults to report not having a usual doctor or provider and going without care. Roughly one third (36%) of Hispanic adults, one quarter of AIAN (25%) and NHPI (24%) adults, and about one in five (21%) Asian adults report not having a personal health care provider compared to 17% of White adults (Figure 7). The share of Black adults who report not having a personal health care provider is the same as their White counterparts (17% for both). In addition, Hispanic (21%), NHPI (18%), AIAN (16%), and Black (14%) adults are more likely than White adults (11%) to report not seeing a doctor in the past 12 months because of cost, while Asian adults (8%) are less likely than White adults to say they went without a doctor visit due to cost. Hispanic (32%) and AIAN (31%) adults are more likely than White adults (28%) to say they went without a routine checkup in the past year, while Asian (26%), NHPI (24%), and Black (20%) adults are less likely to report going without a checkup. Hispanic and AIAN (both 45%) and Black (40%) adults are more likely than White adults (34%) to report going without a visit to a dentist or dental clinic in the past year.

In contrast to the patterns among adults, racial and ethnic differences in access to and use of care are more mixed for children. Nearly one in ten (9%) Hispanic children lack a usual source of care when sick compared to 5% of White children, but there are no significant differences for other groups for which data are available (Figure 8). Similar shares of Hispanic (7%), Asian (7%), and Black (4%) children went without a health care visit in the past year as White children (6%). However, higher shares of Asian (23%) and Black (21%) children went without a dental visit in the past year compared to White children (17%). Data are not available for NHPI children for these measures, and data for AIAN children should be interpreted with caution due to small sample sizes and large standard errors.

Among adults with any mental illness, Black, Hispanic, and Asian adults are less likely than White adults to report receiving mental health services. Roughly half (56%) of White adults with any mental illness report receiving mental health services in the past year. (Figure 9). In contrast, about four in ten (40%) Hispanic adults and just over a third of Black (38%) and Asian (36%) adults with any mental illness report receiving mental health care in the past year. Data are not available for AIAN and NHPI adults.

Experiences across racial and ethnic groups are mixed regarding receipt of recommended cancer screenings (Figure 10). Among women ages 50-74 (the age group recommended for screening prior to updates in 2024, which lowered the starting age to 40), Black people (24%) are less likely than White people (29%) to go without a recent mammogram. In contrast, AIAN (41%) and Hispanic (35%) people are more likely than White people (29%) to go without a mammogram. Among those recommended for colorectal cancer screening, Hispanic, Asian, AIAN, NHPI, and Black people are more likely than White people to not be up to date on their screening. Increases in cancer screenings, particularly for breast, colorectal, and prostate cancers, have been identified as one of the drivers of the decline in cancer mortality over the past few decades.

Racial and ethnic differences persist in flu and childhood vaccinations (Figure 11). Roughly six in ten Hispanic (63%), AIAN (63%), and Black (58%) adults went without a flu vaccine in the 2022-2023 season compared to about half (49%) of White adults. However, among children, White children (44%) are more likely than Asian (28%) and Hispanic (39%) children to go without the flu vaccine; data are not available to assess flu vaccinations among NHPI adults and children. In 2019-2020, AIAN (42%), Black (37%), and Hispanic (33%) children were more likely than White children (28%) to have not received all recommended childhood immunizations.

Health Status and Outcomes

RACIAL DISPARITIES IN HEALTH STATUS AND OUTCOMES

Copy link to RACIAL DISPARITIES IN HEALTH STATUS AND OUTCOMES

Black and AIAN people fare worse than White people across the majority of examined measures of health status and outcomes (Figure 12). In contrast, Asian and Hispanic people fare better than White people for a majority of examined health measures. Nearly half of the examined measures did not have data available for NHPI people, limiting the ability to understand their experiences. Among available data, NHPI people fare worse than White people for more than half of the examined measures.   

LIFE EXPECTANCY

Copy link to LIFE EXPECTANCY

AIAN and Black people have a shorter life expectancy at birth compared to White people, and AIAN, Hispanic, and Black people experienced larger declines in life expectancy than White people between 2019 and 2021. Life expectancy at birth represents the average number of years a group of infants would live if they were to experience the age-specific death rates prevailing during a specified period. Life expectancy declined by 2.7 years between 2019 and 2021, largely reflecting an increase in excess deaths due to COVID-19, which disproportionately impacted Black, Hispanic, and AIAN people. AIAN people experienced the largest life expectancy decline of 6.6 years, followed by Hispanic (4.2 years) and Black people (4.0 years), and a smaller decline of 2.4 years for White people. Asian people had the smallest decline in life expectancy of 2.1 years between 2019 and 2021. Provisional data from 2022 show that overall life expectancy increased across all racial and ethnic groups between 2021 and 2022, but racial disparities persist (Figure 13). Life expectancy is lowest for AIAN people at 67.9 years, followed by Black people at 72.8 years, while White and Hispanic people have higher life expectancies of 77.5 and 80 years, respectively, and Asian people have the highest life expectancy at 84.5 years. Life expectancies are even lower for AIAN and Black males, at 64.6 and 69.1 years, respectively. Data are not available for NHPI people.

SELF-REPORTED HEALTH STATUS

Copy link to SELF-REPORTED HEALTH STATUS

Black, Hispanic, and AIAN adults are more likely to report fair or poor health status than their White counterparts, while Asian adults are less likely to indicate fair or poor health. Nearly three in ten (29%) AIAN adults and roughly two in ten Hispanic (23%) and Black (21%) adults report fair or poor health status compared to 16% of White adults (Figure 14). One in ten Asian adults report fair or poor health status.

BIRTH RISKS AND OUTCOMES

Copy link to BIRTH RISKS AND OUTCOMES

NHPI (62.8 per 100,000), Black (39.9 per 100,000), and AIAN (32 per 100,000) women have the highest rates of pregnancy-related mortality (deaths within one year of pregnancy) between 2017-2019, while Hispanic women (11.6 per 100,000) have the lowest rate (Figure 15). More recent data for maternal mortality, which measures deaths that occur during pregnancy or within 42 days of pregnancy, shows that Black women (49.5 per 100,000) have the highest maternal mortality rate across racial and ethnic groups in 2022 (Figure 16). However, maternal mortality rates decreased significantly across most racial and ethnic groups between 2021 and 2022. Experts suggest the decline may reflect a return to pre-pandemic levels following the large increase in maternal death rates due to COVID-19 related deaths. The Dobbs decision eliminating the constitutional right to abortion could widen the already large disparities in maternal health as people of color may face disproportionate challenges accessing abortions due to state restrictions.

Black, AIAN, and NHPI women have higher shares of preterm births, low birthweight births, or births for which they received late or no prenatal care compared to White women (Figure 17). Additionally, Asian women are more likely to have low birthweight births than White women. Notably, NHPI women (22%) are four times more likely than White women (5%) to begin receiving prenatal care in the third trimester or to receive no prenatal care at all.

Teen birth rates have declined over time, but the birth rates among Black, Hispanic, AIAN, and NHPI teens are over two times higher than the rate among White teens (Figure 18). In contrast, the birth rate for Asian teens is more than four times lower than the rate for White teens.

Infants born to women of color are at higher risk for mortality compared to those born to White women. Infant mortality rates have declined over time although provisional 2022 data suggest a slight increase relative to 2021. As of 2022, Black (10.9 per 1,000) and AIAN (9.1 per 1,000) infants are at least two times as likely to die as White infants (4.5 per 1,000) (Figure 19). NHPI infants (8.5 per 1,000) are nearly twice as likely to die as White infants (4.5 per 1,000). Asian infants have the lowest mortality rate at 3.5 per 1,000 live births.

HIV AND AIDS DIAGNOSIS INDICATORS

Copy link to HIV AND AIDS DIAGNOSIS INDICATORS

Black, Hispanic, NHPI, and AIAN people are more likely than White people to be diagnosed with HIV or AIDS, the most advanced stage of HIV infection. In 2021, the HIV diagnosis rate for Black people is roughly eight times higher than the rate for White people, and the rate for Hispanic people is about four times higher than the rate for White people (Figure 20). AIAN and NHPI people also have higher HIV diagnosis rates compared to White people. Similar patterns are present in AIDS diagnosis rates, the most advanced stage of HIV, reflecting barriers to treatment. Black people have a roughly nine times higher rate of AIDS diagnosis compared to White people, and Hispanic, AIAN, and NHPI people also have higher rates of AIDS diagnoses. Most groups have seen decreases in HIV and AIDS diagnosis rates since 2013, although the HIV diagnosis rate has remained stable for Hispanic people and increased for AIAN and NHPI people.

Among people ages 13 and older living with diagnosed HIV infection, viral suppression rates are lower among AIAN (64%), Hispanic (64%), NHPI (63%), and Black (62%) people compared with White (72%) and Asian (70%) people (Figure 21). Viral suppression refers to having less than 200 copies of HIV per milliliter of blood. Increasing the viral suppression rate among people with HIV is one of the key strategies of the Ending the HIV Epidemic in the U.S. initiative. Viral suppression promotes optimal health outcomes for people with HIV and also offers a preventive benefit as when someone is virally suppressed, they cannot sexually transmit HIV.

CHRONIC DISEASE AND CANCER

Copy link to CHRONIC DISEASE AND CANCER

The prevalence of chronic disease varies across racial and ethnic groups and by type of disease. Diabetes rates for AIAN (18%), Black (16%), and Hispanic (13%) adults are all higher than the rate for White adults (11%). AIAN people (11%) are more likely to have had a heart attack or heart disease than White people (8%), while rates for Black (6%), NHPI (6%), Hispanic (4%) and Asian (3%) people are lower than White people. Black (12%) and AIAN (13%) adults have higher rates of asthma compared to their White counterparts (10%), while rates for Hispanic (8%) and Asian (5%) adults are lower, and the rate for NHPI is the same (10%). Among children, Black children (16%) are nearly twice as likely to have asthma compared to White children (9%), while Asian children (6%) have a lower asthma rate (Figure 22). Differences are not significant for other racial and ethnic groups, and data are not available for NHPI children.

AIAN, NHPI, and Black people are roughly twice as likely as White people to die from diabetes, and Black people are more likely than White people to die from heart disease (Figure 23). Hispanic people (28.3 per 100,000) also have a higher diabetes death rate compared to White people (21.3 per 100,000). In contrast, Asian people (17.2 per 100,000) are less likely than White people (21.3 per 100,000) to die from diabetes, and AIAN, Hispanic, and Asian people have lower heart disease death rates than their White counterparts.

People of color generally have lower rates of new cancer cases compared to White people, but Black people have higher incidence rates for some cancer types (Figure 24). Black people have lower rates of cancer incidence compared to White people for cancer overall, and most of the leading types of cancer examined. However, they have higher rates of new colon, and rectum, and prostate cancer. AIAN people have a higher rate of colon and rectum cancer than White people. Other groups have lower cancer incidence rates than White people across all examined cancer types.

Although Black people do not have higher cancer incidence rates than White people overall and across most types of cancer, they are more likely to die from cancer. Black people have a higher cancer death rate than White people for cancer overall and for most of the leading cancer types (Figure 25). In contrast, Hispanic, Asian and Pacific Islander, and AIAN people have lower cancer mortality rates across most cancer types compared to White people. The higher mortality rate among Black people despite similar or lower rates of incidence compared to White people could reflect a combination of factors, including more limited access to care, later stage of diagnosis, more comorbidities, and lower receipt of guideline-concordant care, which are driven by broader social and economic inequities.

COVID-19 DEATHS

Copy link to COVID-19 DEATHS

AIAN, Hispanic, NHPI, and Black people have higher rates of COVID-19 deaths compared to White people. As of March 2024, provisional age-adjusted data from the Centers for Disease Control and Prevention (CDC) show that between 2020 and 2023, AIAN people are roughly two times as likely as White people to die from COVID-19, and Hispanic, NHPI and Black people are about 1.5 times as likely to die from COVID-19 (Figure 26). Asian people have lower COVID-19 death rates during this period compared to all other race and ethnicity groups.

OBESITY

Copy link to OBESITY

Obesity rates vary across race and ethnicity groups. As of 2022, Black (43%), AIAN (39%), and Hispanic (37%) adults all have higher obesity rates than White adults (32%), while Asian adults (13%) have a lower obesity rate (Figure 27).

Mental Health and Drug Overdose Deaths

Copy link to Mental Health and Drug Overdose Deaths

Overall rates of mental illness are lower for people of color compared to White people but could be underdiagnosed among people of color. About one in five Hispanic and Black (21% and 20%, respectively) adults and 17% of Asian adults report having a mental illness compared to 25% of White adults (Figure 28). Among adolescents, the share with symptoms of a past year major depressive episode were not significantly different across racial and ethnic groups, with roughly one in five White (21%) and Hispanic (20%) adolescents, 17% of Black, and about one in seven Asian (15%), and AIAN (14%) adolescents reporting symptoms. Data are not available for NHPI people. Research suggests that a lack of culturally sensitive screening tools that detect mental illness, coupled with structural barriers could contribute to underdiagnosis of mental illness among people of color.

AIAN and White people have the highest rates of deaths by suicide as of 2022. People of color have been disproportionately affected by recent increases in deaths by suicide compared with their White counterparts. As of 2022, AIAN (27.1 per 100,000) and White (17.6 per 100,000) people have the highest rates of deaths by suicide compared to all other racial and ethnic groups (Figure 29). Rates of deaths by suicide are also over three times higher among AIAN adolescents (32.9 per 100,000) than White adolescents (10.6 per 100,000). In contrast, Black, Hispanic, and Asian adolescents have lower rates of suicide deaths compared to their White peers.

Drug overdose death rates increased among AIAN, Black, Hispanic, and Asian people between 2021 and 2022. As of 2022, AIAN people continue to have the highest rates of drug overdose deaths (65.2 per 100,000 in 2022) compared with all other racial and ethnic groups. Drug overdose death rates among Black people (47.5 per 100,000) exceed rates for White people (35.6 per 100,000), reflecting larger increases among Black people in recent years (Figure 30). Hispanic (22.7 per 100,000), NHPI (18.8 per 100,000), and Asian (5.3 per 100,000) people have lower rates of drug overdose deaths than White people (35.6 per 100,000). Data on drug overdose deaths among adolescents show that while White adolescents account for the largest share of drug overdose deaths, Black and Hispanic adolescents have experienced the fastest increase in these deaths in recent years.

Social Determinants of Health

RACIAL DISPARITIES IN SOCIAL AND ECONOMIC FACTORS

Copy link to RACIAL DISPARITIES IN SOCIAL AND ECONOMIC FACTORS

Social determinants of health are the conditions in which people are born, grow, live, work, and age. They include factors like socioeconomic status, education, immigration status, language, neighborhood and physical environment, employment, and social support networks, as well as access to health care. There has been extensive research and recognition that addressing social, economic, and environmental factors that influence health is important for advancing health equity. Research also shows how racism and discrimination drive inequities across these factors and impact health and well-being.  

Black, Hispanic, AIAN, and NHPI people fare worse compared to White people across most examined measures of social determinants of health (Figure 31). Experiences for Asian people are more mixed relative to White people across these examined measures. Reliable or disaggregated data for NHPI people are missing for a number of measures.

WORK STATUS, FAMILY INCOME, AND EDUCATION

Copy link to WORK STATUS, FAMILY INCOME, AND EDUCATION

Across racial and ethnic groups, most nonelderly people live in a family with a full-time worker, but Black, Hispanic, AIAN, and NHPI nonelderly people are more likely than White people to be in a family with income below poverty (Figure 32). While most people across racial and ethnic groups live in a family with a full-time worker, disparities persist. AIAN (68%), Black (73%), NHPI (77%), and Hispanic (81%) people are less likely than White people (83%) to have a full-time worker in the family. In contrast, Asian people (86%) are more likely than their White counterparts (83%) to have a full-time worker in the family. Despite the majority of people living in a family with a full-time worker, over one in five AIAN (25%) and Black (22%) people have family incomes below the federal poverty level, over twice the share as White people (10%), and rates of poverty were also higher among Hispanic (17%) and NHPI (16%) people.

Black, Hispanic, AIAN, and NHPI people have lower levels of educational attainment compared to their White counterparts. Among people ages 25 and older, over two thirds (69%) of White people have completed some post-secondary education, compared to less than half (45%) of Hispanic people, just over half of AIAN and NHPI people (both at 52%), and about six in ten Black people (58%) (Figure 33). Asian people are more likely than White people to have completed at least some post-secondary education, with 74% completing at least some college.

NET WORTH AND HOME OWNERSHIP

Copy link to NET WORTH AND HOME OWNERSHIP

Black and Hispanic families have less wealth than White families. Wealth can be defined using net worth, a measure of the difference between a family’s assets and liabilities. The median net worth for White households is $285,000 compared to $44,900 for Black households and $61,600 for Hispanic households (Figure 34). Asian households have the highest median net worth of $536,000. Data are not available for AIAN and NHPI people.

People of color are less likely to own a home than White people (Figure 35). Nearly eight in ten (77%) White people own a home compared to 70% of Asian people, 62% of AIAN people, 55% of Hispanic people, and about half of Black (49%) and NHPI (48%) people.

FOOD SECURITY, HOUSING QUALITY, AND INTERNET ACCESS

Copy link to FOOD SECURITY, HOUSING QUALITY, AND INTERNET ACCESS

Black and Hispanic adults and children are more likely to experience food insecurity compared to their White counterparts. Among adults, AIAN (18%), Black (14%), and Hispanic (12%) adults report low or very low food security compared to White adults (6%) (Figure 36). Among children, AIAN (24%), Black (21%) and Hispanic (15%) children are over twice as likely to be food insecure than White children (6%). Data are not available for NHPI adults and children.

People of color are more likely to live in crowded housing than their White counterparts (Figure 37). Among White people, 3% report living in a crowded housing arrangement, that is having more than one person per room, as defined by the American Community Survey. In contrast, almost three in ten (28%) NHPI people, roughly one in five (18%) Hispanic people, 16% AIAN people, and about one in ten Asian (12%) and Black (8%) people report living in crowded housing.

AIAN, NHPI, and Black people are less likely to have internet access than White people (Figure 38). Higher shares of AIAN (12%), and Black and NHPI people (both at 6%) say they have no internet access compared to their White counterparts (4%). In contrast, Asian people (2%) are less likely to report no internet access than White people (4%).

TRANSPORTATION

Copy link to TRANSPORTATION

People of color are more likely to live in a household without access to a vehicle than White people (Figure 39). About one in eight Black people (12%) and about one in ten AIAN (9%) and Asian (8%) people live in a household without a vehicle available followed by 7% of Hispanic and NHPI people. White people are the least likely to report not having access to a vehicle in the household (4%).

CITIZENSHIP AND ENGLISH PROFICIENCY

Copy link to CITIZENSHIP AND ENGLISH PROFICIENCY

Asian, Hispanic, NHPI, and Black people include higher shares of noncitizen immigrants compared to White people. Asian and Hispanic people have the highest shares of noncitizen immigrants at 25% and 19%, respectively (Figure 40). Asian people are projected to become the largest immigrant group in the United States by 2055. Immigrants are more likely to be uninsured than citizens and face increased barriers to accessing health care.

Hispanic and Asian people are more likely to have LEP compared to White people. Almost one in three Asian (31%) and Hispanic (28%) people report speaking English less than very well compared to White people (1%)(Figure 41). Adults with LEP are more likely to report worse health status and increased barriers in accessing health care compared to English proficient adults.

EXPERIENCES WITH RACISM, DISCRIMINATION, AND UNFAIR TREATMENT

Copy link to EXPERIENCES WITH RACISM, DISCRIMINATION, AND UNFAIR TREATMENT

Racism is an underlying driver of health disparities, and repeated and ongoing exposure to perceived experiences of racism and discrimination can increase risks for poor health outcomes. Research has shown that exposure to racism and discrimination can lead to negative mental health outcomes and certain negative impacts on physical health, including depression, anxiety, and hypertension.

Black, AIAN, Hispanic, and Asian adults are more likely to report certain experiences with discrimination in daily life compared with their White counterparts, with the greatest frequency reported among Black and AIAN adults. A 2023 KFF survey shows that at least half of AIAN (58%), Black (54%), and Hispanic (50%) adults and about four in ten (42%) Asian adults say they experienced at least one type of discrimination in daily life in the past year (Figure 42). These experiences include receiving poorer service than others at restaurants or stores; people acting as if they are afraid of them or as if they aren’t smart; being threatened or harassed; or being criticized for speaking a language other than English. Data are not available for NHPI adults.

About one in five (18%) Black adults and roughly one in eight AIAN (12%) adults, followed by roughly one in ten Hispanic (11%), and Asian (10%) adults who received health care in the past three years report being treated unfairly or with disrespect by a health care provider because of their racial or ethnic background. These shares are higher than the 3% of White adults who report this (Figure 43). Overall, roughly three in ten (29%) AIAN adults and one in four (24%) Black adults say they were treated unfairly or with disrespect by a health care provider in the past three years for any reason compared with 14% of White adults.

About the Data

Data Sources

Copy link to Data Sources

This chart pack is based on the KFF Survey on Racism, Discrimination, and Health and KFF analysis of a wide range of health datasets, including the 2022 American Community Survey, the 2022 Behavioral Risk Factor Surveillance System, the 2022 National Health Interview Survey, the 2022 National Survey on Drug Use and Health, and the 2022 Survey of Consumer Finances as well as from several online reports and databases including the Centers for Disease Control and Prevention (CDC) Morbidity and Mortality Weekly Report (MMWR) on vaccination coverage, the National Center for Health Statistics (NCHS) National Vital Statistics Reports, the CDC Influenza Vaccination Dashboard Flu Vaccination Coverage Webpage Report, the National Center for HIV/AIDS, Viral Hepatitis, STD, and TB Prevention (NCHHSTP) Atlas, the United States Cancer Statistics Incidence and Mortality Web-based Report, the 2022 CDC Natality Public Use File, CDC Web-based Injury Statistics Query and Reporting System (WISQARS) database, and the CDC WONDER online database.

Methodology

Copy link to Methodology

Unless otherwise noted, race/ethnicity was categorized by non-Hispanic White (White), non-Hispanic Black (Black), Hispanic, non-Hispanic American Indian and Alaska Native (AIAN), non-Hispanic Asian (Asian), and non-Hispanic Native Hawaiian or Pacific Islander (NHPI). Some datasets combine Asian and NHPI race categories limiting the ability to disaggregate data for these groups. Non-Hispanic White persons were the reference group for all significance testing. All noted differences were statistically significant differences at the p<0.05. We include data for smaller population groups wherever available. Instances in which the unweighted sample size for a subgroup is less than 50 or the relative standard error is greater than 30% are noted in the figures, and confidence intervals for those measures are included in the figure.

KFF Headquarters: 185 Berry St., Suite 2000, San Francisco, CA 94107 | Phone 650-854-9400
Washington Offices and Barbara Jordan Conference Center: 1330 G Street, NW, Washington, DC 20005 | Phone 202-347-5270

www.kff.org | Email Alerts: kff.org/email | facebook.com/KFF | twitter.com/kff

The independent source for health policy research, polling, and news, KFF is a nonprofit organization based in San Francisco, California.