2018 Renewal Notices – What Marketplace Consumers Need to Know
As Open Enrollment for 2018 coverage gets underway, consumers who have health coverage through the Affordable Care Act (ACA) Marketplace are again receiving renewal notices from their health insurers. Though the insurer renewal notices are based on the same model notice required in the past, this year for many consumers, it may be causing significant – and misleading – sticker shock.
That is because renewal notices sent by insurers are required to inform consumers what their 2018 monthly premium will be, assuming they receive the same amount of advanced premium tax credit (APTC) next year that they did in 2017. Insurer renewal notices have been required to present information this way since 2014.
However, for the vast majority of consumers in the marketplace, premium tax credit amounts will increase significantly in 2018. Tax credit amounts are tied to the cost of the benchmark silver marketplace plan, which is increasing significantly in 2018 in most areas due to the termination by the federal government of cost-sharing payments to insurers. As a result, if a consumer buys a silver plan in both 2017 and 2018, assuming no change in income, her net monthly premium cost should stay about the same. But if the renewal notice estimates her 2018 monthly premium using the 2017 premium tax credit amount, in most areas the notice will mistakenly show a significant increase in what that consumer will pay for coverage.
[Estimate your 2018 costs using our Subsidy Calculator]
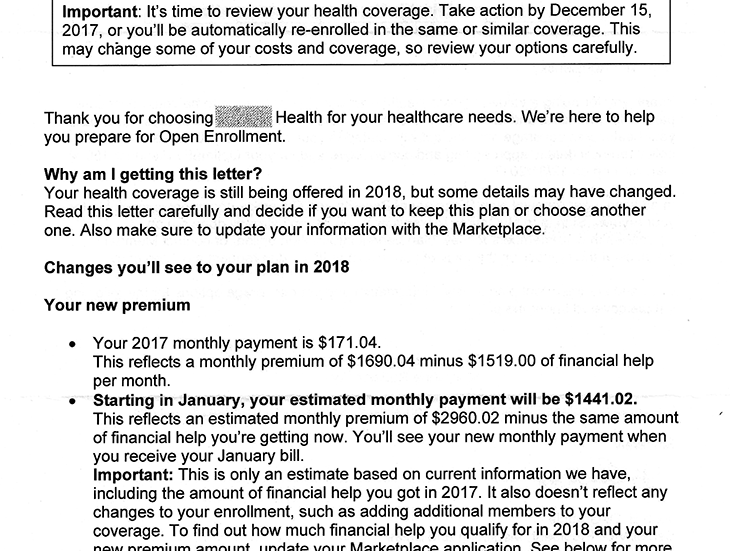
Below is an excerpt from a renewal notice to a family (husband and wife in their early 60’s) who buy Marketplace coverage in Virginia. With APTC this year, they pay about $171 per month for a policy that costs more than $1,500 per month. Their income is steady, so they will only be required to pay about the same amount next year, even though the unsubsidized premium for this policy will nearly double. The renewal notice, though, estimates their monthly costs will increase to more than $1,400 – a 743% increase — because it reflects their 2017 premium tax credit amount rather than their 2018 subsidy.
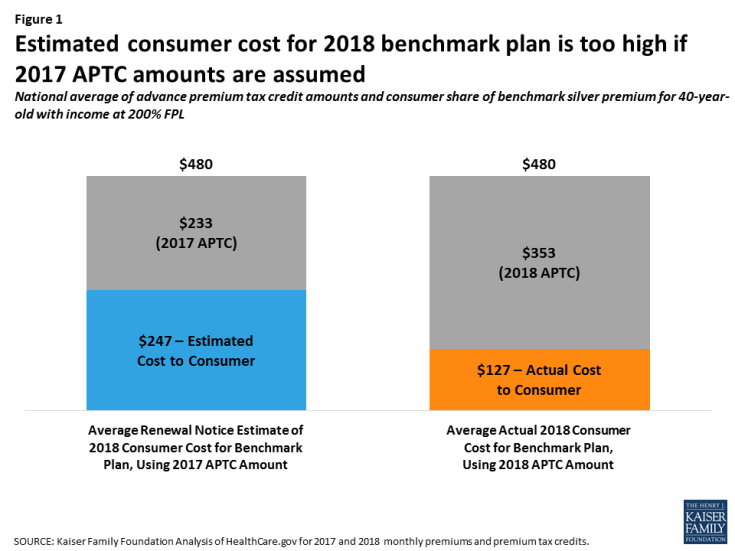
A 40-year-old single person with income at 200% of the federal poverty level will pay the same amount for the benchmark silver plan in 2017 and in 2018. The average unsubsidized monthly premium amount for the benchmark silver marketplace plan in 2018 will increase $119 in 2018 compared to 2017 ($480 vs. $361), and the APTC amounts will also increase by $120 ($353 in 2018 vs $233 in 2017), leaving the consumer to pay $127 per month for the benchmark plan in both years. However, renewal notices that estimate a consumer’s net premium for the 2018 benchmark plan using the 2017 APTC amount, on average, will show this consumer paying $247 per month – $120 (95%) more than will actually be the case. (Figure 1)

Figure 1: Estimated consumer cost for 2018 benchmark plan is too high if 2017 APTC amounts are assumed
The amount of increase in the 2018 benchmark plan premium varies by state. As a result, renewal notices may misestimate consumers renewal rate costs by varying amounts. In some areas, such as Phoenix, AZ, where the benchmark plan cost is changing very little in 2018, the estimated costs consumers see in renewal notices will be roughly accurate. By contrast, in Omaha, NE, where benchmark premiums are increasing significantly, renewal notices that estimate consumer costs using the 2017 APTC amounts will be off by a much greater amount.
| Table 1: Difference in Actual vs. Estimated Consumer Cost of 2018 Benchmark Silver Plan for a 40-year-old at 200% FPL | |||||
| State | Major City | Subsidized Monthly Benchmark Silver Plan Premium | Difference in Estimated vs Actual Monthly Consumer Cost for 2018 | ||
| Actual 2017 Consumer Cost Net of 2017 APTC | Actual 2018 Consumer Cost Net of 2018 APTC | Estimated 2018 Premium Using 2017 APTC | |||
| US Average | $127 | $127 | $247 | $120 | |
| Alabama | Birmingham | $127 | $127 | $181 | $53 |
| Alaska | Anchorage | $159 | $159 | $0 | -$159 |
| Arizona | Phoenix | $127 | $127 | $131 | $4 |
| Arkansas | Little Rock | $127 | $127 | $191 | $64 |
| California | Los Angeles | $127 | $127 | $194 | $67 |
| Colorado | Denver | $127 | $127 | $228 | $101 |
| Connecticut | Hartford | $127 | $127 | $208 | $81 |
| Delaware | Wilmington | $127 | $127 | $293 | $166 |
| DC | Washington | $127 | $127 | $153 | $25 |
| Florida | Miami | $127 | $127 | $263 | $136 |
| Georgia | Atlanta | $127 | $127 | $272 | $145 |
| Hawaii | Honolulu | $146 | $146 | $238 | $91 |
| Idaho | Boise | $127 | $127 | $242 | $114 |
| Illinois | Chicago | $127 | $127 | $247 | $119 |
| Indiana | Indianapolis | $127 | $127 | $206 | $78 |
| Iowa | Cedar Rapids | $127 | $127 | $528 | $401 |
| Kansas | Wichita | $127 | $127 | $250 | $123 |
| Kentucky | Louisville | $127 | $127 | $277 | $149 |
| Louisiana | New Orleans | $127 | $127 | $163 | $35 |
| Maine | Portland | $127 | $127 | $298 | $171 |
| Maryland | Baltimore | $127 | $127 | $274 | $147 |
| Massachusetts | Boston | $127 | $127 | $187 | $60 |
| Michigan | Detroit | $127 | $127 | $223 | $95 |
| Minnesota | Minneapolis | $127 | $127 | $89 | -$38 |
| Mississippi | Jackson | $127 | $127 | $326 | $198 |
| Missouri | St Louis | $127 | $127 | $282 | $154 |
| Montana | Billings | $127 | $127 | $205 | $78 |
| Nebraska | Omaha | $127 | $127 | $511 | $384 |
| Nevada | Las Vegas | $127 | $127 | $230 | $102 |
| New Hampshire | Manchester | $127 | $127 | $335 | $207 |
| New Jersey | Newark | $127 | $127 | $185 | $58 |
| New Mexico | Albuquerque | $127 | $127 | $270 | $143 |
| New York | New York City | $127 | $127 | $181 | $54 |
| North Carolina | Charlotte | $127 | $127 | $223 | $95 |
| North Dakota | Fargo | $127 | $127 | $94 | -$33 |
| Ohio | Cleveland | $127 | $127 | $216 | $88 |
| Oklahoma | Oklahoma City | $127 | $127 | $319 | $192 |
| Oregon | Portland | $127 | $127 | $190 | $63 |
| Pennsylvania | Philadelphia | $127 | $127 | $345 | $217 |
| Rhode Island | Providence | $127 | $127 | $177 | $50 |
| South Carolina | Columbia | $127 | $127 | $284 | $157 |
| South Dakota | Sioux Falls | $127 | $127 | $133 | $6 |
| Tennessee | Nashville | $127 | $127 | $291 | $163 |
| Texas | Houston | $127 | $127 | $238 | $111 |
| Utah | Salt Lake City | $127 | $127 | $350 | $222 |
| Vermont | Burlington | $127 | $127 | $141 | $14 |
| Virginia | Richmond | $127 | $127 | $313 | $186 |
| Washington | Seattle | $127 | $127 | $228 | $100 |
| West Virginia | Huntington | $127 | $127 | $172 | $45 |
| Wisconsin | Milwaukee | $127 | $127 | $317 | $189 |
| Wyoming | Cheyenne | $127 | $127 | $459 | $332 |
| SOURCE: Kaiser Family Foundation analysis of insurer rate filings to state regulators and data published by HHS. | |||||
What Consumers Need to Know
Consumers need to know that the renewal notice they receive from their insurer likely will estimate a much higher monthly premium for 2018 than they would actually pay after taking into account their tax credit. This is not the insurer’s fault. Insurers were directed to estimate 2018 renewal costs taking into account the tax credit amount consumers were receiving in 2017; but in most cases, this will result in an inaccurate estimate.
Consumers should watch for a second renewal notice, this one from the marketplace, that will likely estimate a different and higher APTC amount for 2018 that does take into account the increase in benchmark silver plan premiums.
For the most accurate estimate of their likely 2018 subsidy and monthly plan costs, consumers should log into their marketplace account, update their application information, and view the cost of all plan options after the 2018 APTC is applied. Consumers can also estimate their 2018 costs using the subsidy calculator, below.

