The Diseases We Spend Our Health Dollars On
This was published as a Wall Street Journal Think Tank column on March 3, 2015.
People worry a lot about their health-care costs, such as the share they pay of their health premium or the size of their deductible. But they tend to have a harder time getting their heads around the measures experts use to talk about the national health-cost problem, such as health spending as a percentage of gross domestic product, or the rate of increase in national health spending, or the difference in per capita health spending in the U.S. vs. other countries. In a focus group I attended, a participant was asked whether he believed the Affordable Care Act would “bend the cost curve,” a concept often used to discuss health spending and to sell the ACA. His response: “I don’t know about bending any curves, but I don’t want to be bent.”
But there is good news for those who want to understand more. The Bureau of Economic Analysis (BEA) has made a real contribution to making health spending more comprehensible by analyzing health spending and price growth by common diseases and diagnoses such as cancer, heart disease, diabetes, and even the common cold. Doing that makes the problem of health-care costs much more understandable for everyone, and it can help direct the attention of policymakers, health professionals, and health-care institutions to where health-care dollars are going.
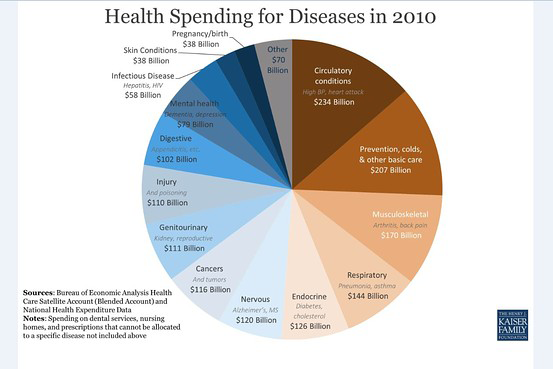
In a very technical report, the BEA analyzed health spending by disease from 2000 to 2010, sorting diseases and diagnoses into categories. As shown by the chart above, which is adapted from BEA data, Americans spent the most–$234 billion–on circulatory diseases such as hypertension and heart disease in 2010. Next came general preventive care and general medical care for everyday problems such as the common cold or flu, at $207 billion. Musculoskeletal problems such back pain or arthritis came in third at $170 billion. Some prominent disease categories represented smaller shares of spending. For example, cancer represented 6.7% of spending, or $116 billion, and mental health conditions including dementia and depression accounted for 4.6% of spending, or $79 billion. A chart review of spending by disease is available here.
The BEA found that spending for common illnesses such as a cold or strep throat grew faster than anything else over the 10-year period. Then came spending to treat endocrine disorders such as high cholesterol or diabetes. The bureau also found that the cost of treatment–a combination of price and the complexity of services and technology used in treatment–was the main culprit behind spending increases for diseases, not the number of cases treated.
Much more could be done to fine-tune measures of spending by disease and, even more important, to assess the relative value of individuals’ health spending. But everyone has a health problem or has a relative with a health problem or knows others who have health problems. Breaking down our health dollar by disease helps to make the problem of health costs and spending much more understandable.

