Snapshots: Compensation for Workers with & without Access to Health Benefits at Work
This paper compares the payroll and benefit compensation of workers that had access to employer-sponsored health benefits at work to that of workers who did not have an insurance offer. Surveys of employers indicate that smaller and lower wage firms are less likely to offer health benefits to workers, but do not provide detailed information about wage and benefit differences for workers with and without an offer of health benefits working in different settings.1 In this Snapshot, we use information from a nationally representative survey of workers to provide a fuller picture of the compensation for workers with health coverage access at their job compared to those without such access by firm size and occupation. We also assess trends over time. This study updates our earlier snapshot published in 2008.
Our analysis is based on data from the National Compensation Survey (NCS), which is a nationwide survey of labor costs in private and public establishments conducted quarterly by the Bureau of Labor Statistics (BLS).2 The data offer comparisons between 1999 and 2011. Details about the NCS and our analysis are available in a methodological appendix at the end of this analysis. Worker compensation is divided into three categories: payroll costs, fringe benefit costs excluding employer payments for health insurance, and employer payments for health insurance. Differences in compensation between workers with and without access to health benefits are compared with regard to payroll and non-health fringe benefits.
| Definitions of key terms: |
- Payroll costs include employer payments for wages, salary, overtime, vacation, holiday, sick days, bonus, and other cash compensation to employees, but exclude severance payments and unemployment benefits.
- Employer costs for health benefits include all employer payments for health coverage and exclude employee contributions to premiums or out-of-pocket medical cost-sharing.
- Non-health fringe benefits include employer payments for life and short-term disability insurance, defined benefit and defined contribution pension plans, worker’s compensation, and Social Security and Medicare payroll taxes.
- Total compensation is defined as the sum of payroll and all fringe benefit costs including health.
- Establishment size is the number of employees at a selected plant or office. Firms may be made up of one or more establishments.
Compensation Levels
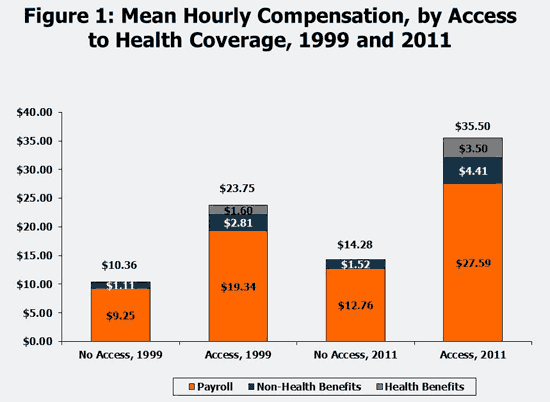
Employees with relatively high wages are more likely to have access to employer-provided health benefits. Employees in establishments with access to health benefits, on average, receive more than twice as much in payroll and non-health benefit compensation as employees who do not have access to health benefits at work (Figure 1). When employer costs for health benefits are added to compensation for workers who have access (i.e., total compensation), the difference between these groups grows. In 2011, employees with access to health benefits had total compensation averaging $35.50 per hour, compared with $14.28 for employees without access. The gap has been widening. From 1999 to 2011, the real percentage change in total compensation for workers with access was about 10.3 percent compared to 1.7 percent for those without access.3
Source: Kaiser Family Foundation calculations based on data from the National Compensation Survey, 1999 and 2011, conducted by the Bureau of Labor Statistics. |
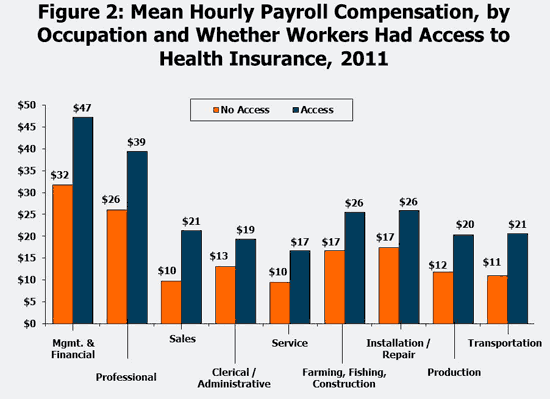
Workers with access to health benefits are disproportionately in higher paid occupations, although we still find significant differences in average payroll compensation within occupation categories for workers with and without access (Figure 2). (We focus on payroll compensation for the remainder of this section because it is by far the largest portion of total compensation). Large differences in average hourly payroll compensation were found for workers with and without access to health benefits in all nine of the selected occupation categories, with a range of average hourly payroll costs, in 2011 (Figure 2). Some of the most notable differences occurred in the more highly paid professional and executive management occupation categories.
Source: Kaiser Family Foundation calculations based on data from the National Compensation Survey, 2011, conducted by the Bureau of Labor Statistics. |
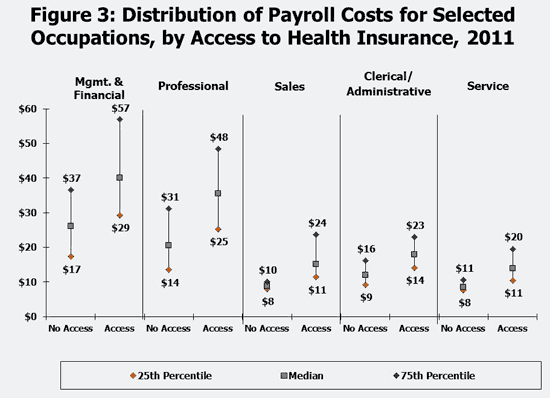
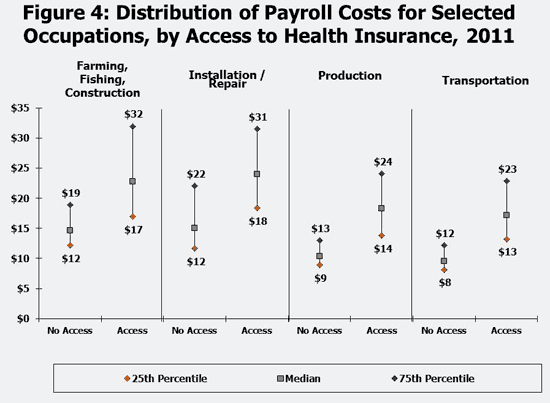
Because a wide variety of jobs can be captured even within a single occupation category, particularly for occupations like the sales, professional, and management categories, we assessed how payroll compensation is distributed within occupation categories. Figures 3 and 4 show the 25th percentile, median (or midpoint), and 75th percentile of payroll for workers with and without access to health benefits within each of the nine occupation categories in 2011. 4 For example, looking at workers with access to health benefits in the service occupation, 25 percent had payroll compensation at or below $11, one half had payroll compensation equal to or less than $14, and 75 percent had payroll compensation at or below $20. In contrast, for service workers without access to health benefits at work, a quarter had hourly payroll compensation at or below $8, one half had hourly payroll compensation at or below $9 and only one quarter had hourly payroll compensation above $11. This is a lower and narrower range than is seen for service workers with access to health benefits. Large shares of workers without access to health benefits have relatively low payroll compensation when compared to workers within the same occupations with access to health benefits. In fact, for several of these occupations, the payroll compensation at the 25th percentile for those with access was near the 75th percentile for those without access.
| Source: Kaiser Family Foundation calculations based on data from the National Compensation Survey, 2011, conducted by the Bureau of Labor Statistics. |
| Source: Kaiser Family Foundation calculations based on data from the National Compensation Survey, 2011, conducted by the Bureau of Labor Statistics. |
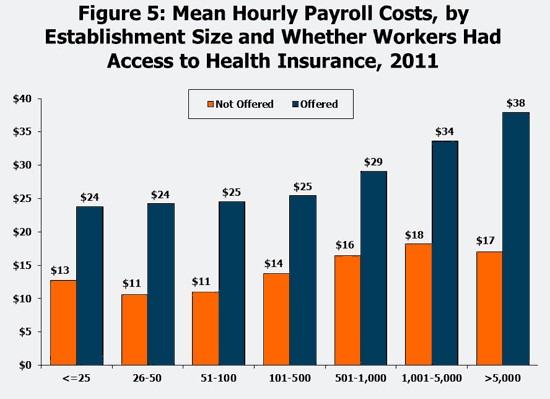
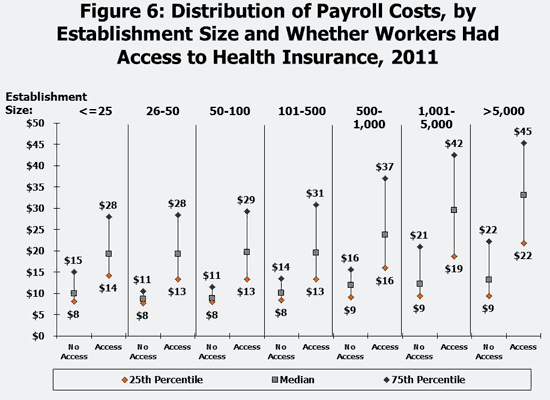
A similar pattern emerges when payroll compensation for workers with and without health benefit access is looked by the size of the establishments where they work. Average payroll compensation is much higher for workers with health insurance access than for workers without offers across all establishment sizes (Figure 5). The distributions for payroll compensation for workers with and without access by establishment size confirms that most workers with access have much higher payroll compensation than the majority of workers without access (Figure 6). For workers without access to employer health insurance, there is a noticeably lower and smaller variation in payroll compensation. In three out of the seven establishment size categories analyzed here, the 25th percentile of payroll for workers with access exceeded the 75th percentile of payroll for workers without access. 5
| Source: Kaiser Family Foundation calculations based on data from the National Compensation Survey, 2011, conducted by the Bureau of Labor Statistics. |
| Source: Kaiser Family Foundation calculations based on data from the National Compensation Survey, 2011, conducted by the Bureau of Labor Statistics. |
Changes in Compensation
Health benefit costs grew rapidly from 1999 to 20116, so we might expect, all other things being equal, payroll and non-health benefit compensation to have grown more slowly for those with access to health benefits than for those without access. Since workers with health benefit access saw a greater share of their compensation shifted to health benefits over the period7, in theory, this relative growth in the health benefit costs should be offset by a reduction in the growth of payroll and non-health benefits. At the same time, the compensation of workers without health insurance access is not directly affected by the rapid rise in health benefit costs, so changes in their total compensation should rise with other factors, such as their overall productivity.
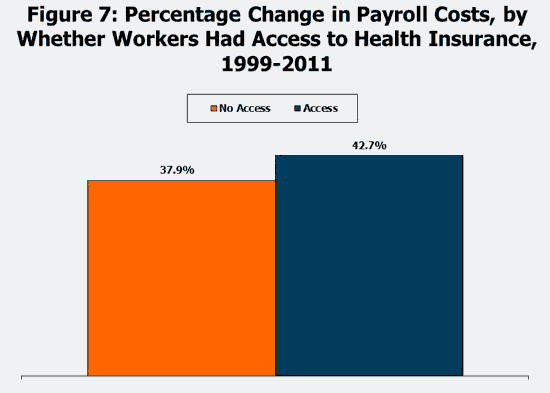
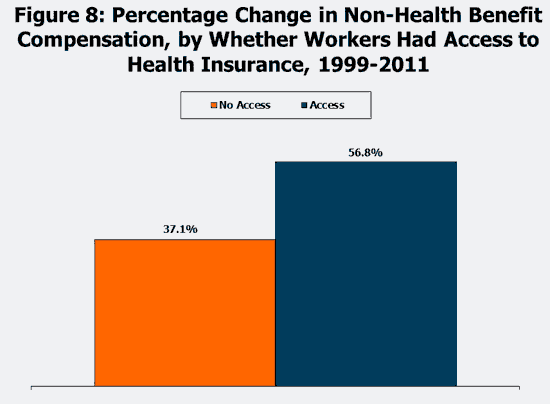
Despite the relatively rapid growth in health benefit costs over the period, we find that workers with access to health benefits appeared to have slightly higher compensation increases over the period (Figures 7 and 8) than workers without access to health benefits. A possible explanation is that average productivity grew faster over the period for workers with health benefit access than for workers without access. If this were the case, then we would not expect that changes in total compensation growth over the period to be the same for workers with and without access (because workers with health benefit access on average would be more valuable over time). 8
| Note: Numbers not adjusted for inflation.Source: Kaiser Family Foundation calculations based on data from the National Compensation Survey, 1999-2011, conducted by the Bureau of Labor Statistics. |
| Note: Numbers not adjusted for inflation.Source: Kaiser Family Foundation calculations based on data from the National Compensation Survey, 1999-2011, conducted by the Bureau of Labor Statistics. |
Discussion
We show a substantial gap in compensation between workers with and without health benefit access from the establishments where they work. Workers with access to employer health benefits receive much higher total compensation, payroll compensation, and non-health benefit compensation. The substantial gaps in payroll compensation generally hold up when the data is divided by establishment size and worker occupation.
This paper offers insight into the diversity of the workforce and the compensation differences for workers with and without access to health benefits at work. Understanding these differences should assist policymakers implementing various provisions of the Affordable Care Act that affect employer-based coverage, including decisions about how much coverage employers must offer their workers under the new employer-responsibility requirements and the extent to which employers can offer different benefits to workers in different situations (nondiscrimination rules). The information also provides a useful baseline to help assess the impact of health reform on workers’ compensation across industries and pay levels over time.
| This paper was prepared by Gary Claxton and Anthony Damico of the Kaiser Family Foundation’s Health Care Marketplace Project, and is an update to an analysis originally published in 2008. Paul Jacobs, who formerly worked in that division, helped to prepare the prior version. |
Methodological Appendix
The Employment Cost Index (ECI) is a nationwide survey of labor costs in private and public establishments conducted quarterly by the Bureau of Labor Statistics (BLS). The ECI was developed in the mid-1970s to track changes in the costs of employment. Later modifications added data about health and other fringe benefits. Since about 2003, the ECI sample was merged with a broader group of surveys on employer benefits and payroll costs collectively referred to as the National Compensation Survey (NCS).7
ECI/NCS data are constructed by first choosing establishments in private industry and in state and local governments in the 50 states and the District of Columbia. Federal government, agriculture, and private household establishments are excluded from the sample. Then the survey collects information about the costs of employment for up to eight job classifications in each establishment that is surveyed. The data are aggregated to a job level, rather than collected for individual workers, so that continuity within establishments may be maintained over time as individual workers enter and exit the establishment. Jobs are sampled proportional to their prevalence at the establishment. For instance, in a plant which produces coal, separate wage and benefits costs for miners, engineers, and truck drivers may be obtained by the survey, whereas other jobs with fewer employees, such as for accountants and crane operators, may be excluded. The data we use are nevertheless representative of all workers in the United States as of June of each calendar year. The exhibits and calculations are presented on a per-worker-hour basis and include all employees in sampled jobs, including those that are seasonal, part-time, or temporary. We use data each year from 1999 to 2011.
Readers also should be aware that employer costs for benefits in a job classification are averaged over all of the workers in that job classification, even if workers do not participate in the benefit. As examples, employees offered health benefits may choose not to take them up and new employees may face an exclusion period before they are eligible for benefits from the employer. Thus, differences in employer costs across job classifications or over time may to some extent reflect different participation rates for workers and their dependents.
Hourly costs for payroll and health insurance are provided by the Bureau of Labor Statistics and we used these estimates because they adjust for differences in the number of hours worked annually among employees. Hourly cost of payroll was calculated by combining hourly costs for wages, overtime, vacation pay, sick pay, as well as bonuses and other paid leave. Because the data are collected from establishments, not firms, firm-level characteristics, e.g. firm size, are not available. The paper avoids the use of the term firm, although it uses the terms “employer” and “establishment” synonymously although they may not be equal.
The BLS provides survey weights which enable the researcher to calculate statistics which are representative of workers in the United States in a given year. An adjustment to these weights was made to correct for changes in the composition of industries and occupations in the United States over time. This adjustment allows for a more accurate comparison of figures over time, but only very marginally affected the results presented in this paper.
BLS researchers impute missing data for hourly values when respondents do not provide sufficient data to calculate them. In 2011, 8.5 percent of observations were missing a response to the question of whether health insurance was offered to workers holding that particular job. Rather than impute a value for these observations, for all statistics, these observations were excluded from our sample.
The Kaiser Family Foundation obtained access to the ECI/NCS through an agreement with the BLS. All analyses were performed on site at the BLS headquarters in Washington D.C. during September 2011 by Kaiser Family Foundation staff.
Appendix
This appendix contains the distribution of payroll cost data for selected occupations or establishment size, including 25th percentile, median, and 75th percentile. The tables below correspond with Figures 3, 4, and 6.
Table 3a: Distribution of Payroll Costs for Selected Occupations, by Access to Health Insurance, 2011 | ||||
Access to Health Insurance | 25th Percentile | Median | 75th Percentile | |
| Mgmt. & Financial | No Access | $ 17.34 | $ 26.10 | $ 36.53 |
Access | $ 29.32 | $ 40.05 | $ 57.08 | |
| Professional | No Access | $ 13.50 | $ 20.53 | $ 31.18 |
Access | $ 25.32 | $ 35.56 | $ 48.48 | |
| Sales | No Access | $ 8.00 | $ 8.79 | $ 10.06 |
Access | $ 11.45 | $ 15.07 | $ 23.69 | |
| Clerical/Administrative | No Access | $ 9.27 | $ 12.00 | $ 16.13 |
Access | $ 14.14 | $ 17.91 | $ 23.01 | |
| Service | No Access | $ 7.63 | $ 8.52 | $ 10.52 |
Access | $ 10.50 | $ 13.90 | $ 19.57 | |
| Source: Kaiser Family Foundation calculations based on data from the National Compensation Survey, 2011, conducted by the Bureau of Labor Statistics. | ||||
Table 4a: Distribution of Payroll Costs for Selected Occupations, by Access to Health Insurance, 2011 | ||||
Access to Health Insurance | 25th Percentile | Median | 75th Percentile | |
| Farming, Fishing, Construction | No Access | $ 12.17 | $ 14.66 | $ 18.89 |
Access | $ 16.96 | $ 22.73 | $ 31.97 | |
| Installation / Repair | No Access | $ 11.65 | $ 15.00 | $ 22.05 |
Access | $ 18.39 | $ 23.97 | $ 31.49 | |
| Production | No Access | $ 8.92 | $ 10.32 | $ 13.00 |
Access | $ 13.77 | $ 18.33 | $ 24.10 | |
| Transportation | No Access | $ 8.16 | $ 9.50 | $ 12.14 |
Access | $ 13.24 | $ 17.19 | $ 22.90 | |
| Source: Kaiser Family Foundation calculations based on data from the National Compensation Survey, 2011, conducted by the Bureau of Labor Statistics. | ||||
Table 6a: Distribution of Payroll Costs, by Establishment Size and Whether Workers Had Access to Health Insurance, 2011 | ||||
Access to Health Insurance | 25th Percentile | Median | 75th Percentile | |
| <= 25 Employees | No Access | $ 8.12 | $ 10.03 | $ 15.00 |
Access | $ 14.25 | $ 19.25 | $ 27.96 | |
| 26-50 Employees | No Access | $ 7.77 | $ 8.69 | $ 10.56 |
Access | $ 13.41 | $ 19.31 | $ 28.38 | |
| 50-100 Employees | No Access | $ 7.97 | $ 8.91 | $ 11.48 |
Access | $ 13.41 | $ 19.65 | $ 29.29 | |
| 101-500 Employees | No Access | $ 8.47 | $ 10.16 | $ 13.50 |
Access | $ 13.37 | $ 19.56 | $ 30.86 | |
| 501-1,000 Employees | No Access | $ 9.11 | $ 12.02 | $ 15.63 |
Access | $ 16.03 | $ 23.78 | $ 37.06 | |
| 1,001-5,000 Employees | No Access | $ 9.44 | $ 12.28 | $ 20.90 |
Access | $ 18.73 | $ 29.51 | $ 42.45 | |
| >5,000 Employees | No Access | $ 9.46 | $ 13.15 | $ 22.18 |
Access | $ 21.85 | $ 33.06 | $ 45.29 | |
| Source: Kaiser Family Foundation calculations based on data from the National Compensation Survey, 2011, conducted by the Bureau of Labor Statistics. | ||||
Notes:
- A worker is considered to have access to employer health benefits as long as their employer offers health benefits to at least one worker within the group to which the worker belongs. In this paper, we use the term access rather than offer since the numbers are calculated at the worker level. Also, worker access to health benefits does not necessarily imply they are eligible to receive those benefits. Some employers may offer benefits to a group of workers, but these workers may not be eligible to receive those benefits until certain criteria, such as a waiting period after being hired, are met.
- As part of the National Compensation Survey, the Bureau of Labor Statistics collects these data quarterly to develop the Employment Cost Index (ECI) which is designed to measure changes in compensation costs for the civilian workforce. Other details on how the statistics were derived from the ECI data are reported in the Methodological Appendix in this report.
- This reflects an adjustment for inflation of 35 percent over the period.
- The medians not shown in Figures 3 and 4 can be found in the Appendix in Table 3a and Table 4a, respectively.
- The medians not shown in Figure 6 can be found in the Appendix in Table 6a.
- See, Kaiser Family Foundation, “Employer Health Insurance Costs and Worker Compensation,” February 2011. Available online at: http://www.kff.org/insurance/snapshot/Employer-Health-Insurance-Costs-and-Worker-Compensation.cfm.
- Ibid.
- The much lower compensation received by workers without offers compared to that received by workers with offers suggests that workers without offers are much less skilled, and that it would not be surprising if their “value” to their employers grew more slowly than higher paid workers. To our knowledge, there have been few studies dealing with how productivity increases may drive differences in total compensation by whether a worker has access to health insurance. This may be because worker productivity is difficult to measure and compare, which often leads researchers to study productivity as a residual, unmeasured, element of changes in total compensation. Several studies which touch upon this issue include: Ezekiel J. Emanuel and Victor R. Fuchs, “Who Really Pays for Health Care? The Myth of ‘Shared Responsibility,’” The Journal of the American Medical Association, vol. 299, no. 9, March 2008, pp.1057-1059; Dana P. Goldman, Neeraj Sood, and Arleen A. Leibowitz, “The Reallocation of Compensation in Response to Health Insurance Premium Increases,” NBER Working Paper 9540, March 2003; Hae-shin Hwang, W. Robert Reed, and Carlton Hubbard, “Compensating Wage Differentials and Unobserved Productivity,” The Journal of Political Economy, vol. 100, no. 4, August 1992, pp. 835-858; and Steven F. Lehrer and Nuno Sousa Pereira, “Worker Sorting, Compensating Differentials and Health Insurance: Evidence From Displaced Workers,” NBER Working Paper 12951, March 2007.
An earlier version of this Snapshot, using historical data, is available online.