One or Two Health Systems Controlled the Entire Market for Inpatient Hospital Care in Nearly Half of Metropolitan Areas in 2022
National health spending totaled $4.5 trillion in 2022—17% of gross domestic product (GDP)—and is projected to grow faster than GDP through 2032, contributing to higher costs for families, employers, states, and the federal government. As policymakers consider a variety of strategies to make health care more affordable, they have been increasingly attentive to the effects of consolidation in health care markets and the potential implications for cost and quality of care. Hospital consolidation has been a subject of particular focus in part because nearly one third of all health spending goes towards hospital care. Consolidation may allow providers to operate more efficiently and help struggling providers keep their doors open in underserved areas, but often reduces competition. A substantial body of evidence has found that consolidation can contribute to higher prices, with unclear effects on quality.
This analysis examines the competitiveness of markets for hospital care, based on RAND Hospital Data—a cleaned and processed version of cost reports from Medicare-certified hospitals—and American Hospital Association (AHA) survey data. This piece describes competition among independent hospitals and health systems, referring to both as “health systems” throughout for brevity. Competition is measured in three ways: the share of metropolitan statistical areas (MSAs) controlled by a small number of health systems, the level of market concentration in MSAs based on the Herfindahl-Hirschman Index (HHI), and the share of hospitals affiliated with health systems over time. Using hospital data from 2022 (the most recent year available), this analysis focuses on general short-term or general medical or surgical hospitals depending on the dataset and excludes federal hospitals (see Methods for more details).
Key Takeaways
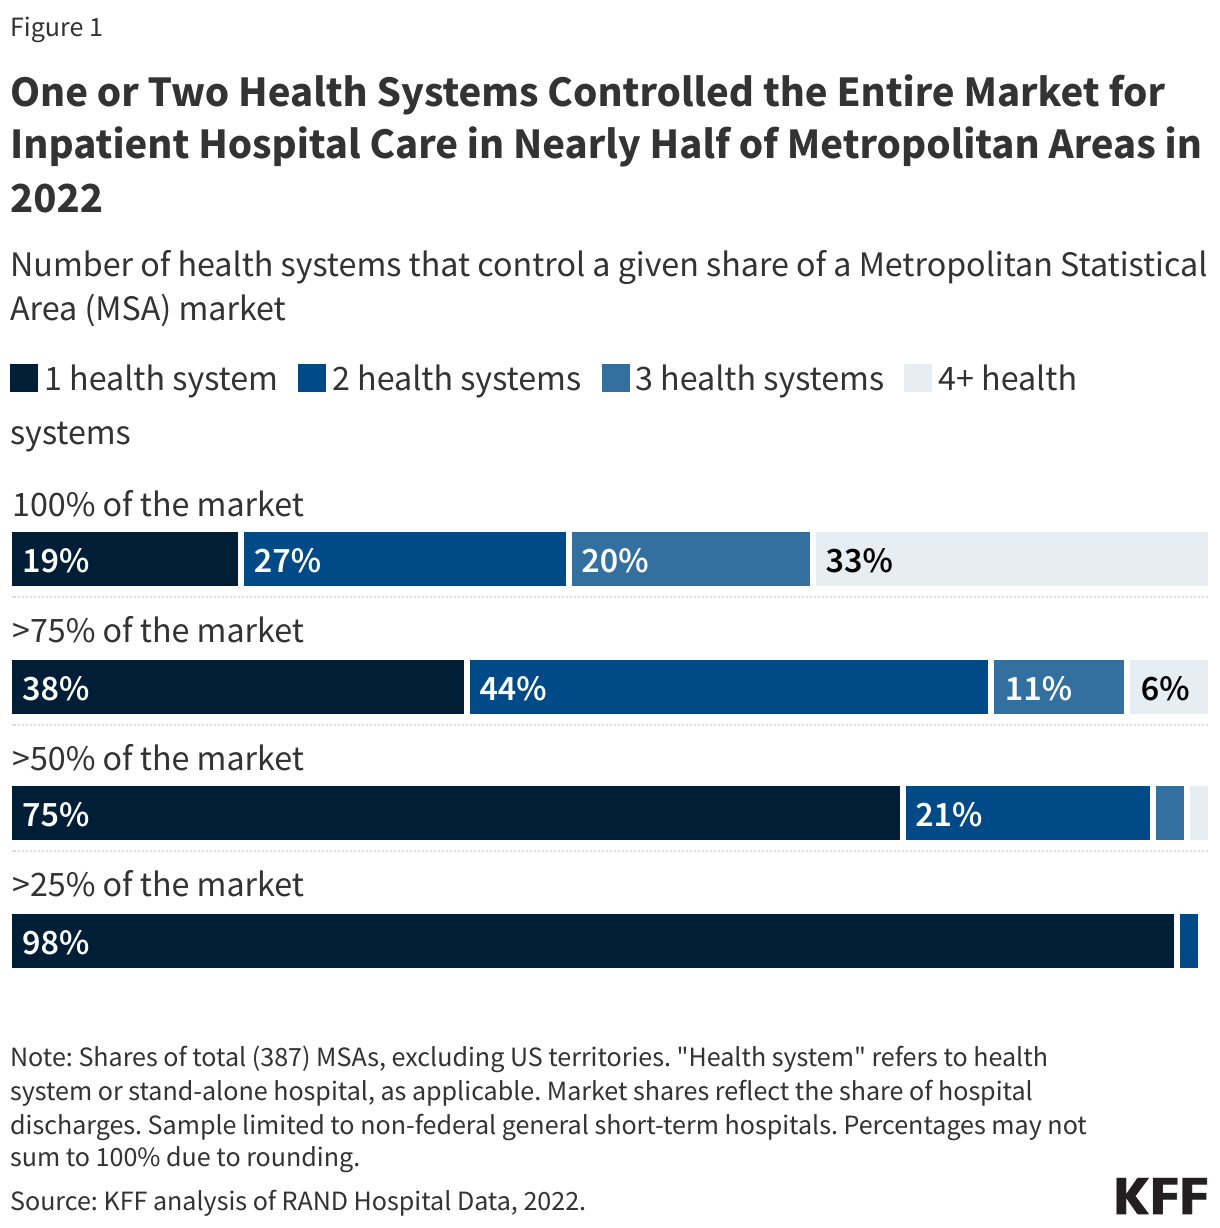
- One or two health systems controlled the entire market for inpatient hospital care in nearly half (47%) of metropolitan areas in 2022.
- In more than four of five metropolitan areas (82%), one or two health systems controlled more than 75 percent of the market.
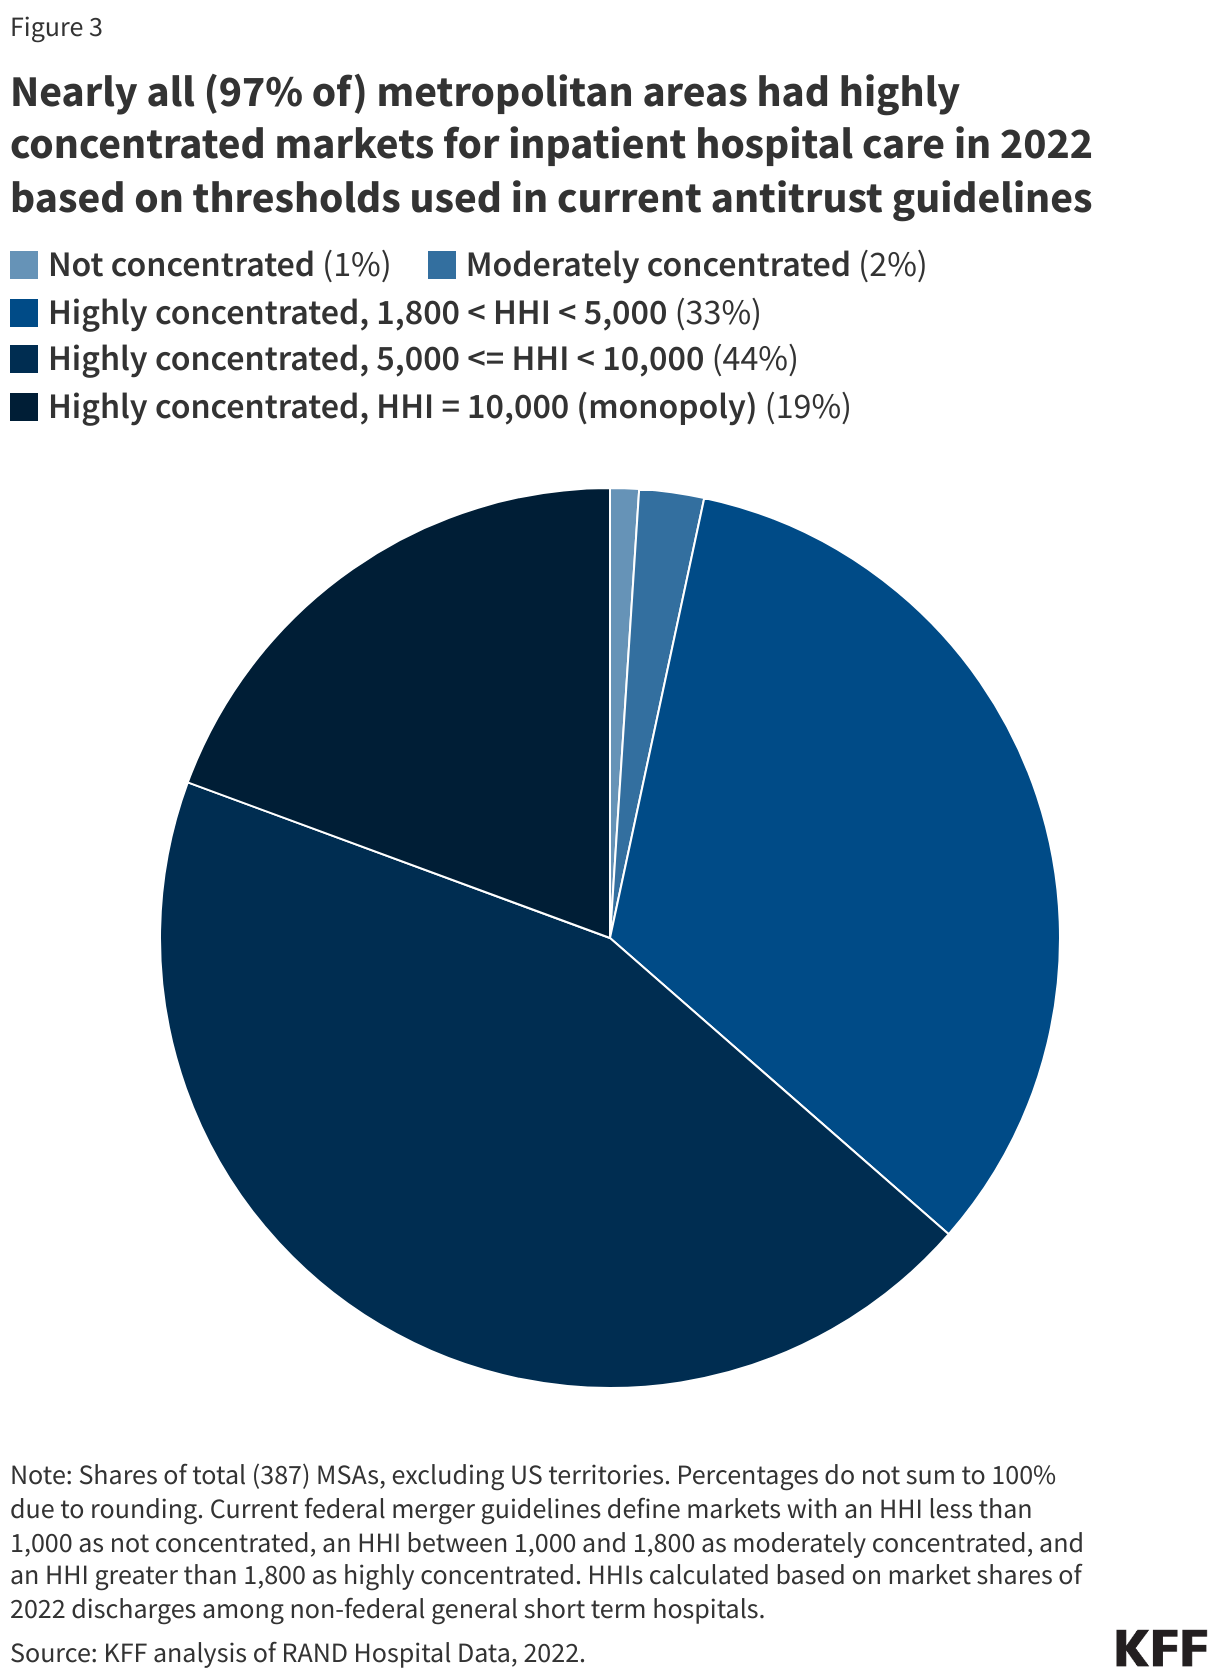
- Nearly all (97% of) metropolitan areas had highly concentrated markets for inpatient hospital care when applying HHI thresholds from antitrust guidelines to MSAs.
One or Two Health Systems Controlled the Entire Market for Inpatient Hospital Care in Nearly Half (47%) of Metropolitan Areas in 2022
Nearly one in five (19%) metropolitan statistical areas (MSAs) were controlled by a single health system, and more than one in four (27%) markets were controlled by two systems in 2022 (see Figure 1). In more than four of five metropolitan areas (82%), one or two health systems controlled more than 75 percent of the market. These markets all met the definition of highly concentrated markets based on thresholds in current antitrust guidelines (see below). One health system controlled at least half of the market in three out of four MSAs (75%) and at least a quarter of the market in nearly every MSA (98%).
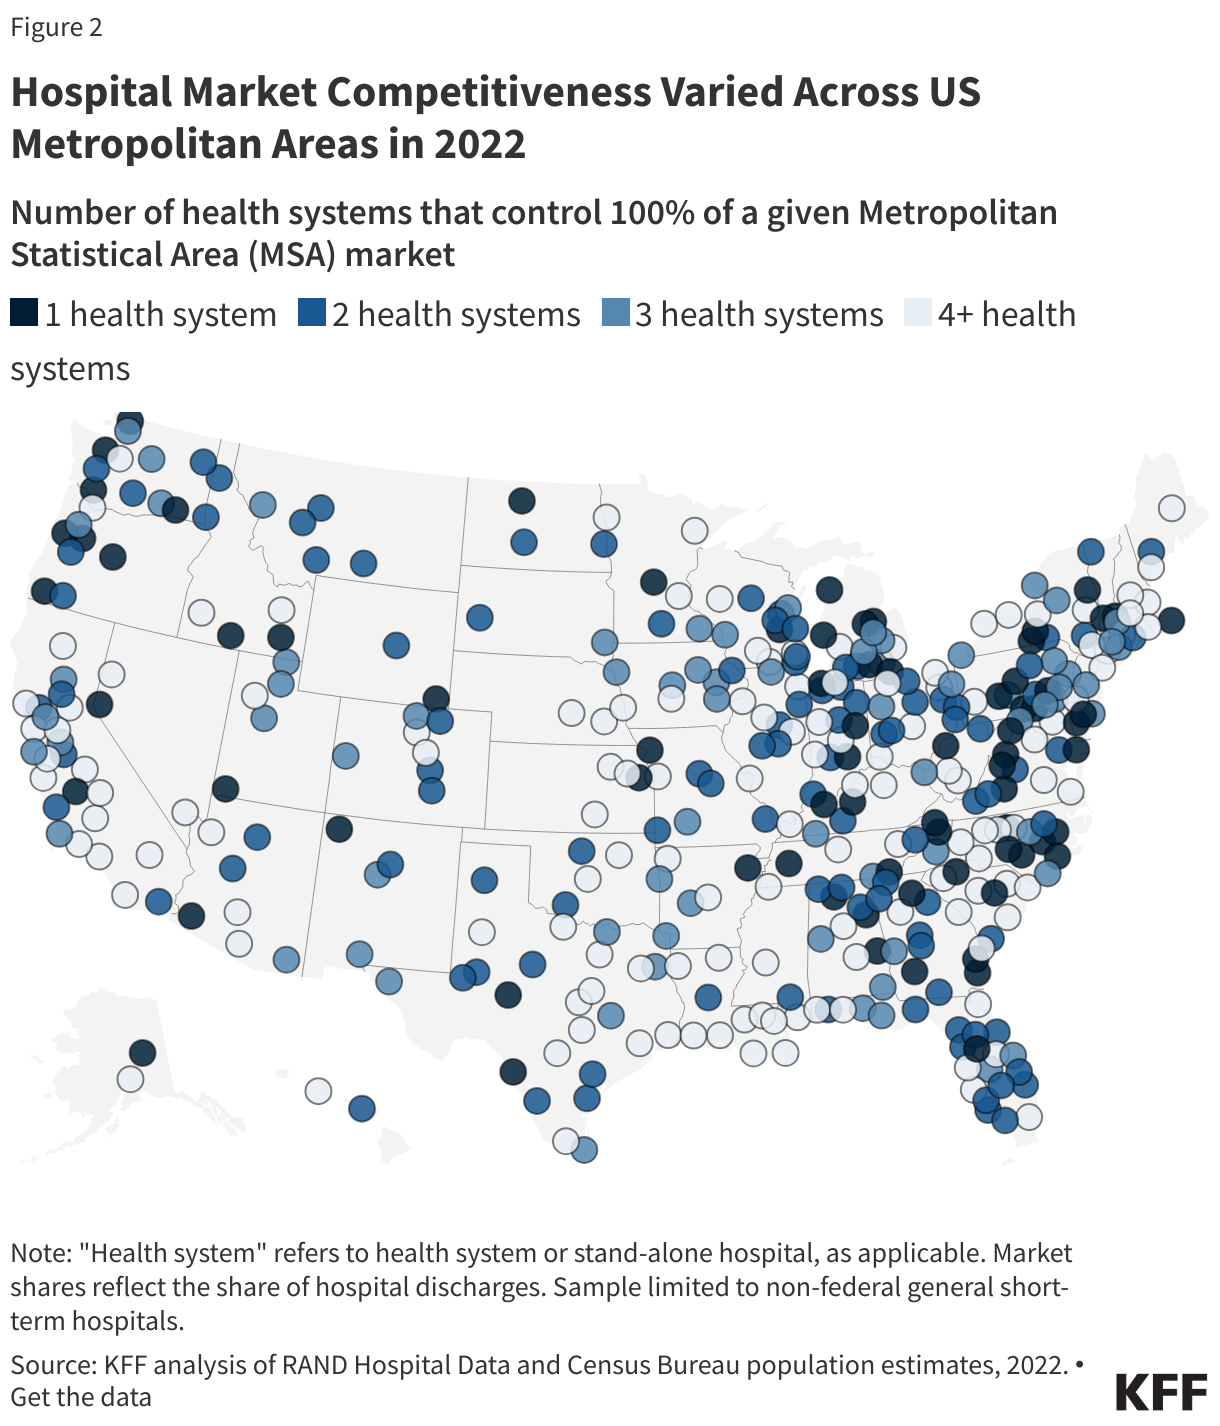
The number of health systems in a given MSA tends to increase with the population of the region. For example, in 79% of MSAs with a population of less than 200,000, one or two health systems controlled the entire market for inpatient hospital care in 2022, as in the Muncie, IN; Napa, CA; and Amherst Town-Northampton, MA MSAs (Figure 2). MSAs with one or two health systems account for nearly half (47%) of all MSAs but 12% of the U.S. population living in metropolitan areas.
Conversely, virtually all (53 of 54) MSAs with a population of at least one million people had at least four health systems, as in the MSAs encompassing Detroit, Miami, and Phoenix. MSAs with four or more health systems accounted for 35% of all MSAs but 79% of the U.S. population living in metropolitan areas.
However, in nine of these relatively large MSAs with four or more health systems, the two largest health systems controlled at least 75% of the market, and in 37 of these areas, they controlled at least 50% of the market. For example, in the MSA encompassing Austin, TX, with 2.4 million residents, two systems (HCA Healthcare and Ascension Health) controlled 85% of the inpatient hospital care market, though Austin is home to more than four health systems. The metropolitan area encompassing Portland, OR, with 2.5 million residents and more than four health systems, is a less concentrated market than Austin’s, but the two largest systems (Legacy Health and Providence) still control a combined 56% of the market. (See Methods for discussion about MSAs as geographic hospital markets).
Nearly all (97% of) metropolitan areas had highly concentrated markets for inpatient hospital care in 2022 based on thresholds used in current antitrust guidelines
Another way to assess market competitiveness is to evaluate a measure of concentration known as the Herfindahl-Hirschman Index (HHI), which is based on the number of participants in a market and their respective shares. The measure runs from 0 (perfectly competitive) to 10,000 (monopoly market). Based on current merger guidelines from the Federal Trade Commission (FTC) and Department of Justice (DOJ), markets can be grouped into three categories: not concentrated (HHI < 1,000), moderately concentrated (1,000 – 1,800), and highly concentrated (HHI > 1,800). This analysis calculates HHIs for MSAs and groups these regions accordingly, though there are other ways of defining the boundaries of hospital markets (see Methods).
Nearly all (97% of) MSAs had highly concentrated markets for inpatient hospital care in 2022 based on thresholds used in current merger guidelines (Figure 3). These guidelines reflect updates in 2023 that lowered the HHI thresholds for moderately concentrated and highly concentrated markets. Based on the thresholds used in prior guidelines, a large majority but somewhat smaller share (93%) of MSAs were highly concentrated markets for inpatient hospital care in 2022, closer to an estimate from an earlier study (90%) that used data from 2016.
As was the case when looking at counts of health systems in MSAs, larger metropolitan areas tended to be less concentrated and more competitive than less populated metropolitan areas, although this was not always the case. All 13 MSAs that were identified as either not concentrated or moderately concentrated had more than one million residents, such as the MSAs encompassing Cincinnati, Oklahoma City, and Miami. However, 41 MSAs with more than one million residents—including the MSAs encompassing Houston, Denver, and Atlanta—had highly concentrated hospital markets. Overall, 70% of people living in metropolitan areas lived in highly concentrated hospital markets.
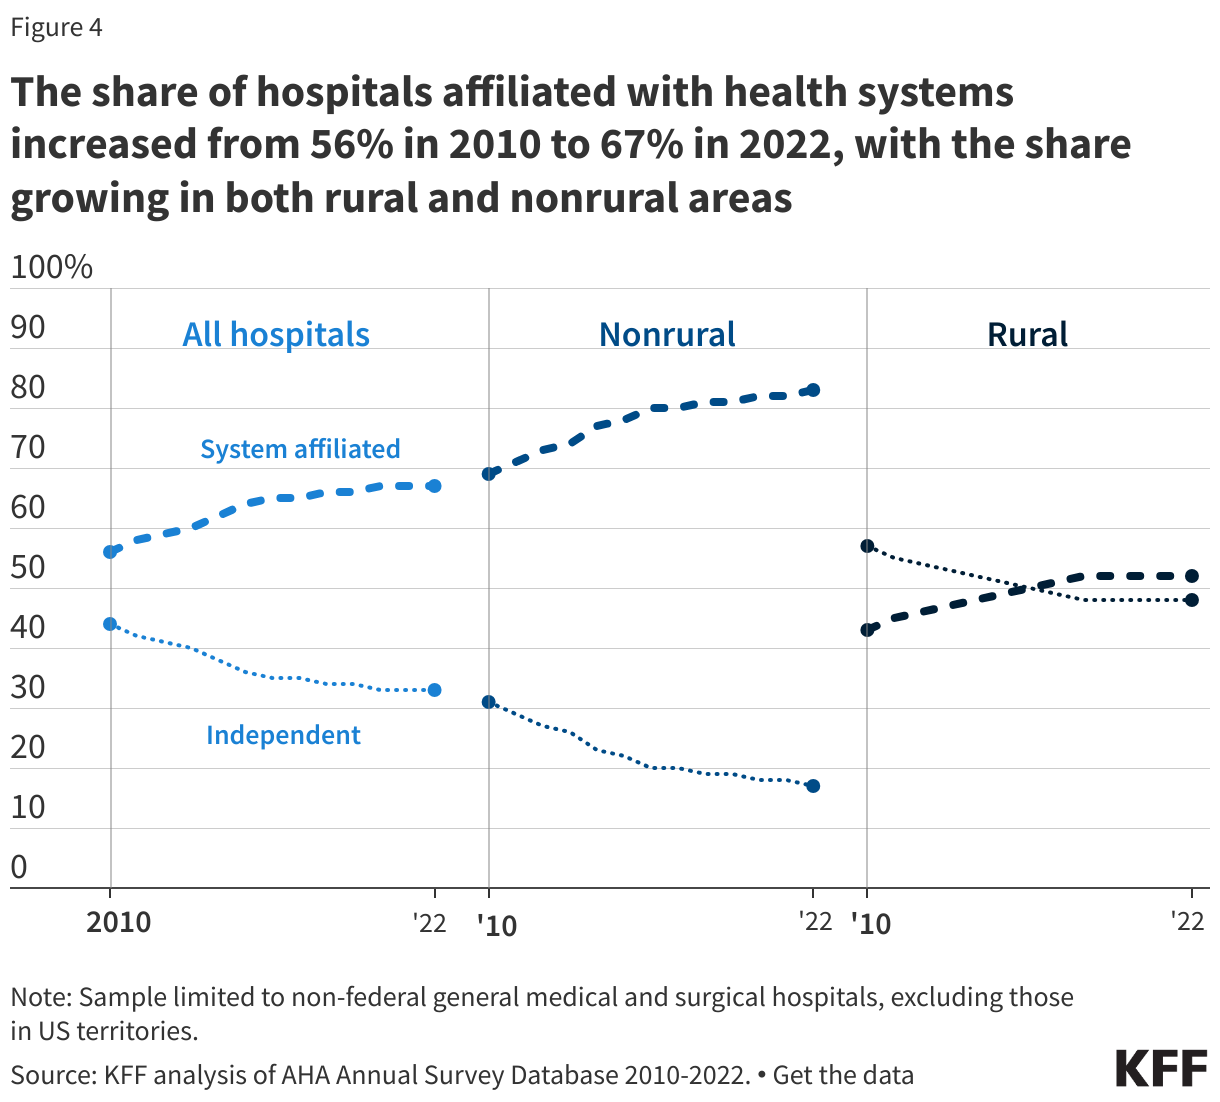
The share of hospitals affiliated with health systems increased from 56% in 2010 to 67% in 2022, with the share growing in both rural and nonrural areas
About two thirds of hospitals (67%) are now part of a larger system, an increase from 56% in 2010 (Figure 4). A smaller share of rural than nonrural hospitals were part of a health system in 2022 (52% versus 83%), though shares have increased over time for both rural and nonrural regions: from 43% in 2010 to 52% in 2022 among rural hospitals and from 69% in 2010 to 83% in 2022 among nonrural hospitals.
Most system-affiliated hospitals in 2022 (53%) were part of a system with at least 15 hospitals, and 22% were in a system with at least 50 hospitals. Systems with at least 100 hospitals accounted for 13% of system-affiliated hospitals.
Hospitals joining larger systems may not always reduce local market competition, for example, if an independent hospital is acquired by a larger system that does not own facilities in the same market. However, mergers between hospitals that operate in different geographic markets for patient care—also known as “cross-market” mergers—may nonetheless lead to higher prices in some cases.
This work was supported in part by Arnold Ventures. KFF maintains full editorial control over all of its policy analysis, polling, and journalism activities.
Methods |
| Analyses of market shares and HHI (e.g., Figures 1 through 3) were based on RAND Hospital Data. RAND Hospital Data are a cleaned and processed version of annual cost reports that Medicare-certified hospitals are required to submit to the federal government. Although limited to Medicare-certified hospitals, in 2022, our analysis of RAND data included the vast majority (97%) of non-federal general medical and surgical hospitals in US metropolitan areas included in our analysis of the AHA Annual Survey Database (see below). Cost reports were assigned to years based on the end of the reporting period and were scaled up or down to reflect a 365-day period, as necessary.
Analyses of market shares and HHI were restricted to non-federal, general short-term hospitals. Market shares were calculated as the share of inpatient discharges in an MSA that occurred within a given health system or independent hospital. One percent of hospitals that met our other sample restrictions had missing values for inpatient discharges and were excluded. Hospitals were grouped into health systems, as applicable, based on the 2022 AHRQ Compendium of US Health Systems. MSAs reflect 2023 geographic definitions from the Census Bureau calculated based on data from the 2020 decennial census. HHIs were calculated as the sum of squared market shares for all health systems in a given MSA (e.g., an MSA divided evenly between two systems would have an HHI of 502 + 502 = 5,000). We obtained 2022 MSA population estimates from the Census Bureau. We used MSAs as a proxy for hospital markets, which is one approach used by other studies summarizing hospital market competition across the country. There are other ways of defining markets that would yield different results when calculating the level of competition. For example, one relatively recent report also evaluated MSAs but focused on where residents received their care, including at hospitals outside of a given MSA. As another example, some have defined markets based on Hospital Referral Regions (HRRs) and USDA Commuting Zones. More precise market definitions, such as those used to define competition in antitrust cases, were not feasible. This study did not exclude MSAs with populations of at least three million as some others have done, because the analysis sought to describe competition across all metropolitan areas. Analyses of the share of hospitals affiliated with systems are based on the AHA Annual Survey Database, which includes its own measure of system affiliation. We restricted this analysis to nonfederal, general medical and surgical hospitals. Hospitals were designated as rural if they were located in a ZIP code that is eligible for Rural Health Grants through the Federal Office of Rural Health Programs. |