CDC’s Funding for State and Local Public Health: How Much and Where Does it Go?
Summary
Federal funding has long been a major source of support for public health efforts across the United States, estimated to account for more than half of state and local health department budgets. The Centers for Disease Control and Prevention (CDC), the primary public health agency of the federal government, provides much of this funding, helping to support public health systems and activities across the country. However, CDC and other federal health agencies are being targeted by the Trump administration for downsizing and budget cuts, reductions that could impact the amount of funding available for public health. To better understand how much CDC funding is provided to state and local jurisdictions, we analyzed FY 2023 funding obligation data (see Methods and Appendix 1). Among the key findings:
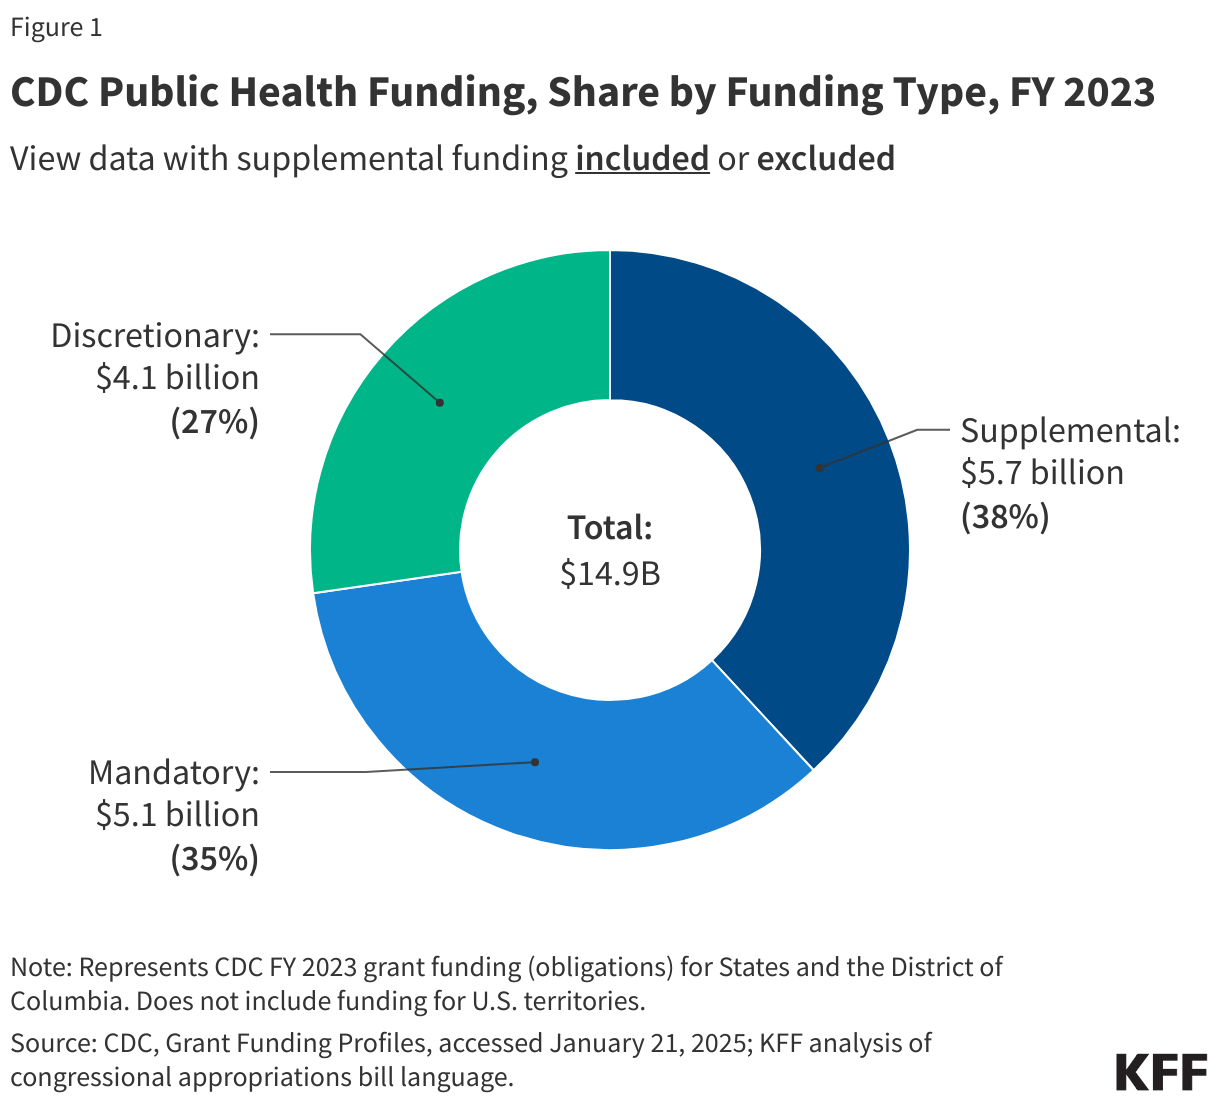
- In FY 2023, CDC obligated almost $15 billion to state and local jurisdictions. While most (62% or $9.2 billion) was from CDC’s regular budget, a significant share (38% or $5.7 billion) was from time-limited, supplemental funding for COVID-19 and public health infrastructure rebuilding.
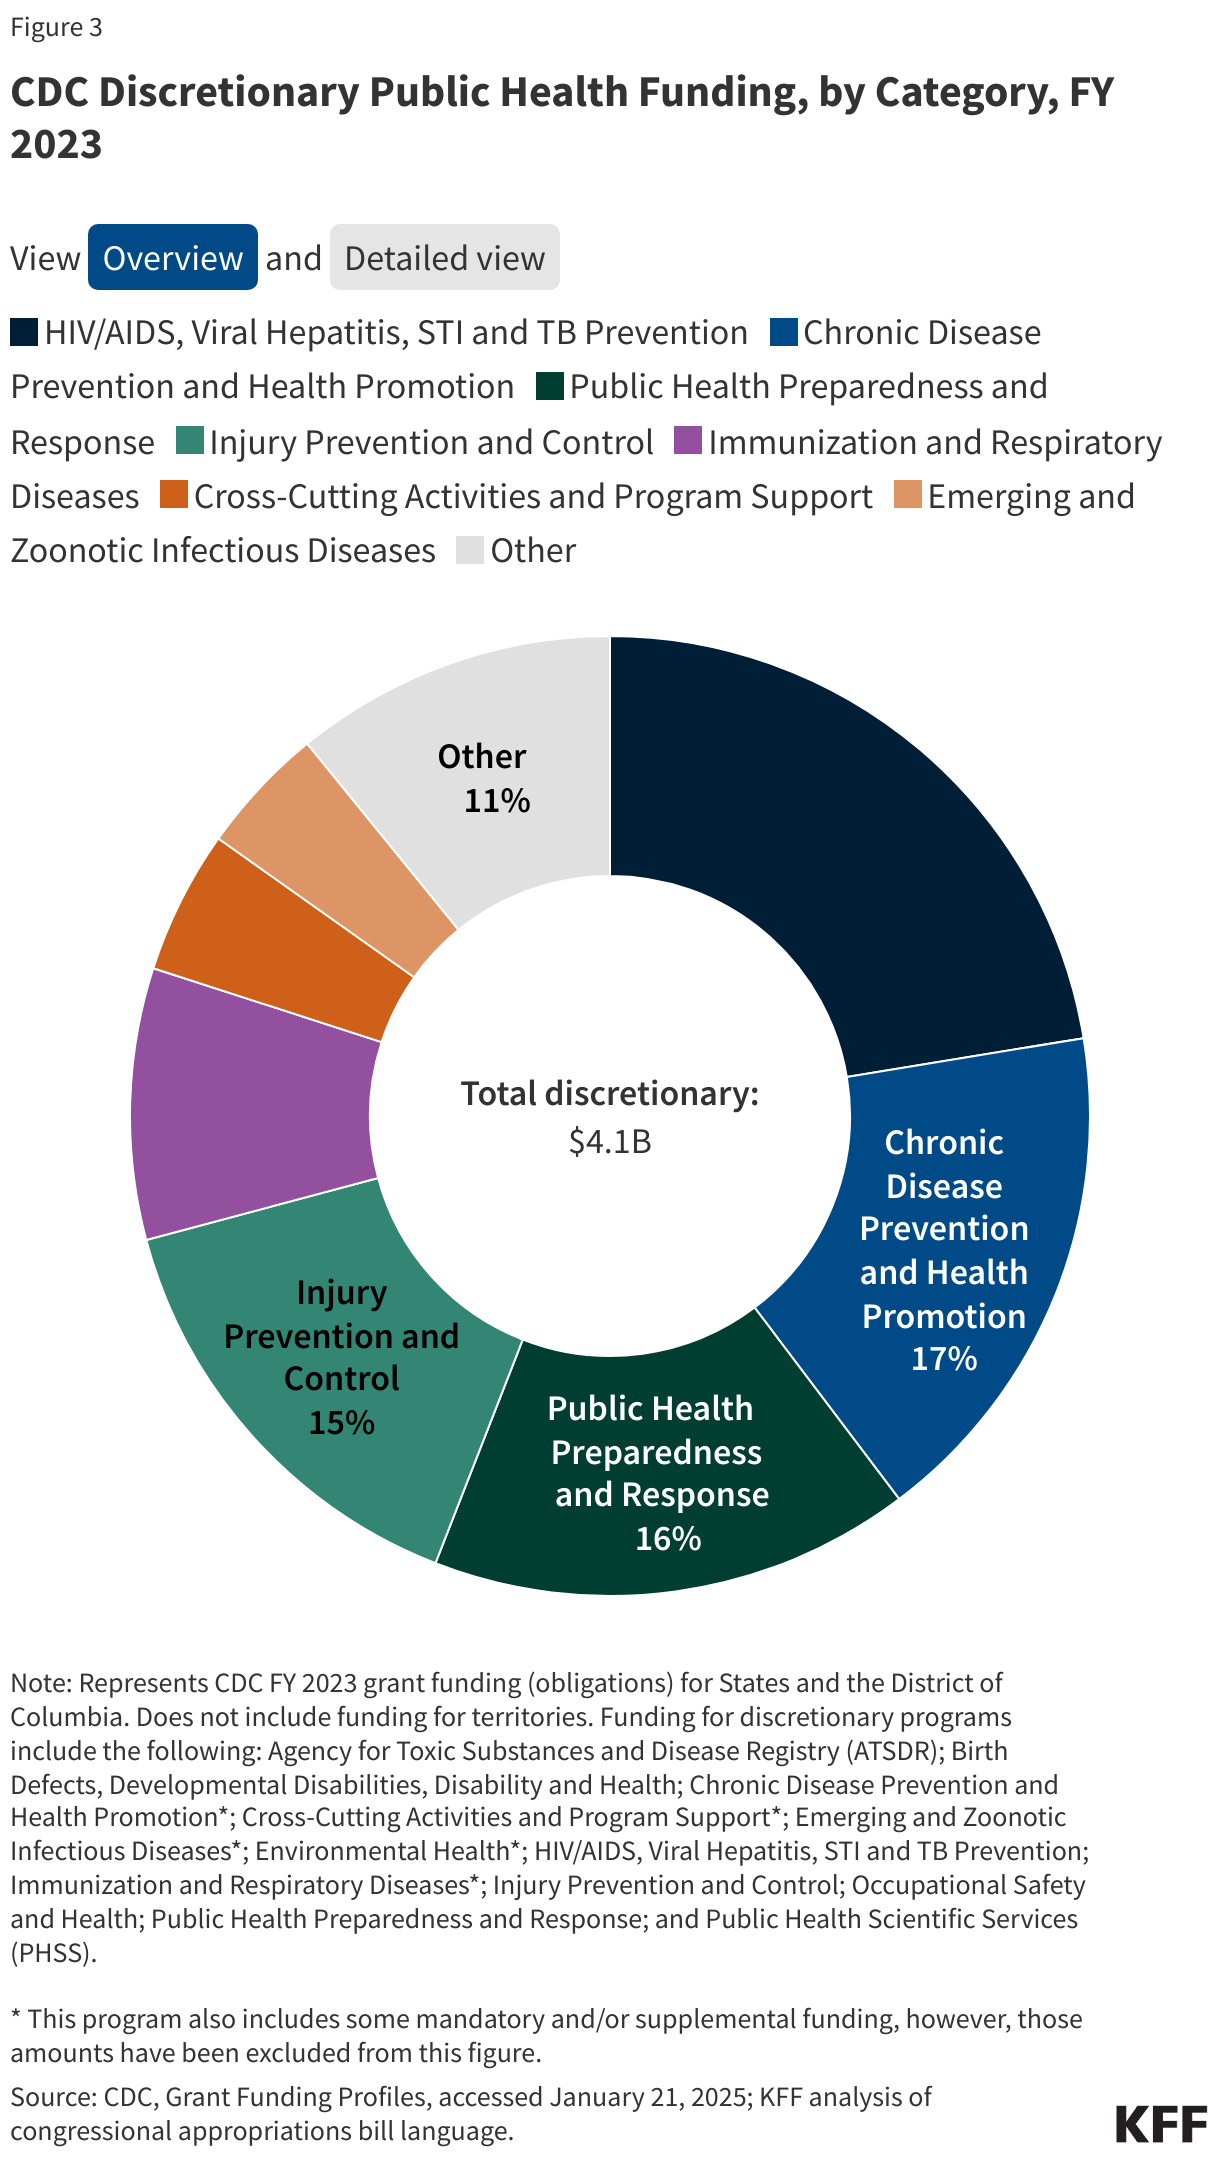
- Of the $9.2 billion in regular budget obligations, half ($4.7 billion or 51%) was for the Vaccines for Children program, a mandatory program that provides vaccines at no cost for children who are uninsured or underinsured and other eligible children (4% was for additional mandatory programs). The remaining $4.1 billion (45%) was discretionary funding supporting a range of programs including HIV/AIDS, Viral Hepatitis, STI and TB Prevention, Chronic Disease Prevention and Health Promotion, Public Health Preparedness and Response, and Injury Prevention and Control.
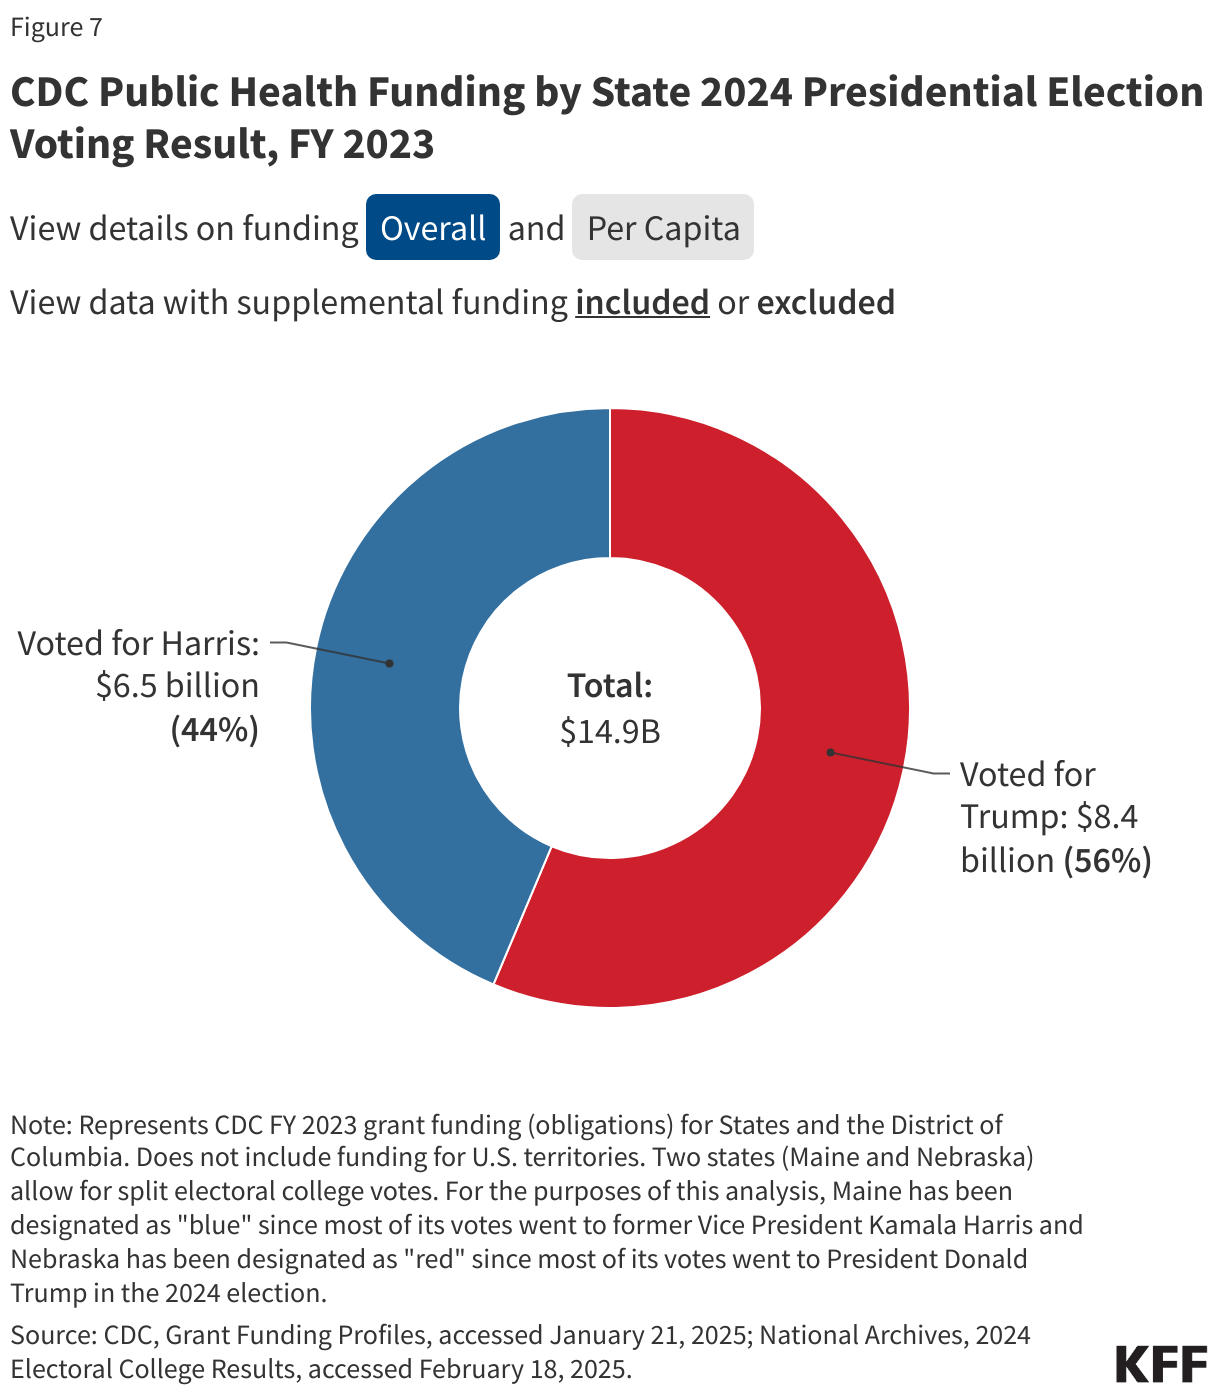
- Both red and blue states benefit from CDC funding, with states that voted for President Trump in 2024 receiving the majority of funding (56%), compared to states that voted for Kamala Harris (44%); on a per capita basis, states voting for Harris received slightly more compared to those that voted for Trump ($46 vs $43 per capita).
- The top five state recipients also represent a mix of red and blue states (California, Texas, New York, Florida, and Georgia), as do the top five states by funding per capita (District of Columbia, Alaska, Maryland, Vermont, and Wyoming).
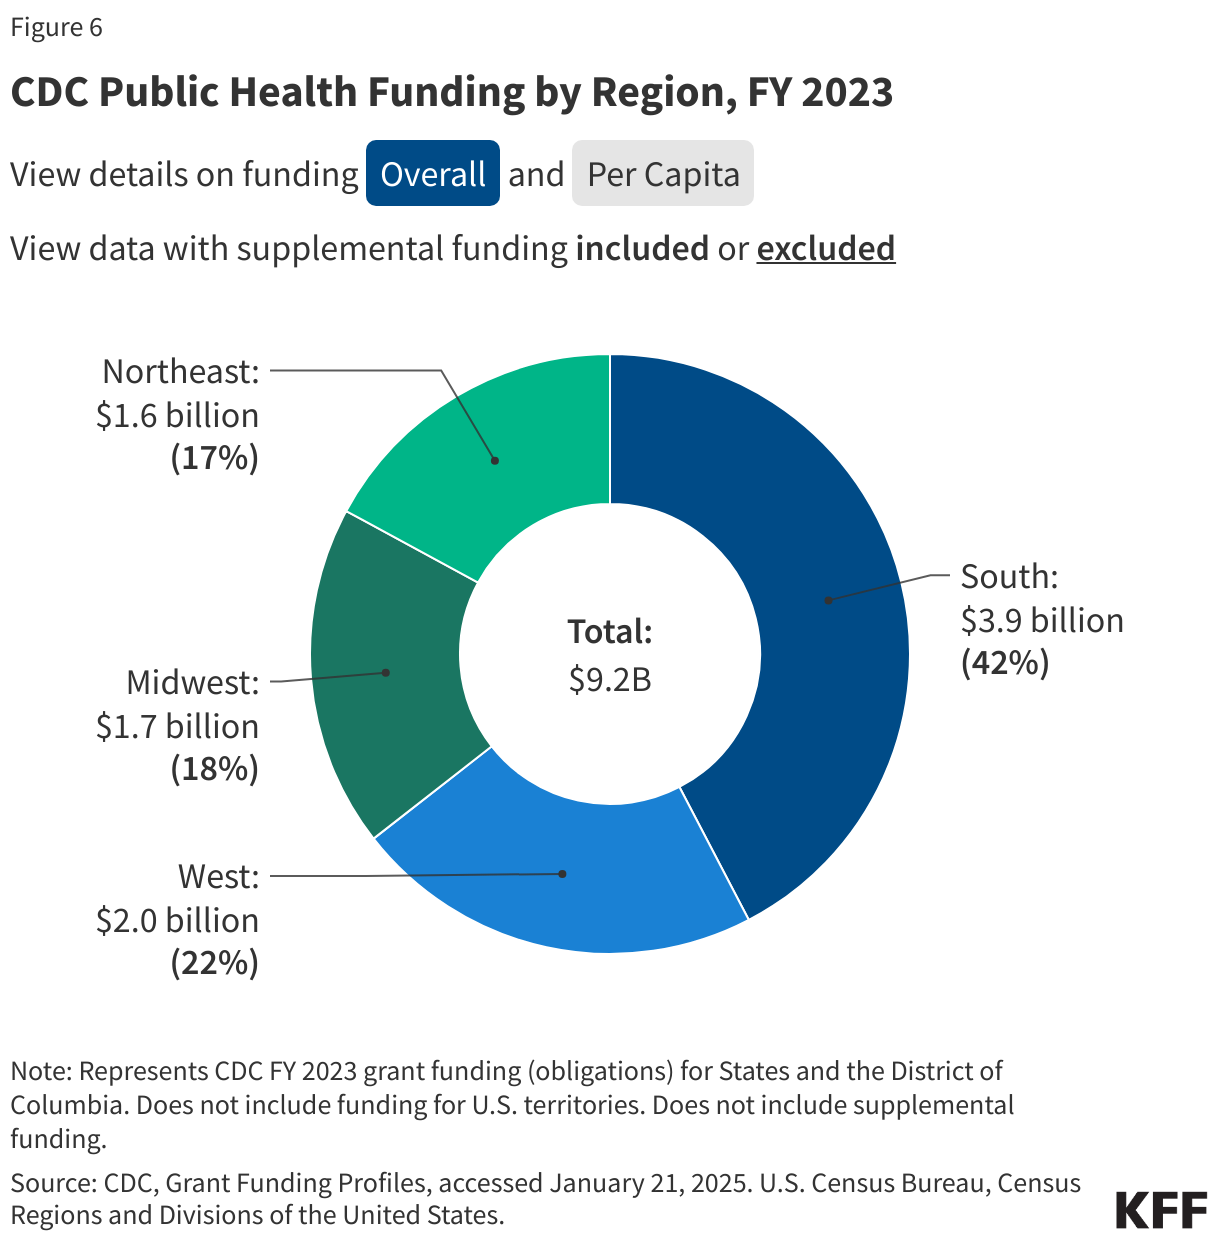
- By region, Southern states received the largest share of funding (43%) followed by the West (22%), Midwest (19%), and Northeast (17%); the South also ranked first in funding per capita.
Funding cuts, therefore, could have a significant impact on the amount of funding available to states and local jurisdictions for public health activities. Such cuts, coupled with the expected end in supplemental funding for COVID-19 and public health infrastructure support, could also represent a double whammy, affecting both red and blue states, and especially states in the South. While state and local governments could potentially fill some of the gap left by federal dollars, they may also be facing their own budget constraints and other cuts in federal funding, leaving the future of the nation’s public health infrastructure capacity uncertain.
Findings
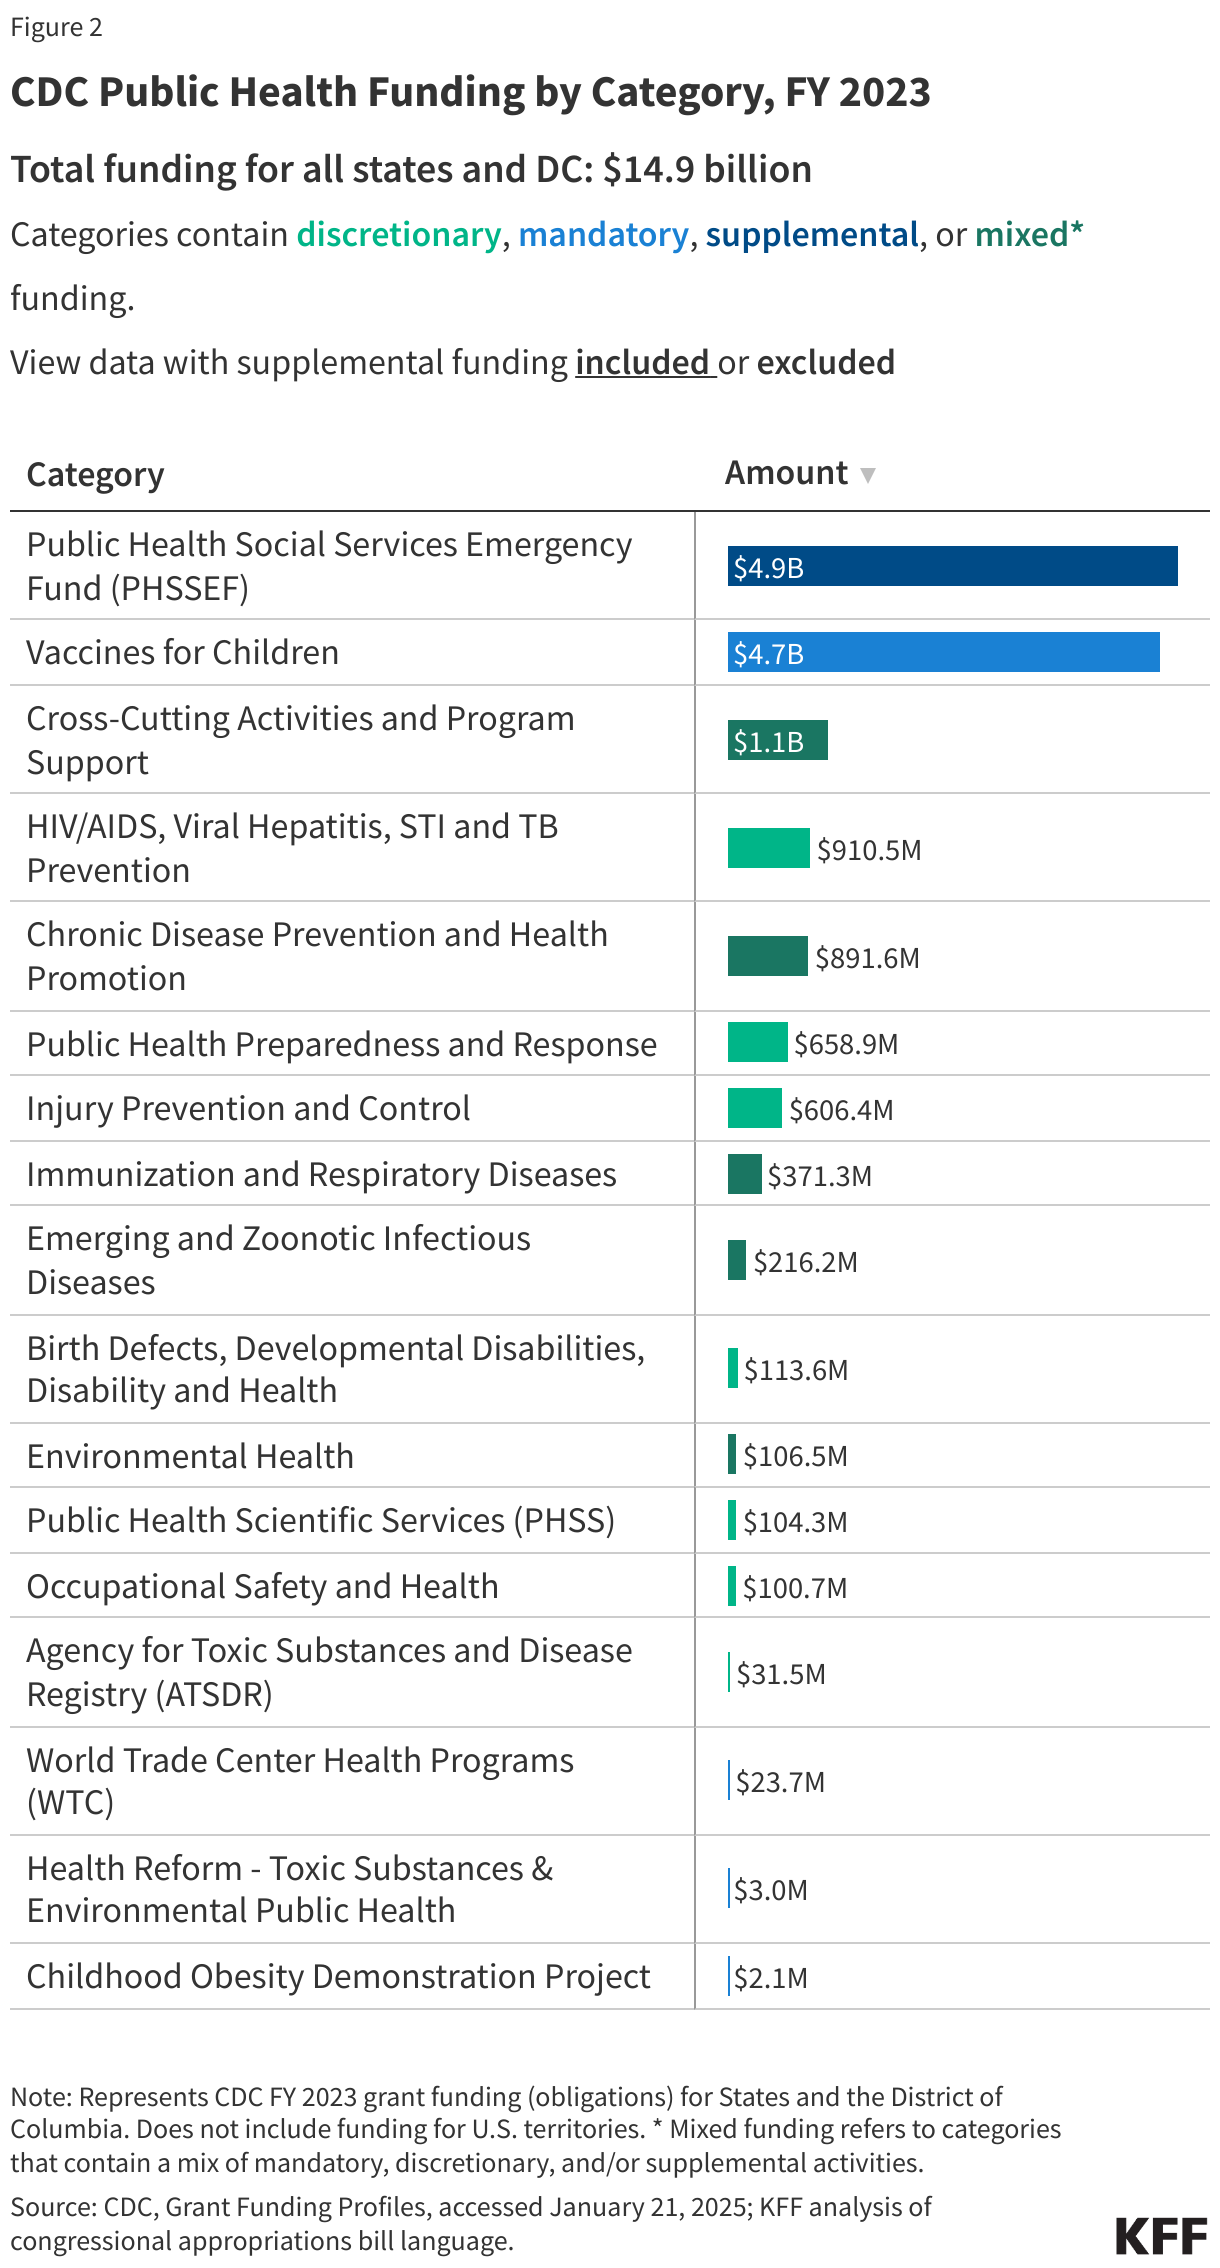
- In FY 2023, CDC obligated $14.9 billion to state and local jurisdictions. This included $9.2 billion (62%) as part of its regular budget and $5.7 billion (38%) in supplemental funding (see Figure 1). These amounts were distributed to jurisdiction across a number of categories (see Figure 2).
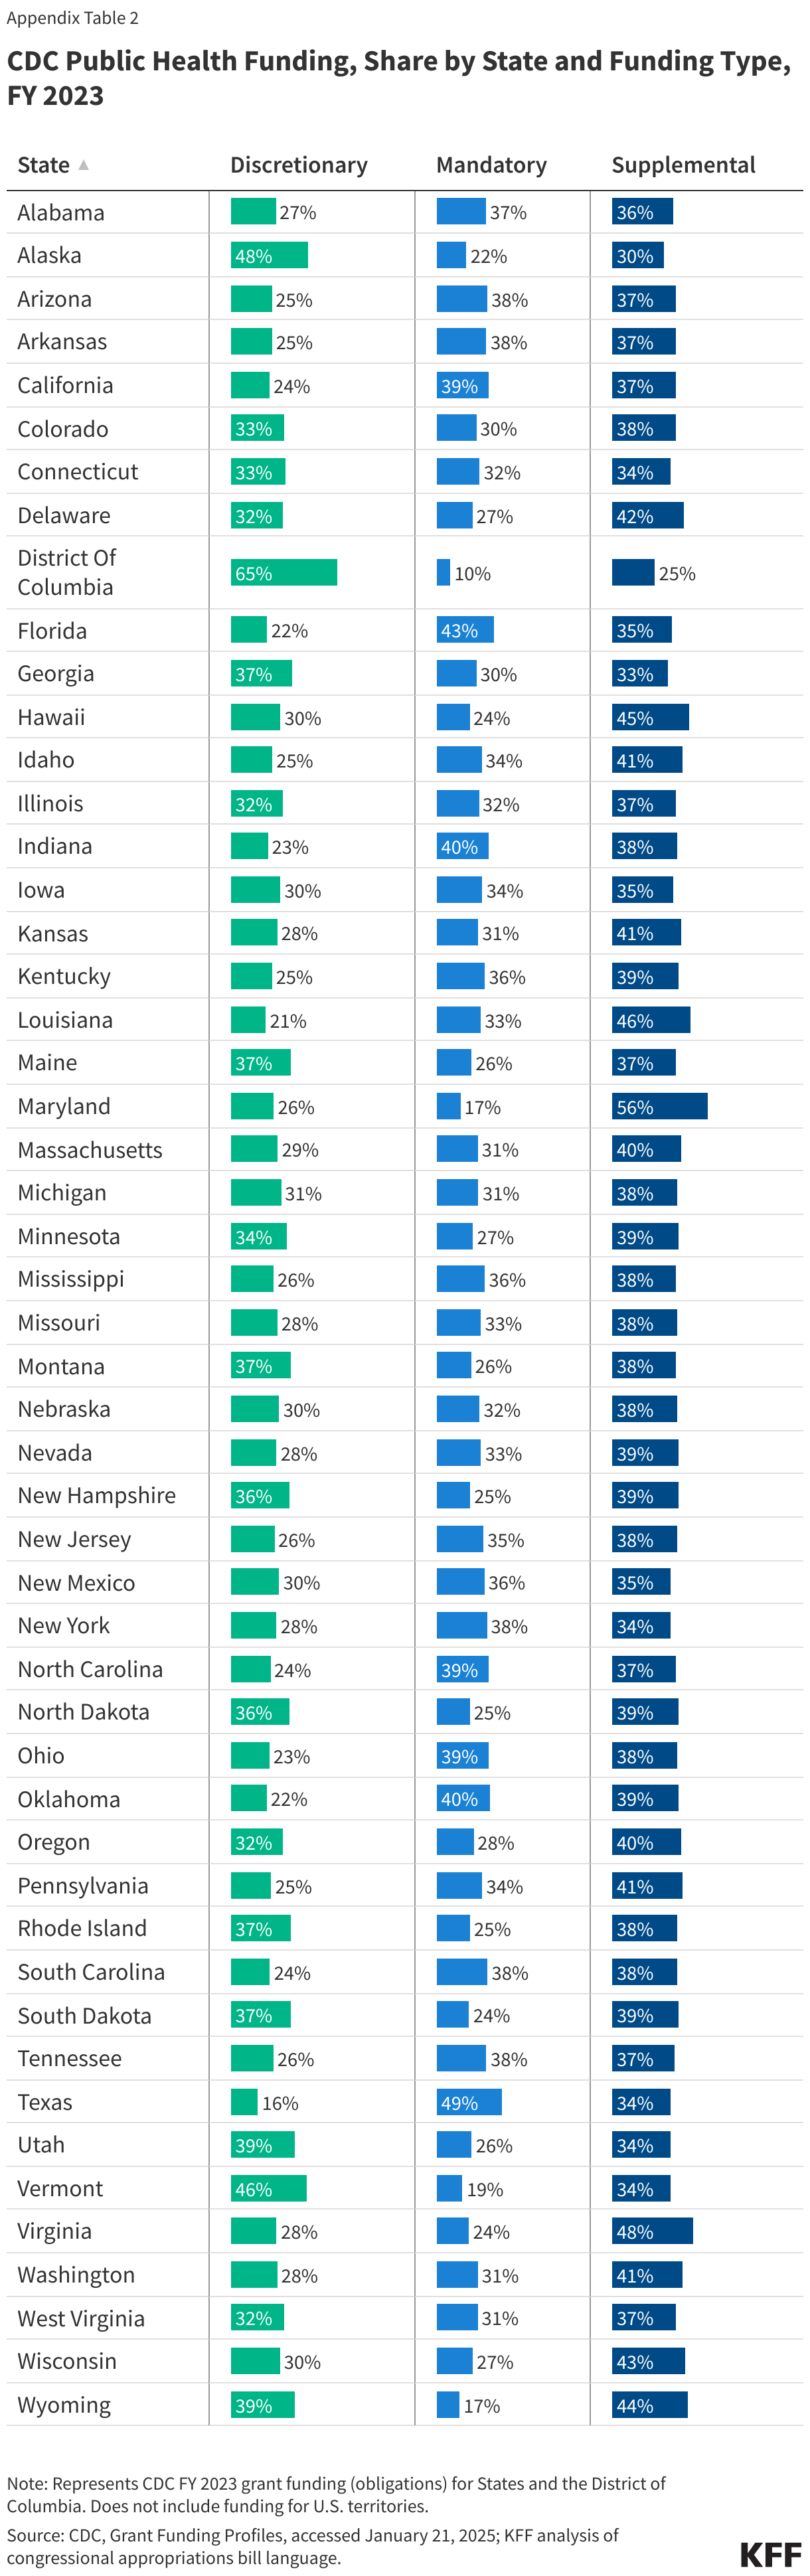
- Of the $9.2 billion in regular budget obligations, $5.1 billion (56%) was mandatory funding, required by law, and $4.1 billion (44%) was discretionary and dependent on annual appropriations from Congress. The share of mandatory vs discretionary funding provided varied by state (see Appendix Table 2).
- Most mandatory funding (92%) was for the Vaccines for Children program. The remainder was for Chronic Disease Prevention and Health Promotion, Cross-Cutting Activities and Program Support, and several other smaller mandatory programs.
- Discretionary funding was spread across a wide range of public health areas, with the largest share (22%) directed to HIV/AIDS, Viral Hepatitis, STI and TB Prevention efforts. Chronic Disease Prevention and Health Promotion received the next largest share (17%), followed by Public Health Preparedness and Response (16%), and Injury Prevention and Control (15%). A variety of other programs comprised the remainder (see Figure 3).
- Of the $5.7 billion in supplemental funding, most ($4.9 billion or 87%) was from the Public Health and Social Services Emergency Fund (PHSSEF), transferred to CDC by HHS to support COVID-19 response activities as well as public health infrastructure and workforce. The remainder was for Cross-Cutting Activities and Program Support, which included COVID response activities and hurricane supplemental funding.
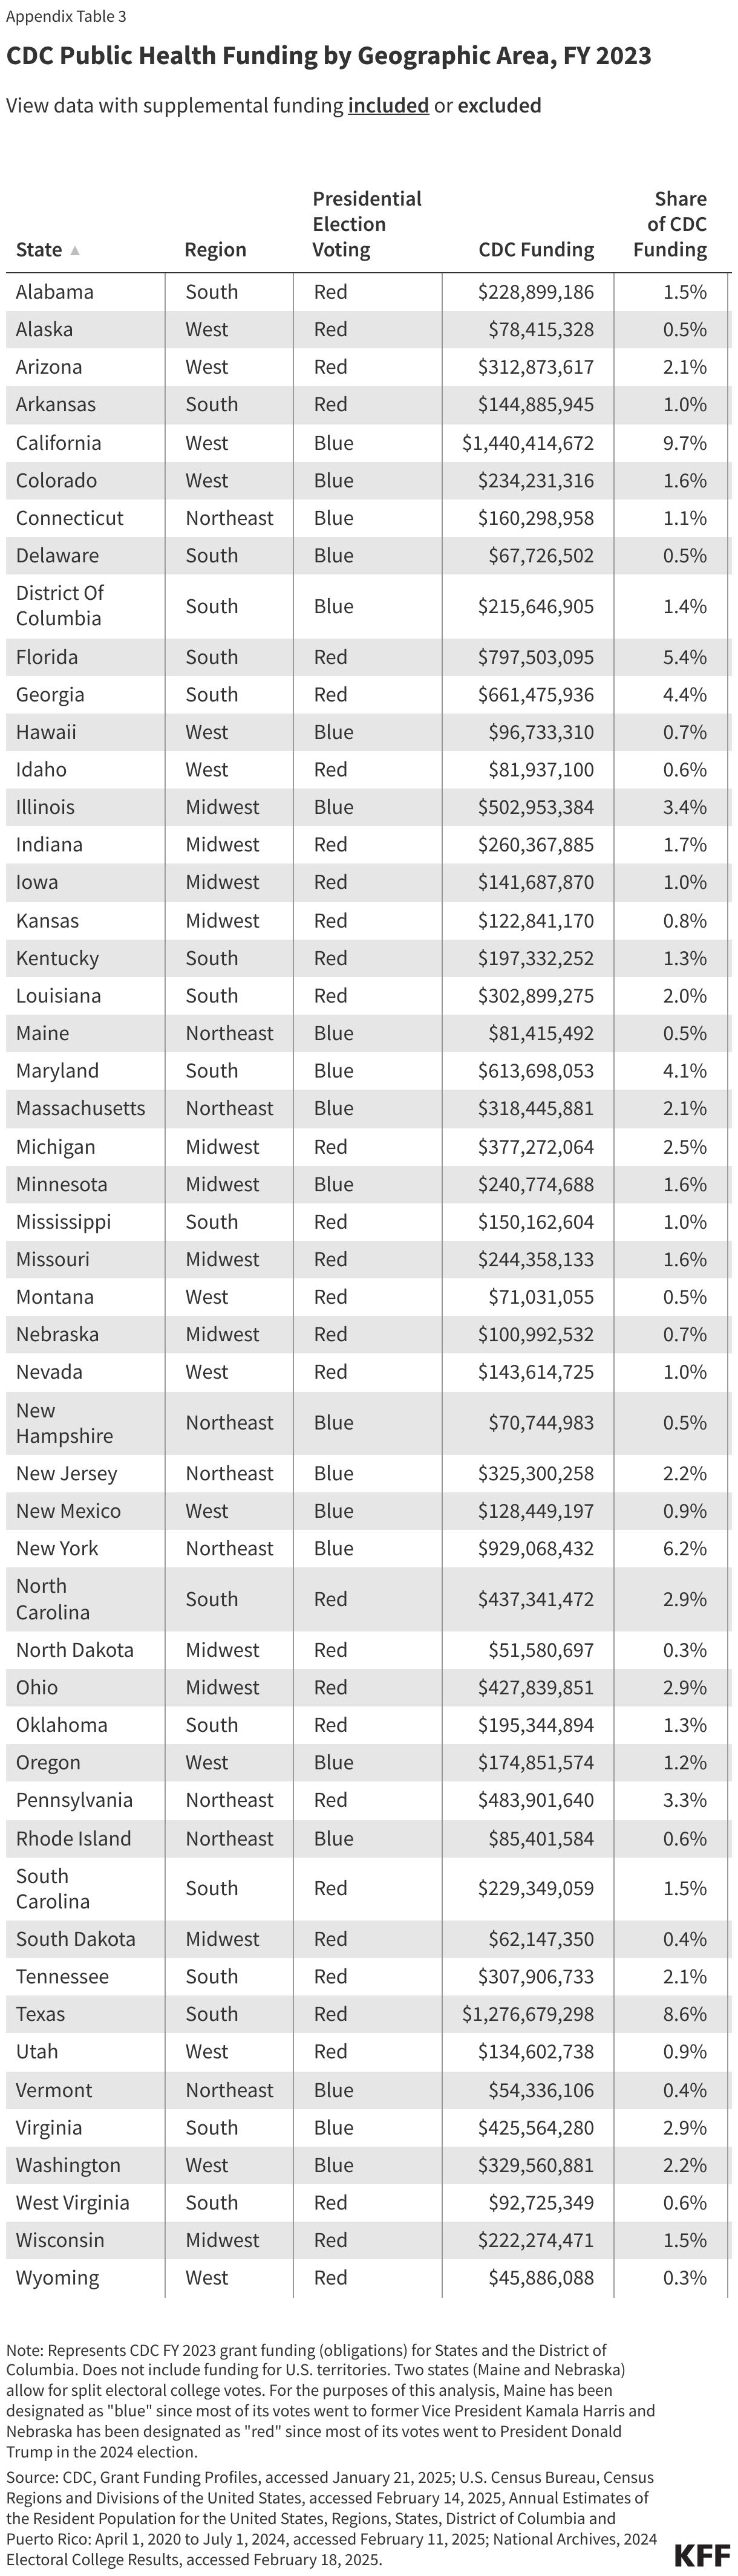
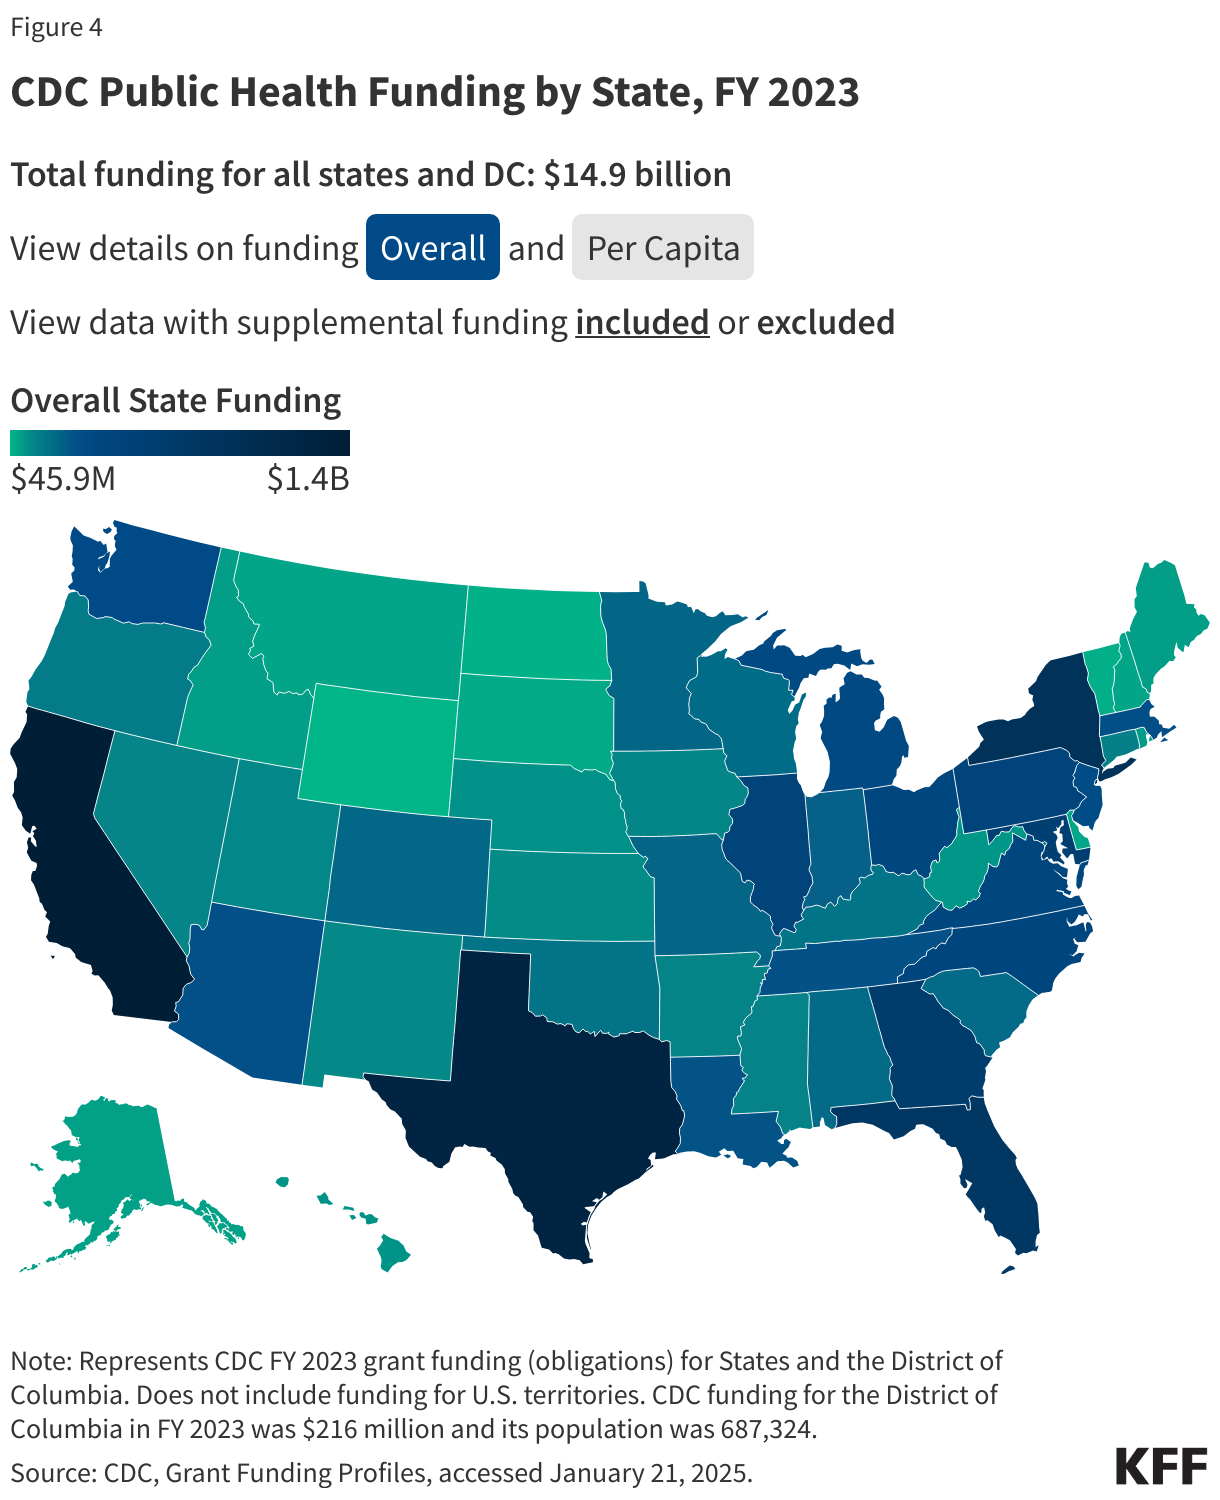
- There was significant variation in the amount of CDC funding provided to the 50 states and Washington D.C., ranging from $45.9 million to $1.4 billion; when standardized by population size, funding ranged from $35 to $314 per capita (see Figure 4 and Appendix Table 3).
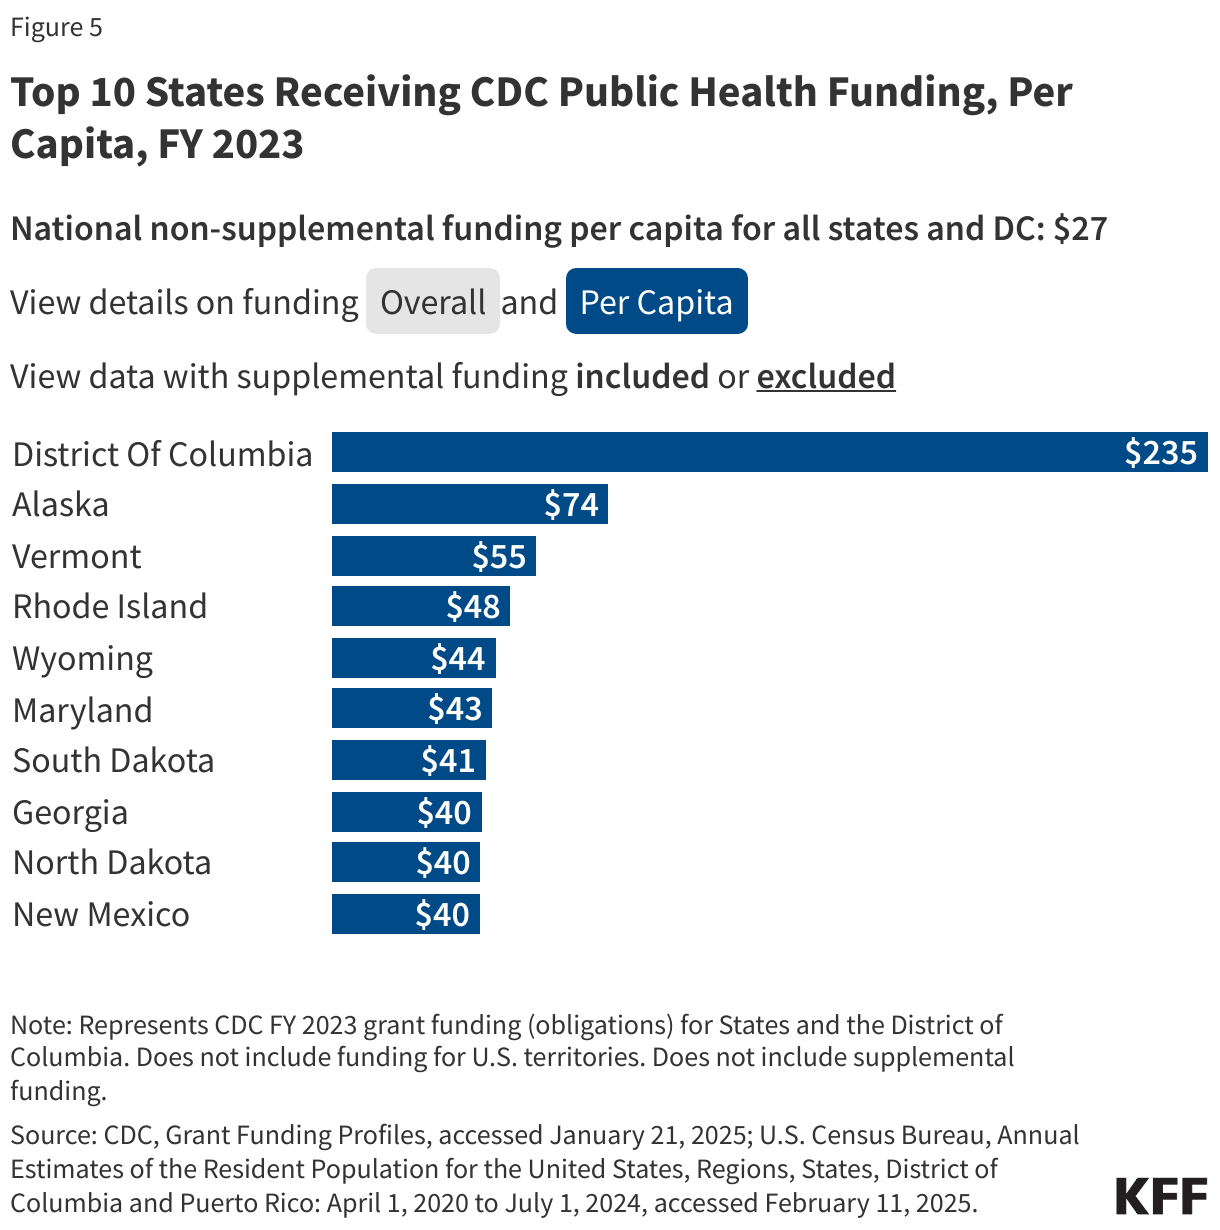
- Funding was concentrated in a subset of states, with the top 10 state recipients accounting for 51% of all funding, and the top five states accounting for a third (34%). The top five state recipients were California, Texas, New York, Florida, and Georgia. Per capita, the top five state recipients were the District of Columbia, Alaska, Maryland, Vermont, and Wyoming (see Figure 5).
- If supplemental funding is removed, CDC’s funding by state ranged from $25.7 million to $906 million, or $21 to $235 per capita; the top five state recipients, representing over a third (36%) of non-supplemental funding, remain the same (California, Texas, New York, Florida, and Georgia), with some variation in the rank by per capita funding (District of Columbia, Alaska, Vermont, Rhode Island, and Wyoming).
- By region, the South received the largest share of funding overall (43%) followed by the West (22%), Midwest (19%), and Northeast (17%). In per capita terms, the South remained the top funded region followed by the Northeast, West, and Midwest. With supplemental funding removed, the funding distribution is largely the same as is the per capita rank by region (see Figure 6).
- States that voted for President Trump in the 2024 election received the majority of CDC funding, although there was a more even distribution when standardized by population size. The 31 states that voted for President Trump received 56% of overall CDC funding, compared to 44% for the 20 states that voted for Kamala Harris. On a per capita basis, states voting for Harris received slightly more ($46 per capita) compared to those voting for Trump ($43 per capita). With supplemental funding removed, the distribution of funding remains almost the same (57% for Trump states and 43% for Harris states) while funding per capita was almost even ($27 per capita for Trump states vs $28 per capita for Harris states) (see Figure 7).
Methods |
| Data for this analysis were obtained from the CDC’s Grant Funding Profiles database which contains data on funding obligations provided by the agency to U.S. states, including the District of Columbia, territories, and freely associated states by fiscal year and grantee name. The focus of this analysis was on funding obligations provided in FY 2023 to state and local jurisdictions only (funding provided to U.S. territories and freely associated states was excluded). For the purposes of this analysis, funding provided directly to local recipients (e.g., local health departments) is included in the state totals. CDC’s database only includes grants and cooperative agreements, and not other CDC expenditures (e.g., funding for international activities, research and development agreements, user fees), and therefore do not represent total CDC obligations. Most funding represents actual obligations, however, funding for the Vaccines for Children program represents the value of vaccines purchased and provided. Grantee names were manually reviewed by KFF researchers and re-coded to the following grantee types: state or local government (including state and local governments and agencies, public school districts, public universities, and tribal governments), non-profit, or private sector. It is important to note that the grantee’s address often represents the geographical location of the grantee’s primary headquarters and may not reflect the actual geographic scope of the grantee’s work, including national associations that carry out public health programs across the country. Classification of mandatory, discretionary, and supplemental funding was determined by KFF based on congressional appropriations bill language. Supplemental funding represents funding appropriated or transferred from emergency supplemental bills. Population data, for calculating per capita funding amounts, was obtained from the U.S. Census Bureau using the 2023 state population tables, and state regional classifications were obtained from the U.S. Census Bureau’s States and Regions Divisions. State 2024 presidential election voting results were obtained from the National Archive’s 2024 Electoral College Results. While most states delegate all of their electoral college votes to one presidential candidate, two states (Maine and Nebraska) allow for split electoral college votes. For the purposes of this analysis, Maine has been designated as “blue” since most of its votes went to former Vice President Kamala Harris and Nebraska has been designated as “red” since most of its votes went to President Donald Trump in the 2024 election. |
Appendix 1: What Does the CDC Budget Include?
CDC’s budget is comprised of three major categories:
- A discretionary budget determined and appropriated annually by Congress;
- A mandatory budget determined by a specific set of congressionally-mandated program authorizations, such as the Vaccines for Children program;
- In some years, supplemental funding is also provided to CDC outside of the regular annual appropriations process, typically to help with response to disease outbreaks or other health emergencies. Starting in 2020, CDC funding has included supplemental funds supporting COVID-19 response.
In FY 2023, the CDC discretionary budget was $8.28 billion, while mandatory budget totaled $6.97 billion. The exact amount of supplemental funding in CDC’s FY2023 budget is not clear. Since 2020, Congress provided CDC with additional funding via five different COVID-19 relief laws, with much of these supplemental appropriations made available to be spent over several years. In addition, other supplemental funds have been provided to CDC via transfers from other agencies. Further, in later legislation Congress rescinded some of the previously appropriated COVID-19 relief funding for CDC. CDC does not publicly report how much supplemental funding it has available in its budget, so developing a full picture of CDC’s available funding is a challenge.
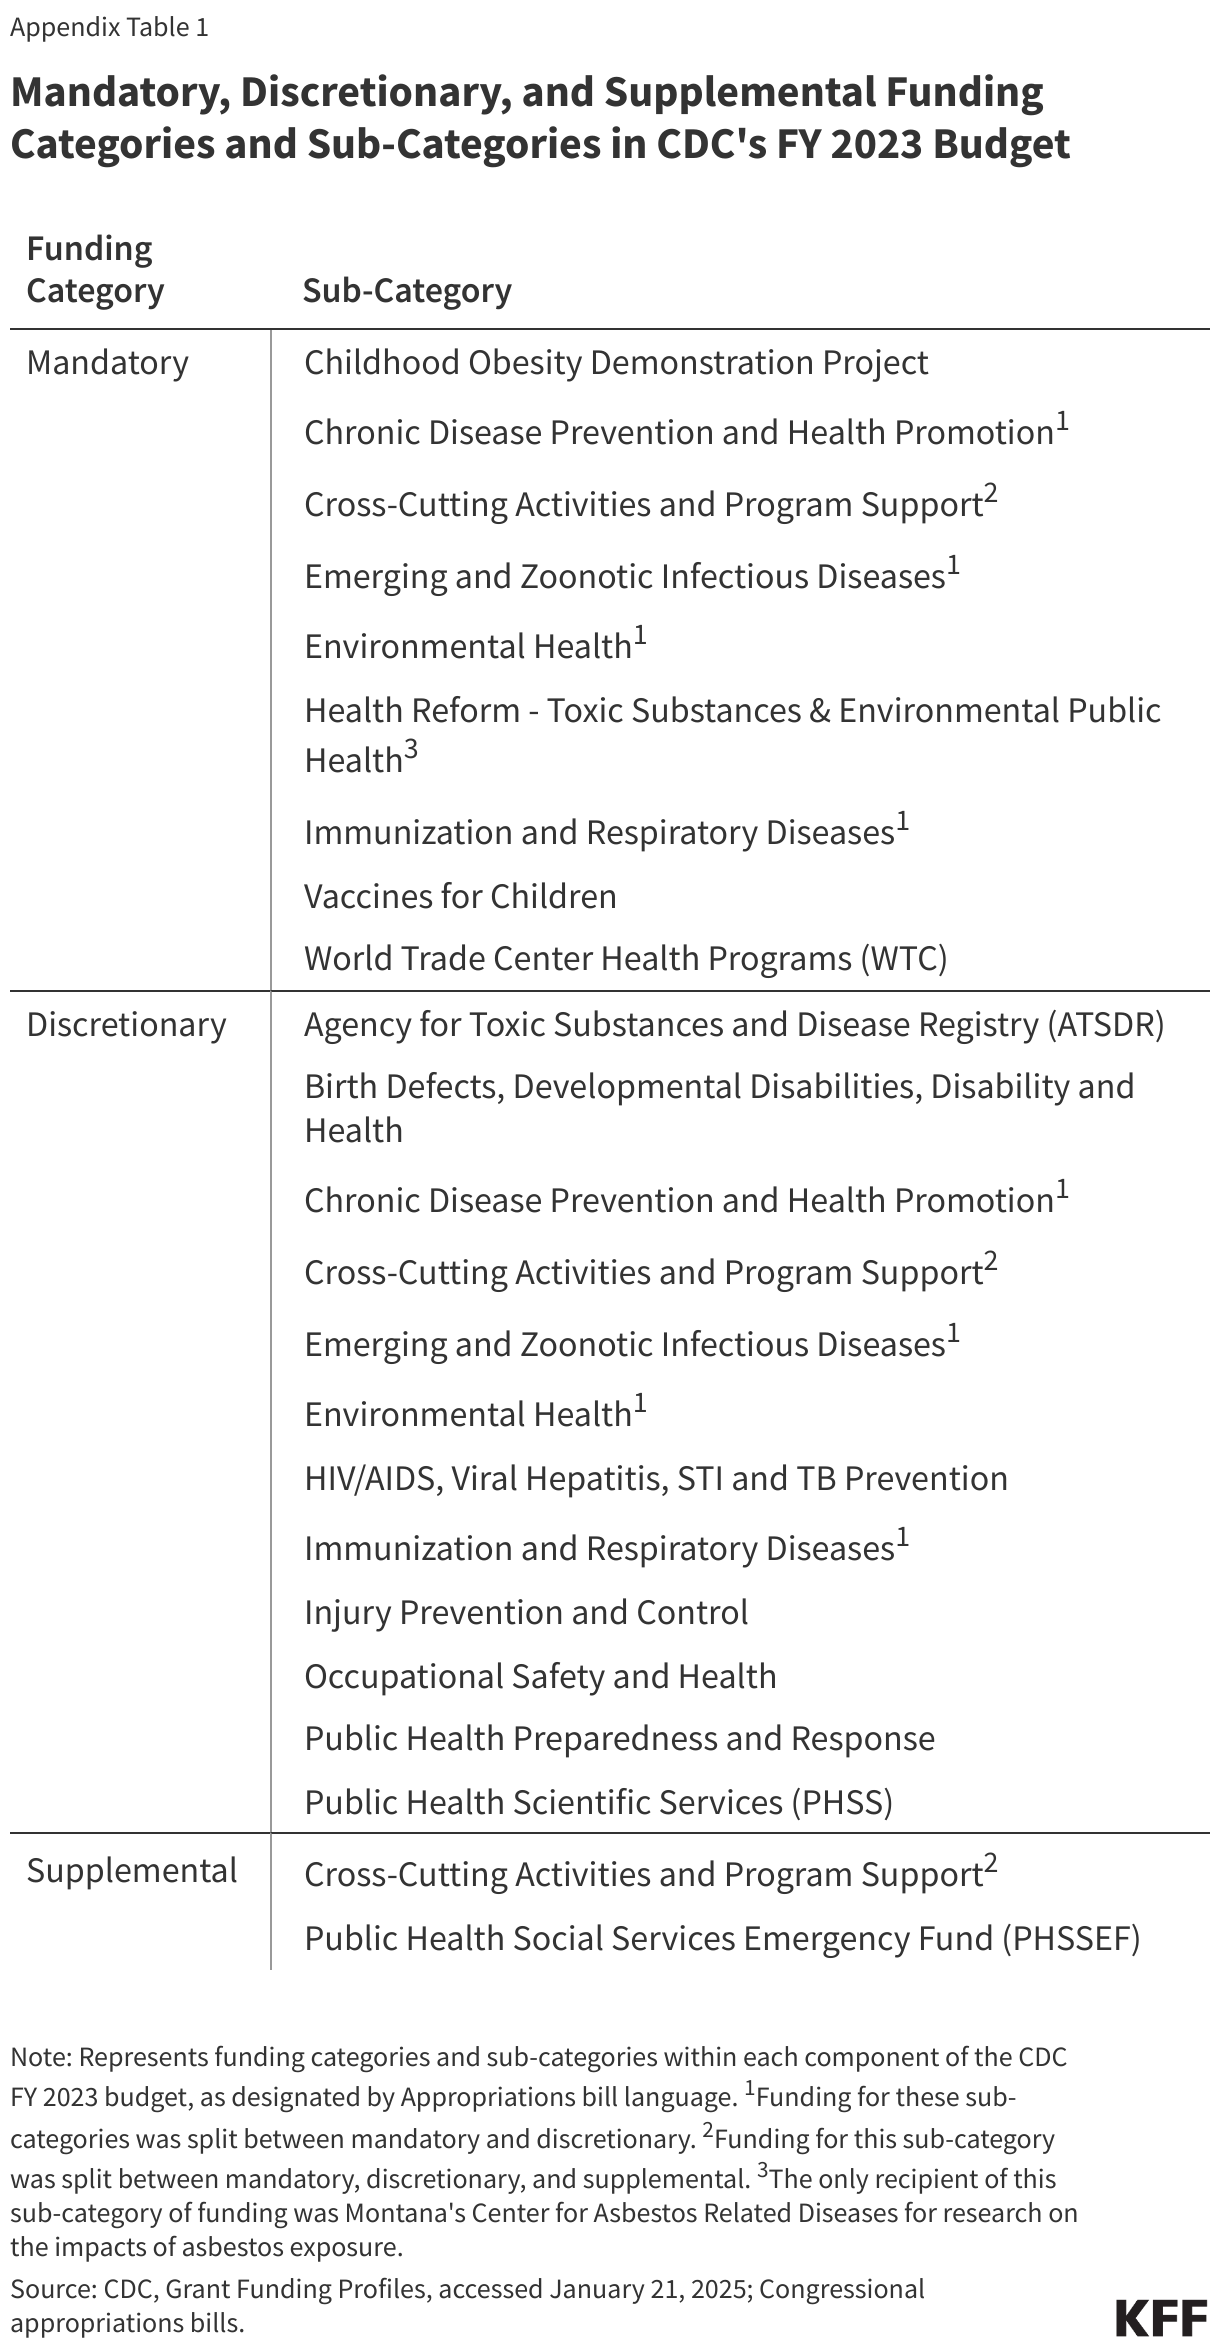
However, CDC does report the amount of funds that it directs to state and local entities, which amounted to $14.9 billion in FY2023. CDC reports this funding by category and sub-category (program areas and activities) In addition, KFF designated these by funding type (discretionary, mandatory, and supplemental), as determined by appropriation bill language; Appendix Table 1 shows these categories and corresponding funding types.
Appendix 2: Additional Charts