Kaiser Family Foundation/CNN Working-Class Whites Poll
Section 2: Race versus Class
The survey reveals some differences between working-class whites and their black and Hispanic counterparts in some experiences and attitudes:
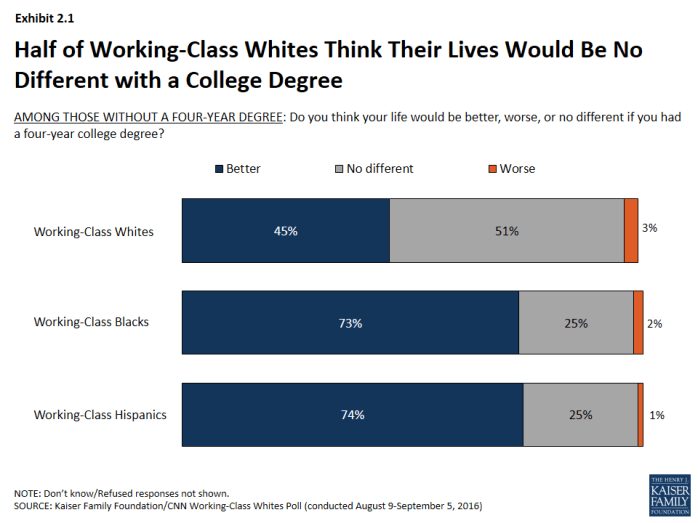
- Compared with working-class blacks and Hispanics, working-class whites are less likely to see their lack of a college degree as a barrier. Half (51 percent) say their life would be no different if they had a 4-year college degree, while about three-quarters of working-class blacks (73 percent) and Hispanics (74 percent) believe having a degree would make their lives better (Exhibit 2.1).
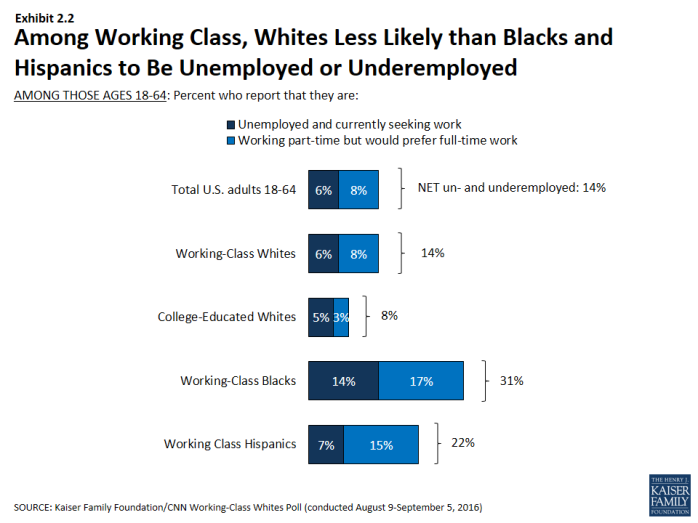
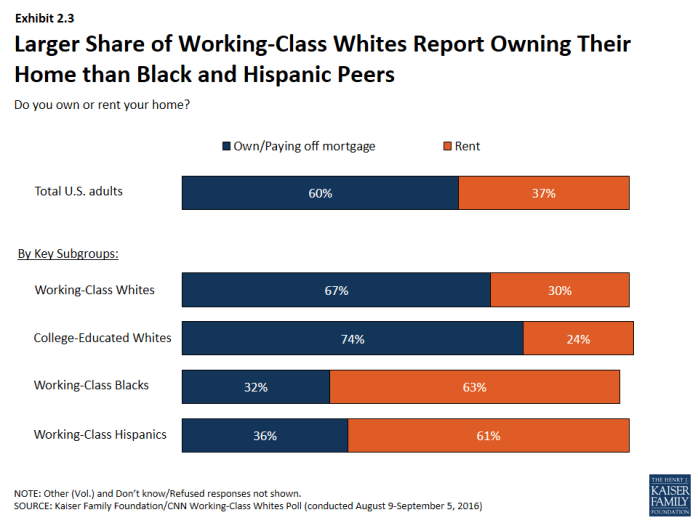
- Whites without college degrees differ from their black and Hispanic counterparts in their employment and housing situations. Among those of working age, just 14 percent of whites without college degrees are un- or under-employed, compared with 31 percent of working-class blacks and 22 percent of working-class Hispanics (Exhibit 2.2). Further, two-thirds (67 percent) of working-class whites say they are homeowners (including those who say they’re paying off a mortgage), about double the 32 percent of working-class blacks and 36 percent of working-class Hispanics who say they own homes (Exhibit 2.3).
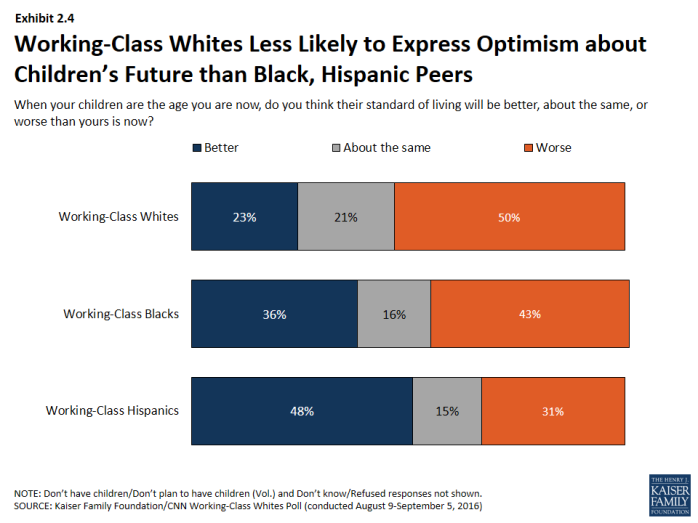
- Whites without college degrees are less optimistic about their children’s future than their black and Hispanic counterparts; 23 percent expect their children to have a better standard of living than their own, compared with 36 percent of working-class blacks and 48 percent of working-class Hispanics (Exhibit 2.4).
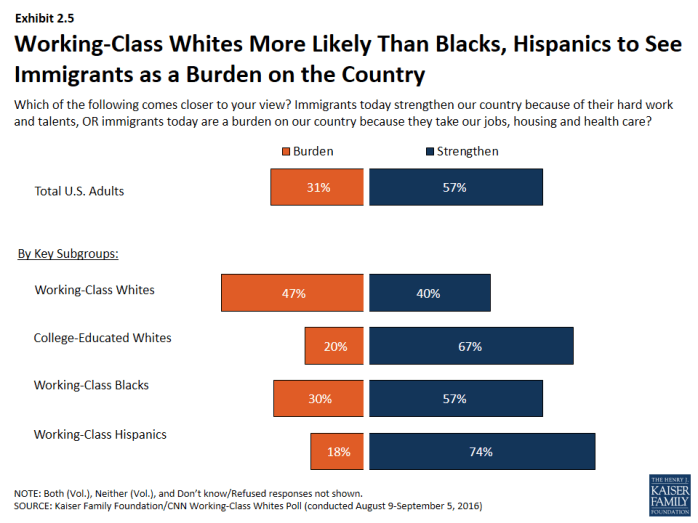
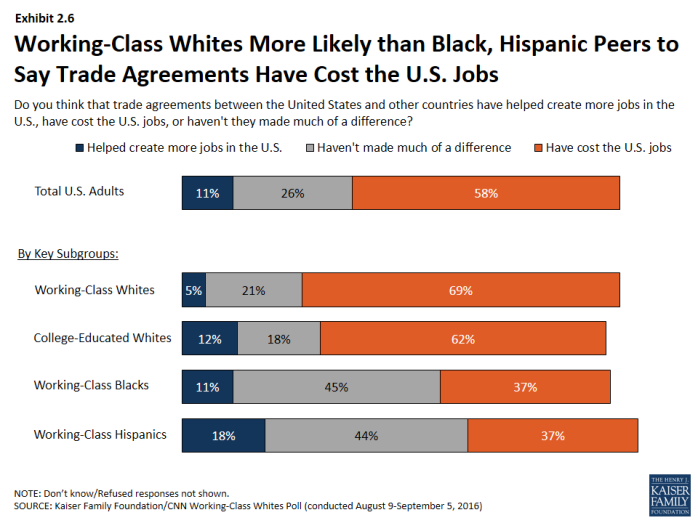
- Attitudes towards immigration and trade differ by race within the working-class. Nearly half (47 percent) of working-class whites see immigrants as a burden on our country, while majorities of working-class blacks (57 percent) and Hispanics (74 percent) say they strengthen the country (Exhibit 2.5). On international trade, working-class whites (69 percent) are almost twice as likely as working-class blacks (37 percent) and Hispanics (37 percent) to think that trade agreements with other countries have cost the U.S. jobs (Exhibit 2.6).
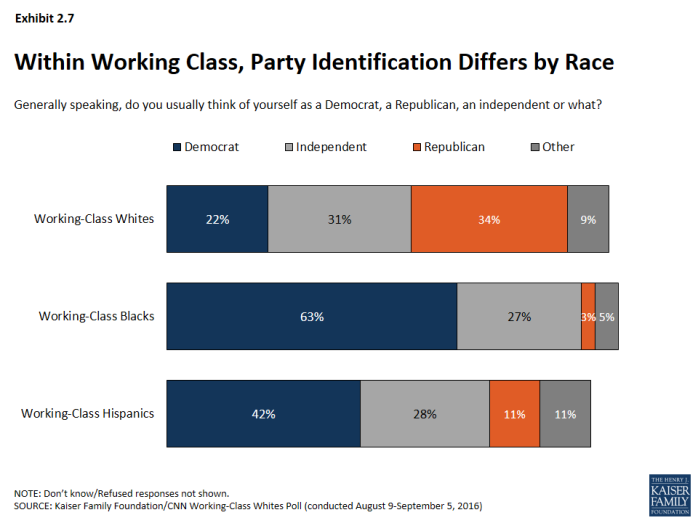
- Some of these differences are driven by partisanship; working-class whites are much more likely than working-class blacks or Hispanics to identify as Republicans (34 percent versus 3 percent and 11 percent, respectively), and much less likely to identify as Democrats (22 percent versus 63 percent and 42 percent) (Exhibit 2.7).
However, it also reveals many ways in which these three groups report similar attitudes and experiences:
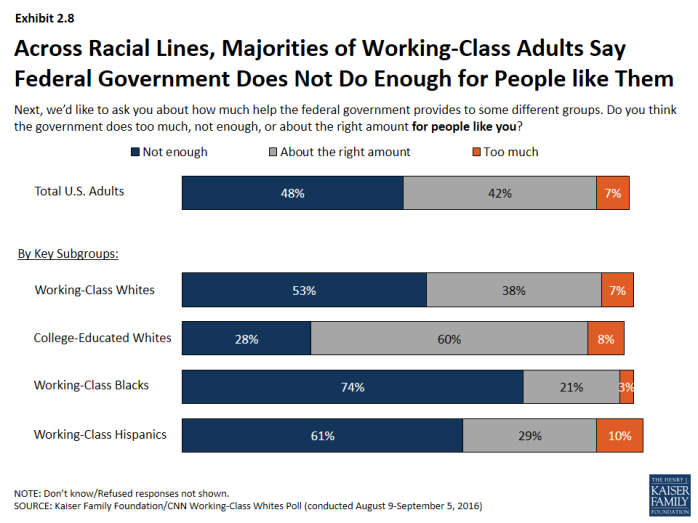
- Majorities of working-class whites (53 percent), blacks (74 percent), and Hispanics (61 percent) say the government doesn’t do enough to help “people like you,” while most college-educated whites (60 percent) say it does about the right amount (Exhibit 2.8).
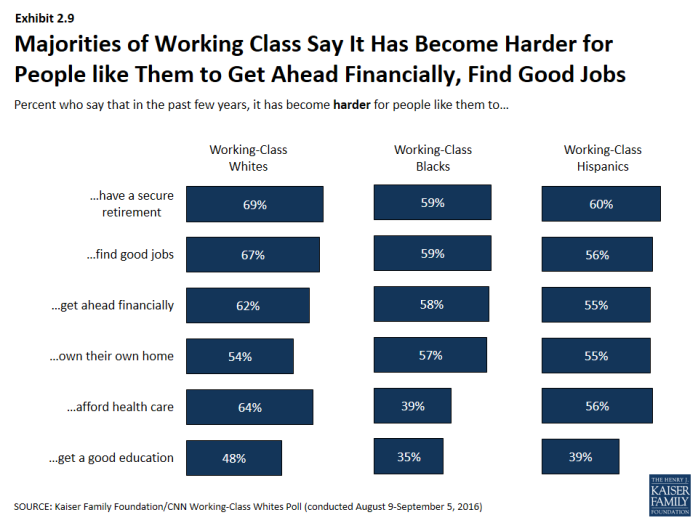
- Majorities of working-class people across racial lines say it’s becoming harder for people like them to get ahead financially, find good jobs, own a home or have a secure retirement (though working-class blacks are less likely than whites to say it’s gotten harder to afford health care or get a good education) (Exhibit 2.9).
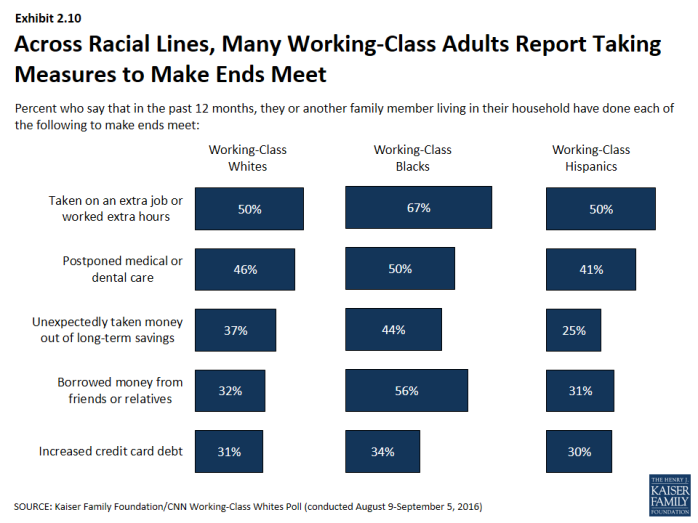
- Many working-class whites, blacks, and Hispanics report making various sacrifices in the past year to make ends meet. About half of whites and Hispanics in this group, and two-thirds of blacks say they’ve taken on an extra job or worked extra hours, and nearly as many say they’ve postponed medical or dental care. About four in ten working-class whites and blacks (along with a quarter of Hispanics) say they’ve unexpectedly taken money out of long-term savings, and about 3 in 10 in each group say they’ve increased their credit card debt. One notable difference: working-class blacks stand out as more likely than either whites or Hispanics in saying that they’ve borrowed money from friends or family in the past year (Exhibit 2.10).
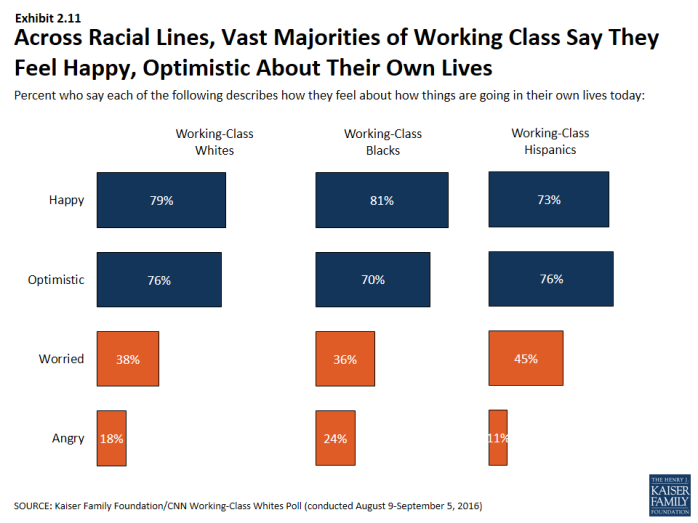
- Still, the vast majority of working-class whites, blacks, and Hispanics, say they feel happy and optimistic about how things are going in their own lives (Exhibit 2.11).
x
Exhibit 2.1
x
Exhibit 2.2
x
Exhibit 2.3
x
Exhibit 2.4
x
Exhibit 2.5
x
Exhibit 2.6
x
Exhibit 2.7
x
Exhibit 2.8
x
Exhibit 2.9
x
Exhibit 2.10
x

