Medicare Advantage 2014 Spotlight: Enrollment Market Update
Specialized Sectors of the Market
Group Enrollment. Most Medicare beneficiaries who enroll in Medicare Advantage plans do so as individuals, but a small share is enrolled through groups. The group market consists largely of employment-sponsored Medicare Advantage plans for retirees. Employers that offer health benefits to Medicare-eligible retirees have the option to contract with Medicare Advantage plans to provide supplemental benefits. Under these arrangements, the employer contracts with the Medicare Advantage insurer to provide its retirees supplemental benefits, and Medicare pays the plan a fixed payment per enrollee to provide Medicare benefits , which is supplemented by an employer plan premium for the additional benefits.1
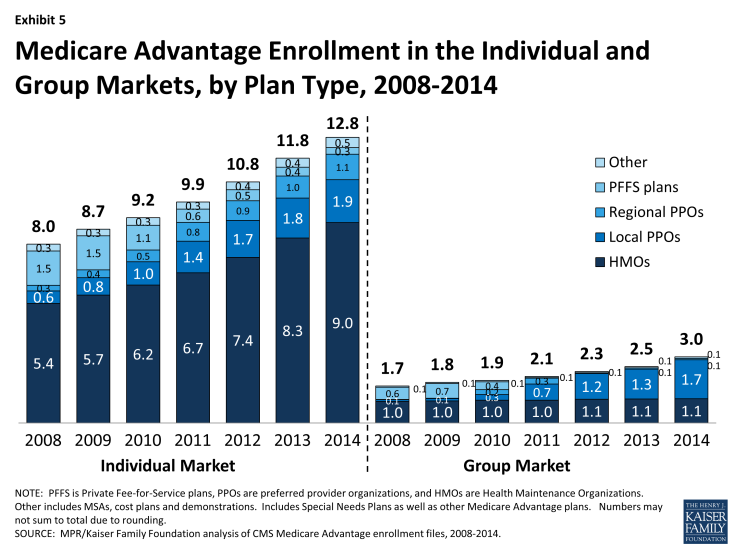
In 2014, 3.0 million of the 15.7 million Medicare Advantage enrollees were in a group plan (Exhibit 5 and Table A2). Of this total, 59 percent were enrolled in local PPOs and 37 percent were enrolled in HMOs. In contrast to the individual market, PPOs account for a larger share of the group market than HMOs. The share of Medicare Advantage enrollees in group plans has never been very large, but the numbers are growing, consistent with trends in the overall Medicare Advantage market. In the recent past, group enrollment in Medicare Advantage has grown proportionately to the growth in the market overall; between 2008 and 2013, the number of group enrollees grew from 1.7 million to 2.5 million, but the relative share in the group market changed little over the time period (17.5% in 2008 versus 17.3% % in 2013). In the past year, group enrollment increased by 17 percent (0.4 million additional enrollees), rising at a faster rate than the 7.9 percent growth rate in the individual market (0.9million additional enrollees). Today, group enrollees account for 19 percent of the total Medicare Advantage population.

Exhibit 5: Medicare Advantage Enrollment in the Individual and Group Markets, by Plan Type, 2008-2014
According to the Medicare Payment Advisory Commission (MedPAC), group Medicare Advantage plans typically receive higher Medicare payments and have higher bids, on average, than plans offered in the individual Medicare Advantage market.2 Their analysis shows that the average payment to group Medicare Advantage plans was 109 percent of traditional Medicare spending whereas the average payment to all Medicare Advantage plans was 106 percent of traditional Medicare spending. MedPAC attributes the differences to incentives for firms in the group market to maximize Medicare revenue to offset employer costs by bidding at the benchmark, whereas firms in the individual Medicare Advantage market have an incentive to bid below the benchmark, in order to receive a rebate (a percent of the difference between the bid and the benchmark) with which they can provide extra benefits to individual plan enrollees. MedPAC has recommended changes in the way payments are made for group plans so that there is greater parity with the individual market.
The influence of employer groups on Medicare Advantage enrollment differs across the country depending on the prevalence of employers offering retiree health benefits, including public and unionized industries.3 States where a substantially larger share of Medicare Advantage enrollees are in group plans include West Virginia (57%), Michigan (49%), Kentucky (42%), Illinois (40%), Ohio (38%), District of Columbia (33%), and New Hampshire (33%). In other states, group enrollment tends to account for less than one-third of total Medicare Advantage enrollment.
Special Needs Plans. Special Needs Plans (SNPs) restrict enrollment to specific types of beneficiaries with significant or relatively specialized care needs, including beneficiaries: (1) dually eligible for Medicare and Medicaid (D-SNPs); (2) requiring a nursing home or institutional level of care (I-SNPs); or (3) with severe chronic or disabling conditions (C-SNPs.)
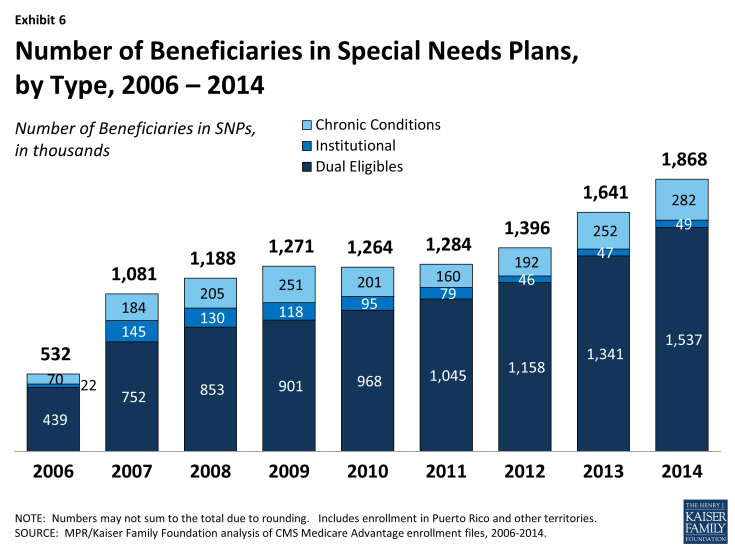
The most SNP enrollees are in HMOs (87%), with 10 percent enrolled regional PPOs and 3 percent in local PPOs. As a share of the total Medicare Advantage population (Exhibit 6 and Table A3), enrollment in SNPs is relatively low. The 1.9 million enrollees in such plans in 2014 account for about 12 percent of total Medicare Advantage enrollment.
Most SNP enrollees (1.5 million or 82%) are in plans serving those dually eligible for Medicare and Medicaid. Such enrollment varies greatly by state, and enrollment of dually eligible beneficiaries in SNPs is particularly prevalent in four states: Hawaii (62%), Arizona (44%), Utah (35%), and Minnesota (30%).
Separately, several states (including CA, MA, MN, NY, IL, OH, SC, VA, and WA) are undertaking demonstrations with CMS to improve the financial alignment of Medicare and Medicaid for dually eligible beneficiaries. In many states, SNPs may continue to operate separately from the demonstration, and dually eligible beneficiaries enrolled in these SNPs can remain in them. It is not clear how the demonstration will affect the growth in D-SNP enrollment over time in these states.

