2016 Survey of Health Insurance Marketplace Assister Programs and Brokers
Section 1: Assister Programs Characteristics and People Helped
In all, more than 5,000 Marketplace Assister Programs provided outreach and enrollment help to consumers during the third Open Enrollment. This total is based on Program data provided by all state and federal Marketplaces, and represents a 9% increase in the number of Programs operating a year ago.
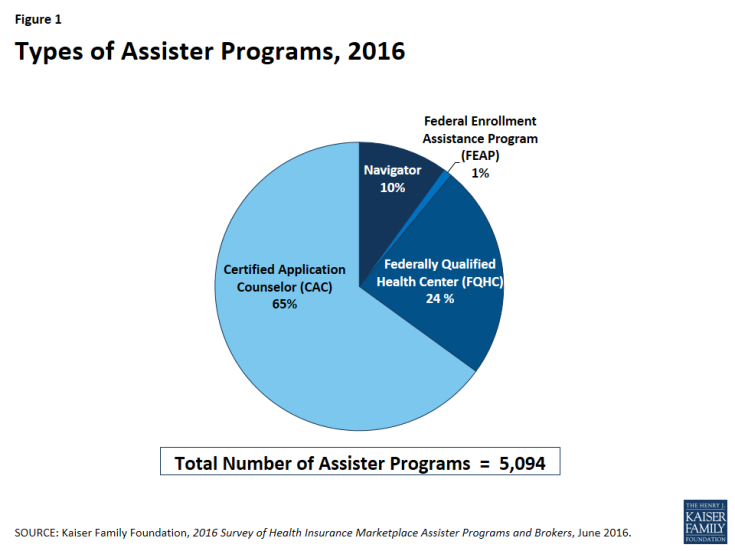
Once again, most Assister Programs that help people enroll through the Marketplace are not funded by Marketplaces. Navigators and FEAPs, which are funded directly by the Marketplace, comprise about 11% of total Programs. Assister Programs in FQHCs, primarily supported by HRSA grants, comprised another 24% and CAC Programs, which generally receive little or no public funding, comprised 65% (Figure 1). The distribution of Assister Program types is similar to that observed last year
An estimated 30,400 Assisters together helped about 5.3 million people during the third Open Enrollment period. The total number of full-time equivalent (FTE) Assisters remained the same this year, and the total number of consumers helped by Assister Programs fell by about 10% compared to last year.
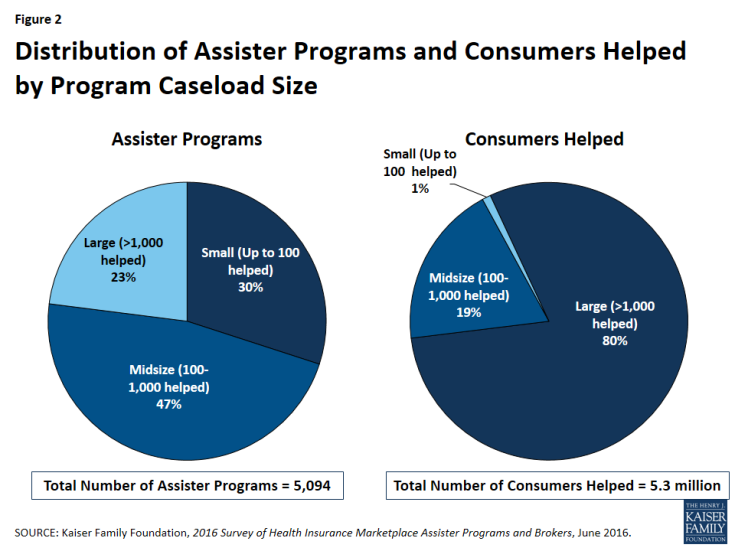
The vast majority of consumers helped (80%) received assistance from Programs that helped more than 1,000 people. These large caseload Programs constituted 23% of all Assister Programs this year. Programs with mid-size caseloads (that helped between 100 and 1,000 consumers) account for 47% of all Programs and helped 19% of all consumers who received assistance. Thirty percent of all Programs had small caseloads, helping 100 or fewer consumers during Open Enrollment; together these small caseload Programs helped just 1% of the total number of consumers who received assistance (Figure 2).
Large caseload Programs include all three types – Navigator, FQHC, and CAC Programs. This year 37% of Navigator, 31% of FQHC, and 16% of CAC Programs said they helped more than 1,000 people during Open Enrollment. All three types of Assister Programs are also found among medium- and small-caseload Programs. Marketplaces only contract with Navigator Programs, however, and so generally do not provide the same level of support and monitoring for most of the large caseload Programs that are responsible for most consumer assistance.
Large caseload Programs had more staff (14.5 FTEs on average) compared to small caseload Programs (average 2.2 FTEs). The average number of consumers helped per FTE was also much greater in large caseload Programs (251) compared to small caseload Programs (16).
In addition, large caseload Programs differed from smaller Programs in the amount and type of work they did and the types of problems they helped consumers address. Large caseload Programs were more likely than small caseload Programs to help consumers with more complex needs such as language translation (28% vs 8%), immigration-related problems (23% vs 5%), problems reporting income or household size (56% vs 35%). In addition, large caseload Programs were more likely to help resolve Marketplace data verification problems (96% vs 81%) and more often could help consumers successfully resolve identity proofing problems (97% vs 89%). Large caseload Programs were also more likely to engage in outreach activities (94% vs. 54%), to help consumers resolve post-enrollment problems (88% vs 53%), and to coordinate with other Assister Programs on enrollment events (39% vs 12%).
Most Assister Programs have now operated for three years. This year 94% of Programs are returning from last year and 87% have been in operation since the first Open Enrollment. Staff tenure is also increasing. Nearly seven in ten three-year-old Programs report that most or all of their staff worked during all three Open Enrollments. More experienced Programs may be more familiar with their Marketplace systems and procedures and may have developed closer ties with communities they serve (Table 1).
Most Assister Programs generally don’t coordinate with each other. Although two-thirds say coordination with other Programs improves effectiveness, most (59%) rarely if ever coordinate with other Programs. Among those that do regularly coordinate with others, 95% said coordination is key to effectiveness. In general, Navigators were more likely to coordinate with other Programs on activities such as planning outreach and enrollment events and resolving complex cases. One-third of small caseload Programs said they never coordinated with others, compared to 10% of large caseload Programs.
| Table 1. Characteristics of Assister Programs | ||||||
| Program Characteristics | All Assister Programs | Program Type | Program Caseload | |||
| Navigator | FQHC | CAC | Large | Small | ||
| Returning Program | 94% | 91%^ | 97% | 94%^ | 99% | 91% Ɨ |
| Worked all three Open Enrollments | 87% | 81^ | 94% | 86%^ | 97% | 78% Ɨ |
| Service area | ||||||
| Statewide | 13% | 22% | 12%* | 11%* | 15% | 12% |
| Specific area within state | 81% | 73% | 86%* | 81%* | 79% | 82% |
| Other | 6% | 5% | 3% | 7%^ | 5% | 6% |
| Paid staff vs. volunteer | ||||||
| Most/all volunteers | 10% | 6% | 4% | 13% | 4% | 17% Ɨ |
| Most/all paid staff | 88% | 94% | 96% | 84%*^ | 96% | 80% Ɨ |
| Number of full-time-equivalent staff and volunteers | ||||||
| 5 or fewer | 77% | 64% | 78%* | 79%* | 41% | 94% Ɨ |
| 6-10 | 13% | 16% | 16% | 11%*^ | 29% | 3% Ɨ |
| 11-20 | 5% | 11% | 3%* | 5%^ | 16% | 1% Ɨ |
| 21-50 | 3% | 6% | 1%* | 3%*^ | 8% | 1% Ɨ |
| More than 50 | 1% | 3% | 1% | 1% | 6% | – Ɨ |
| Don’t know/No answer | 1% | – | 2% | 1% | – | 1% |
| Mean FTE staff size | 5.9 | 9.5 | 4.3* | 5.9 | 14.5 | 2.2Ɨ |
| Number of consumers helped during Open Enrollment | ||||||
| 100 or fewer | 32% | 12% | 14% | 41%*^ | – | 100 Ɨ |
| 101-500 | 30% | 31% | 39% | 26%^ | – | – |
| 501-1,000 | 14% | 19% | 16% | 12% | – | – |
| 1,001-2,500 | 14% | 20% | 18% | 12% | 66% | – Ɨ |
| 2,501-5,000 | 4% | 7% | 8% | 2%*^ | 18% | – Ɨ |
| More than 5,000 | 3% | 10% | 5% | 2%* | 16% | – Ɨ |
| Don’t know/No answer | 3% | 1% | 1% | 4% | – | – |
| Mean number helped per Program | 1,026 | 1,766 | 1,160 | 852*^ | 3,657 | 35 Ɨ |
| Coordinate often with other Programs to: | ||||||
| Share staff | 16% | 24% | 15%* | 15%* | 24% | 12% Ɨ |
| Share appointment scheduler | 15% | 57% | 16%* | 15%* | 23% | 8% Ɨ |
| Plan enrollment events | 24% | 35% | 24%* | 22%* | 39% | 12% Ɨ |
| Plan outreach events | 24% | 36% | 24%* | 23%* | 38% | 12% Ɨ |
| Resolve complex cases | 22% | 31% | 21%* | 20%* | 31% | 14% Ɨ |
| Portion of Consumers helped who were new to Marketplace vs. renewing | ||||||
| Most/nearly all renewing or changing | 39% | 36% | 42% | 39% | 42% | 37% |
| Half new/half renewing or changing | 24% | 29% | 26% | 22% | 31% | 17% Ɨ |
| Most/nearly all new to Marketplace | 29% | 29% | 24% | 31% | 20% | 40% Ɨ |
| *Significantly different from Navigator at the 95% confidence level; ^Significantly different from FQHC at the 95% confidence level; Ɨ Significantly different from Large Caseload Program at the 95% confidence level NOTE: Numbers may not sum to 100% due to rounding. |
||||||
Assister Program budgets are mostly modest. Twenty seven percent of all Programs reported having an annual budget for consumer assistance of $50,000 or less. Twenty-nine percent had annual budgets between $50,000 and $500,000. Only 5% of Programs reported annual budgets larger than $500,000. CACs tended to have the smallest budgets (Table 2).
Navigators were more likely to receive most of their funding from the Marketplace, while FQHCs relied more heavily on grants from HRSA. CACs were most likely to rely on re-programmed resources from their sponsoring organization or other private sector support.
|
Table 2. Assister Program Budgets and Sources of Funding, FY 2016 |
||||||
|
All Assister Programs |
Program Type |
Program Type |
Program Type |
Program Size |
Program Size |
|
|
Navigator |
Navigator |
FQHC |
CAC |
Large Caseload |
Small Caseload |
|
|
FY 2016 Program budget |
||||||
|
Up to $50,000 |
27% |
19% |
14% |
34%*^ |
3% |
47% Ɨ |
|
$50,001 – $200,000 |
22% |
30% |
33% |
17%*^ |
32% |
7% Ɨ |
|
$200,001 – $500,000 |
7% |
20% |
10%* |
4%*^ |
20% |
1% Ɨ |
|
$500,001 – $1,000,000 |
3% |
6% |
4% |
3% |
12% |
1% Ɨ |
|
More than $1,000,000 |
2% |
5% |
1%* |
1%* |
6% |
– Ɨ |
|
Don’t know/No answer |
39% |
20% |
39% |
41% |
27% |
44% |
|
Programs receiving most (>50%) of budget from this funding source |
||||||
|
Grants or other direct payment from Marketplace |
9% |
39% |
3%* |
5%* |
15% |
4% Ɨ |
|
Grants from HRSA, other federal agency |
19% |
7% |
36%* |
15%*^ |
38% |
9% Ɨ |
|
Grants or payments from other state agencies |
6% |
9% |
1%* |
7%^ |
6% |
5% |
|
Grants from private foundations |
4% |
1% |
1% |
5%*^ |
2% |
3% |
|
Grants from other outside private sources |
1% |
1% |
1% |
2% |
1% |
2% |
|
Funds re-programmed from sponsoring organization’s own budget |
15% |
4% |
2% |
22%*^ |
5% |
24% Ɨ |
|
*Significantly different from Navigator at the 95% confidence level; ^Significantly different from FQHC at the 95% confidence level; Ɨ Significantly different from Large Caseload Programs at the 95% confidence level. |
||||||


