Medicare Part D in 2016 and Trends over Time
Since 2006, Medicare beneficiaries have had access to prescription drug coverage offered by private plans, either stand-alone prescription drug plans (PDPs) or Medicare Advantage drug plans (MA-PD plans). Medicare drug plans (also referred to as Part D plans) receive payments from the government to provide Medicare-subsidized drug coverage to enrolled beneficiaries, who pay a monthly premium that varies by plan. The law that established Part D defined a standard drug benefit, but nearly all Part D plan sponsors offer plans with alternative designs that are equal in value, and plans may also offer an enhanced benefit. Part D plans also must meet certain other requirements, but vary in terms of premiums, benefit design, gap coverage, formularies, and pharmacy networks.
This chart collection presents findings on the Medicare Part D marketplace in 2016 and trends since 2006:
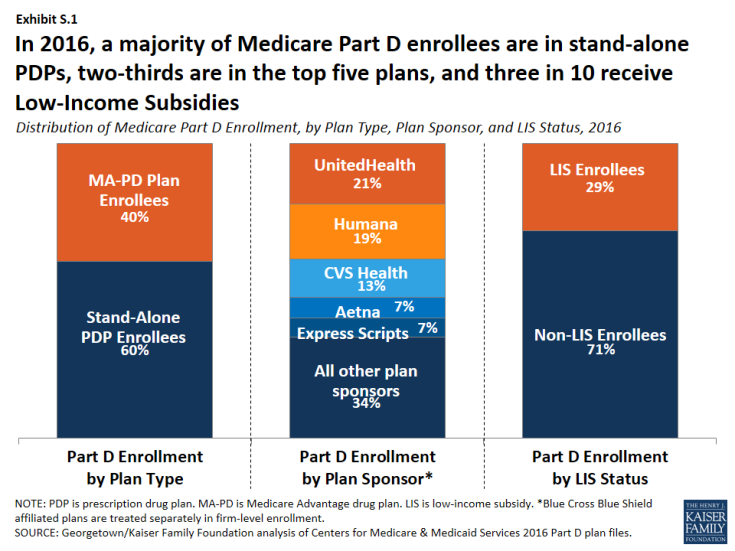
- Nearly 41 million of the 57 million people on Medicare (71 percent) are enrolled in a Part D plan in 2016; most (60 percent) are in PDPs, but a rising share (40 percent in 2016, up from 28 percent in 2006) are in MA-PD plans (Exhibit S.1). More than half of Part D enrollees are in enhanced plans.
- Nearly three in 10 Part D enrollees (29 percent, or about 12 million enrollees) are receiving extra help through the Part D Low-Income Subsidy (LIS) program that pays their drug plan premiums (if they enroll in a benchmark plan) and reduces their cost sharing.
- Three firms—UnitedHealth, Humana, and CVS Health—account for over half (53 percent) of all Part D enrollment in 2016; if the Humana-Aetna merger goes through, the combined firm would account for 26 percent of Part D enrollment nationwide, without divestitures.
- After several years of relatively low growth, average monthly PDP premiums increased by 6 percent in 2016 to $39.21 per month. However, monthly premiums for two of the most popular PDPs (AARP Rx Preferred and Humana Enhanced) increased by more than 20 percent in 2016. Premiums vary widely across regions and across plans, even among those of the same benefit type (basic or enhanced).
- The average Medicare beneficiary has a choice of 26 PDPs and 16 MA-PD plans in 2016; by contrast, the average Part D enrollee receiving the LIS has a choice of seven premium-free benchmark PDPs, fewer than in any year since 2006.
- One in eight Part D enrollees who receive the LIS—1.5 million beneficiaries—pay a monthly premium for Part D coverage, averaging $21 per month, even though premium-free PDPs are available in all regions; 45 percent of these 1.5 million enrollees pay $20 or more per month.
- Almost all Part D enrollees are in plans with five cost-sharing tiers: two generic tiers, two brand tiers, and a specialty tier. PDPs typically charge coinsurance rather than copayments for brand-name drugs, and the use of tiered pharmacy networks is now the norm in PDPs. These trends have cost implications for beneficiaries, with greater unpredictably in out-of-pocket costs associated with coinsurance rates, but also the potential for savings if beneficiaries use drugs on preferred tiers or obtained from preferred cost-sharing pharmacies.

