Sizing Up Exchange Market Competition
The individual health insurance market historically has been highly concentrated, with only modest competition in most states. At the time the Affordable Care Act (ACA) was signed into law in 2010, a single insurer had at least half of the individual market in 30 states and the District of Columbia. While a dominant insurer may be able to negotiate lower rates from hospitals and physicians, without significant competitors or regulatory oversight, there is no guarantee that those savings would be passed along to consumers.1
Health insurance exchanges (also called marketplaces) are intended to promote price competition in the individual and small group insurance markets through greater transparency. Tax credits to reduce the cost of premiums, and in some cases out-of-pocket costs, encourage consumers to enroll through an exchange, which in turn gives insurers an incentive to participate in the new markets. Unlike the pre-ACA market, benefits are generally comprehensive and largely uniform, with cost-sharing presented in standardized tiers. With medical underwriting prohibited, premiums are easy to compare, focusing competition on price. Beyond exchanges, several other aspects of the ACA are intended to mitigate potential adverse effects of uncompetitive markets. For example, the ACA’s rate review provision requires scrutiny of large premium increases. The Medical Loss Ratio rule also ensures that plans experiencing a windfall from lower-than-expected health care expenses pass at least some of that back to consumers in the form of rebates.
Preliminary exchange enrollment data released by seven states provides an opportunity to look at how competition may be changing in the individual market. To do this, we compared early enrollment across insurers in these exchanges to market share statistics from each state’s 2012 individual market prior to full ACA implementation. While the early exchange enrollment results provide only a partial picture of state markets – they do not include coverage sold outside state exchanges or enrollees covered in grandfathered plans — seeing reduced market concentration within an exchange may well be a signal that the market overall is becoming more competitive, or vice versa. Over time, the availability of premium tax credits, which are only available inside exchanges, should greatly increase the number of individual market participants in state markets. If these new avenues for enrollment are more or less competitive, the overall markets are likely to be as well.
Analysis of the early results suggests a diversity of results across states. On one hand, two large states, California and New York, appear to be noticeably more competitive than their 2012 individual markets as a whole. On the other hand, exchanges in Connecticut (where two major insurers decided not to participate in the exchange) and Washington appear to be less competitive than their individual markets were in 2012. In some cases, market share among insurers has shifted significantly under the ACA, including some notable examples of new entrants picking up substantial enrollment. Full results for the seven states with available data are detailed below.
Measuring Insurance Market Competition
There are several ways to measure insurance market competition. Most analyses of exchange markets thus far have focused on the number of insurers participating in the marketplaces or whether there are any new entrants to the market. By these measures, exchange markets in most states are comprised of several insurers from which consumers can choose. While not all insurers that previously offered coverage in the individual market are participating in exchanges, new Consumer Operated and Oriented Plans (“CO-OPs”) are being offered in 23 states, as well as other insurers that previously offered Medicaid HMOs and are new to the individual market. Half of states have 4 or more insurers participating in their exchanges, and a dozen states have ten or more insurers offering. Some areas of the country, particularly in the rural south, only have a single insurer offering exchange coverage. This is the case in West Virginia, much of Alabama, and some parts of North Carolina, Florida, Mississippi and Arkansas. New Hampshire and parts of Wisconsin also have just one insurer offering exchange coverage.2 Exchange insurers offer multiple plans at various metal levels, so people living in areas with just one insurer still have some amount of choice in the products they purchase but are not necessarily benefiting from competitive market dynamics.
The number of insurers and new entrants tells us something about consumer choice, but choice does not always equate to competition. For example, a market may have several insurers participating, but if one large insurer controls the vast majority of the market, the market would still generally be considered uncompetitive. With plan-level enrollment numbers coming in from a handful of states, we are now able to see not only how many insurers are offering in these markets, but also how actual market share is distributed.
To look more closely at the concentration of actual enrollment, we examined three additional indicators of market competition:
- The market’s Herfindahl–Hirschman Index (HHI)
- The market share of the largest insurer
- The number of insurers with greater than 5% market share
The Herfindahl-Hirschman Index is a measure of how evenly market share is distributed across insurers in the market.3 HHI values range from 0 to 10,000, with an HHI closer to zero indicating a more competitive market and closer to 10,000 indicating a less competitive market. An HHI index below 1,000 generally indicates a highly competitive market; an HHI between 1,000 and 1,500 indicates an unconcentrated market; a score between 1,500 and 2,500 indicates moderate concentration; and a value above 2,500 indicates a highly concentrated (uncompetitive) market.
Another way to measure market competition is by simply looking at the share of the market held by the largest insurer. An insurer that controls a significant portion of the market may be able to leverage that market share to charge higher premiums (or negotiate lower rates from providers).
Finally, the number of insurers with at least 5% market share is a measure of the degree of choice consumers have. As opposed to simply looking at the total number of insurers participating in a market, setting a threshold (in this case 5% market share) gives an idea of which insurers have sufficient enrollment to potentially grow in the future. For more discussion on these measures of competition, see our October 2011 brief.
Market Competition in Seven State Exchanges
As of the publication of this brief, seven states (California, Connecticut, Minnesota, Nevada, New York, Rhode Island, and Washington) had released marketplace enrollment numbers by insurer. As noted above, we compared enrollment statistics in each of these seven states to enrollment data in the state’s individual market in 2012, which is made publicly available by the Department of Health and Human Services under the Affordable Care Act’s Medical Loss Ratio provision.
The exchange markets in these seven states are not necessarily representative of the markets in the remaining 44 states. Each of these seven states is running its own exchange, rather than partnering with the federal government or defaulting to a federally facilitated exchange, and subsequently had significantly more funds available for outreach and marketing. All but Minnesota and Nevada are currently in the top ten states leading the nation in marketplace enrollment as a percent of the number of potential marketplace enrollees.
Additionally, the market indicators we examined reflect competition at the state level, not the local level, where competition among insurers truly takes place. Premiums in most states are also set at the local area (by rating areas, which are typically groups of neighboring counties). With the exception of California, states have not released regional exchange plan enrollment data, making a systematic comparison of premiums and market competition difficult in most states. When possible, though, we note whether an insurer that priced relatively low in the majority of the state was able to pick up market share.
California
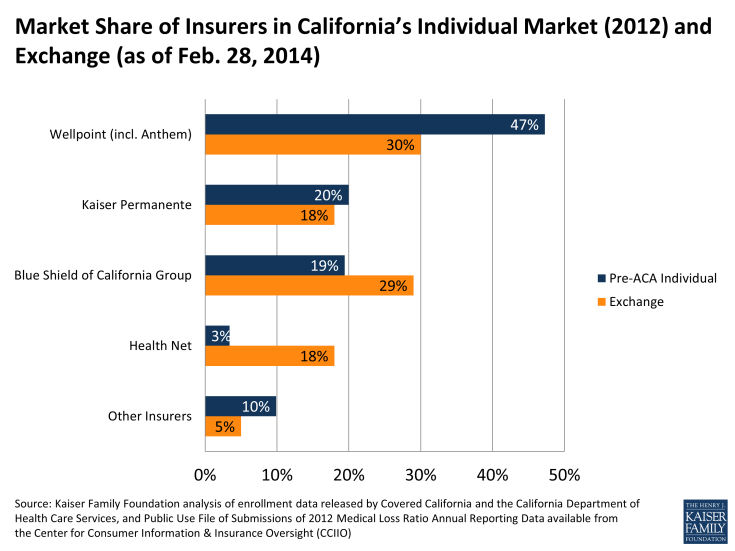
The California exchange market is shaping up to be more competitive than its 2012 individual market. All three indicators (HHI, market share of largest insurer, and number of insurers with greater than 5% market share) point to increased competition. California’s individual market was highly concentrated in 2012, but the exchange market has only moderate concentration.
|
California Insurance Market Competition |
|||
|
Market |
Herfindahl-Hirschman Index (HHI) |
% Market Share of Largest Company |
Number of Companies over 5% Market Share |
|
2012 Individual Market |
3,052 (Highly Concentrated) |
47% |
3 |
|
2014 Exchange Market |
2,418 (Moderately Concentrated) |
30% |
4 |
|
How Competitive is Exchange? |
More Competitive |
More Competitive |
More Competitive |
|
Source: Kaiser Family Foundation. |
|||
There are eleven insurers participating in California’s exchange throughout the state, including eight plans that previously made up 90% of the 2012 individual market. Four new plans (L.A. Care Health Plan, Molina Healthcare, Western Health Advantage, and Valley Health Plan) are also being offered, but together only make up 5% of the exchange’s market. Not all plans are available in all areas of the state.
Wellpoint, the parent company of Anthem Blue Cross of California and the state’s largest individual market insurer, has significantly less market share in the exchange than it did in the 2012 individual market (30% vs. 47%). Blue Shield of California picked up substantial market share, most likely because it was able to offer the lowest premiums in several parts of the state.
Health Net, previously holding only 3% of the market, now has 18% market share in the exchange. This insurer has the lowest premiums in much of Southern California, where it is also leading enrollment.
Connecticut
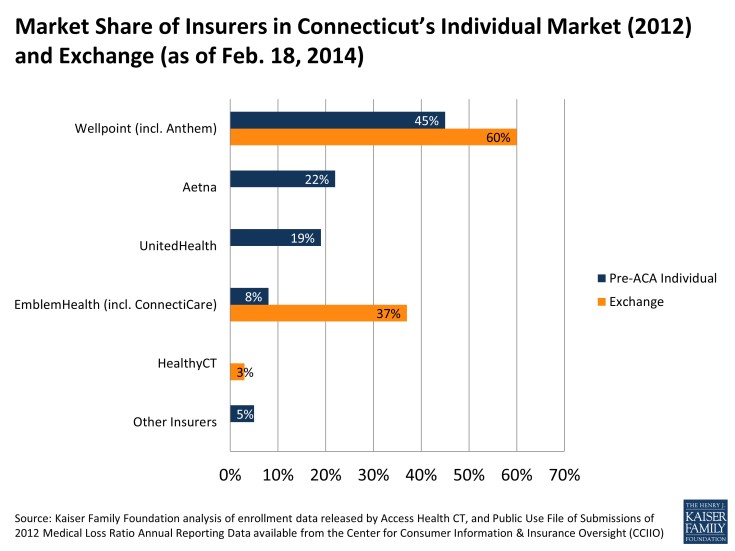
In Connecticut the exchange market looks to be significantly less competitive than its 2012 individual market. All three market indicators (HHI, market share of largest insurer, and number of insurers with greater than 5% market share) point to less competition in the exchange compared to the individual market in 2012.
Connecticut’s exchange has just 3 insurers participating. Although five initially indicated they would participate in the state’s exchange, Aetna and UnitedHealth subsequently pulled out. Cigna, a sizable insurer in the state’s group markets, also decided against participating in the state’s exchange.
|
Connecticut Insurance Market Competition |
|||
|
Market |
Herfindahl-Hirschman Index (HHI) |
% Market Share of Largest Company |
Number of Companies over 5% Market Share |
|
2012 Individual Market |
2,962 (Highly Concentrated) |
45% |
4 |
|
2014 Exchange Market |
4,978 (Highly Concentrated) |
60% |
2 |
|
How Competitive is Exchange? |
Less Competitive |
Less Competitive |
Less Competitive |
|
Source: Kaiser Family Foundation. |
|||
Two of the three exchange insurers, Wellpoint (Anthem) and EmblemHealth (ConnectiCare), together made up just over half (54%) of the individual market in 2012, and now control 97% of the exchange market. The other 2% of the market is HealthyCT, a new entrant. HealthyCT is a CO-OP plan formed in late 2011 that uses a patient-centered medical home model.
Despite a less competitive exchange market and higher than average premiums, Connecticut has been very successful in enrolling consumers. Exceeding the state’s own expectations, it is currently ranked second in the nation of states that have enrolled the largest portion of their potential exchange enrollees (Vermont is currently number 1). Connecticut’s success could be attributed in part to its usage of Apple-inspired storefronts in enrolling residents through the exchange. Designed to simplify the complexities of health insurance, these retail-like stores are staffed with enrollment counselors and brokers who walk consumers through the enrollment process.
In an effort to encourage more insurers to participate in the first years of the exchange, Connecticut offered a form of market exclusivity to those insurers agreeing to offer coverage in 2014. Insurers that decided not to participate in 2014 are barred from entering for at least 2 more years. While it is not known how heavily this policy factored into insurer’s decisions to enter the exchange market in 2014, it is notable that California and New York instituted similar policies and were able to achieve more competitive exchange markets.
Minnesota
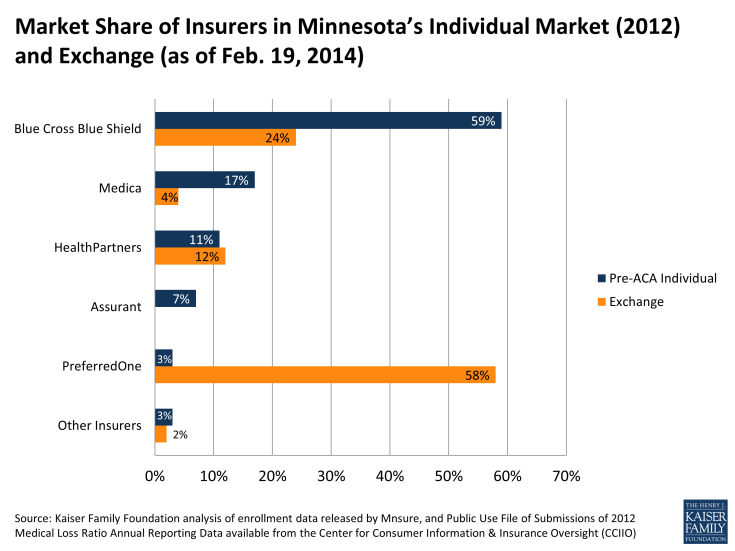
Looking only at the competition indicators, Minnesota’s exchange market closely resembles its 2012 individual market. The state’s HHI (3,999 vs. 4,104) and the largest insurer’s market share (59% vs. 58%) appear to be relatively unchanged from 2012. While the indicators are comparable in the exchange and the 2012 individual market, the insurer leading enrollment in the exchange was actually a very small player in Minnesota’s individual market in 2012.
|
Minnesota Insurance Market Competition |
|||
|
Market |
Herfindahl-Hirschman Index (HHI) |
% Market Share of Largest Company |
Number of Companies over 5% Market Share |
|
2012 Individual Market |
3,999 (Highly Concentrated) |
59% |
4 |
|
2014 Exchange Market |
4,104 (Highly Concentrated) |
58% |
3 |
|
How Competitive is Exchange? |
Similar |
Similar |
Less Competitive |
|
Source: Kaiser Family Foundation. |
|||
With some of the lowest exchange premiums in the country, PreferredOne was able to seize a significant portion of the exchange market and has clearly had a noticeable effect on the competitive landscape in the state. PreferredOne currently controls more than half (58%) of the exchange market, whereas it held just 3% of the 2012 individual market. In the Minneapolis region, PreferredOne is able to offer the least expensive silver plan in part by offering a narrow network version of its other plans. As part of PreferredOne’s “Select” network, these plans only contracts with 17 hospitals in the state, compared to its broader “Choice” network, which contracts with 136 hospitals in the state. The Select network comes with lower monthly premiums: a 40 year-old enrolling in an Accent Select silver plan would pay $154 per month, compared to $172 per month for a broader network Accent Choice silver plan.
PreferredOne has significantly outpaced the previously dominant insurer in the state, Blue Cross Blue Shield. Controlling 59% of the individual market in 2012, Blue Cross Blue Shield (which priced significantly higher than PreferredOne) only has 24% market share in the exchange. Because of these significant market share shifts in the exchange, it’s possible that a different picture of the competitiveness of Minnesota’s individual market will emerge once information on enrollment outside the exchange becomes available.
Combined, four companies – PreferredOne, Blue Cross Blue Shield, HealthPartners, and Medica – have enrolled 98% of the exchange market. (In 2012, these insurers accounted for 90% of the total market share.) UCare, a nonprofit health plan that previously served Medicare and Medicaid enrollees and is a new entrant in the individual market, comprises 2% market share in the exchange.
Nevada
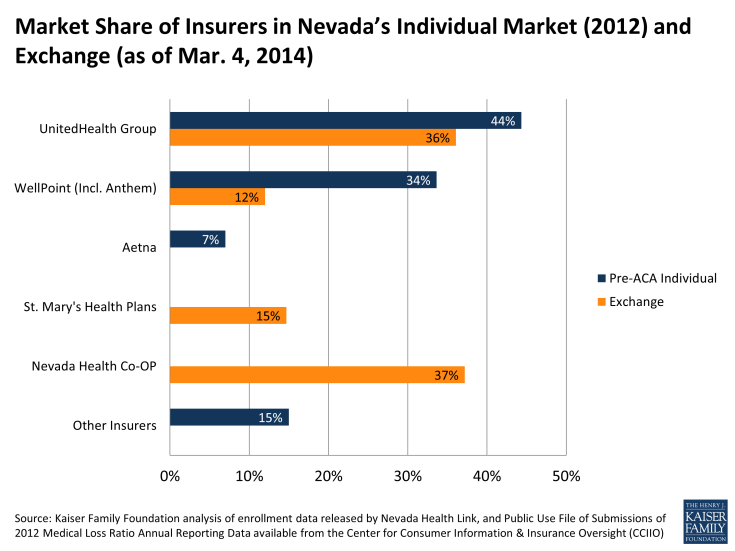
Nevada’s exchange is moderately more competitive than the state’s pre-ACA individual market was overall. While the exchange HHI score is roughly unchanged, the market share held by the largest insurer decreased somewhat (from 44% to 37%) and the number of insurers with more than 5% market share also increased (from 3 to 4 insurers).
|
Nevada Insurance Market Competition |
|||
|
Market |
Herfindahl-Hirschman Index (HHI) |
% Market Share of Largest Company |
Number of Companies over 5% Market Share |
|
2012 Individual Market |
3,198 (Highly Concentrated) |
44% |
3 |
|
2014 Exchange Market |
3,049 (Highly Concentrated) |
37% |
4 |
|
How Competitive is Exchange? |
Similar |
More Competitive |
More Competitive |
|
Source: Kaiser Family Foundation. |
|||
In Nevada, two companies (UnitedHealth and Wellpoint) currently make up 48% of exchange market enrollment. These two insurers previously held 78% of the 2012 individual enrollment, but have lost significant market share to a new entrant.
Leading enrollment in the Nevada exchange is a new insurance company called Nevada Health CO-OP. With 37% of the exchange market, Nevada Health is the only CO-OP plan to have gained significant enrollment in the seven states with available data. Another prominent new player on the exchange market is St. Mary’s Health Plans, which holds 15% of market share. Prior to its participation on the exchange, the health plan only offered coverage in the small group and large group markets.
New York
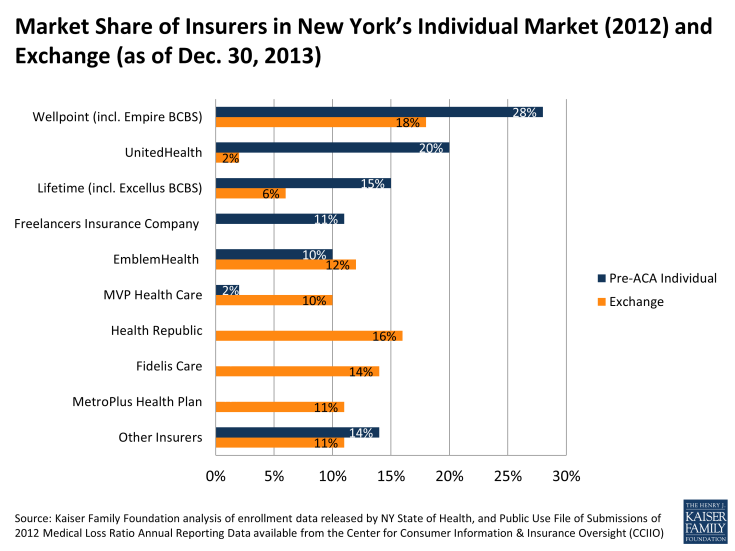
Of the seven states, New York’s exchange market is the most competitive and is also more competitive than its pre-ACA individual market as a whole. The state’s individual market was moderately concentrated, but its exchange market is now considered unconcentrated (with an HHI of less than 1,500).
|
New York Insurance Market Competition |
|||
|
Market |
Herfindahl-Hirschman Index (HHI) |
% Market Share of Largest Company |
Number of Companies over 5% Market Share |
|
2012 Individual Market |
1,641 (Moderately Concentrated) |
28% |
5 |
|
2014 Exchange Market |
1,197 (Unconcentrated) |
18% |
7 |
|
How Competitive is Exchange? |
More Competitive |
More Competitive |
More Competitive |
|
Source: Kaiser Family Foundation. |
|||
New York’s exchange acts as an active purchaser, meaning the state selectively contracts with plans, rather than allowing any qualified insurer to participate. Even so, the state has 16 parent companies offering plans in the exchange in various parts of the state, 7 of which hold market shares greater than five percent.
Ten of these companies offered coverage to New Yorkers purchasing their own insurance before the ACA. All together these ten companies enrolled 81% of the individual market in 2012, and now make up just over 54% of exchange enrollment. New York’s exchange introduced six new insurers to the individual market that combined hold 45% of the exchange market. The largest new entrant to New York’s market is Health Republic, a CO-OP plan that originally received sponsorship from Freelancers Union but is now licensed as an independent company. Other sizable new entrants are Fidelis Care and MetroPlus Health Plan, both of which served Medicaid beneficiaries before the ACA.
While New York’s largest individual market insurer, Wellpoint Inc. (which includes Empire Blue Cross Blue Shield), controlled 28% of the 2012 individual market, it now holds only 18% of the exchange market. Several smaller insurers have picked up market share. MVP Health Care, for example, held a mere 2% of the individual market in 2012, but now has about 10% of the exchange market.
UnitedHealth previously held a substantial portion (20%) of the 2012 individual market. Currently the insurer represents only 2% of the exchange market, perhaps because it priced relatively high compared to its competitors.
Rhode Island
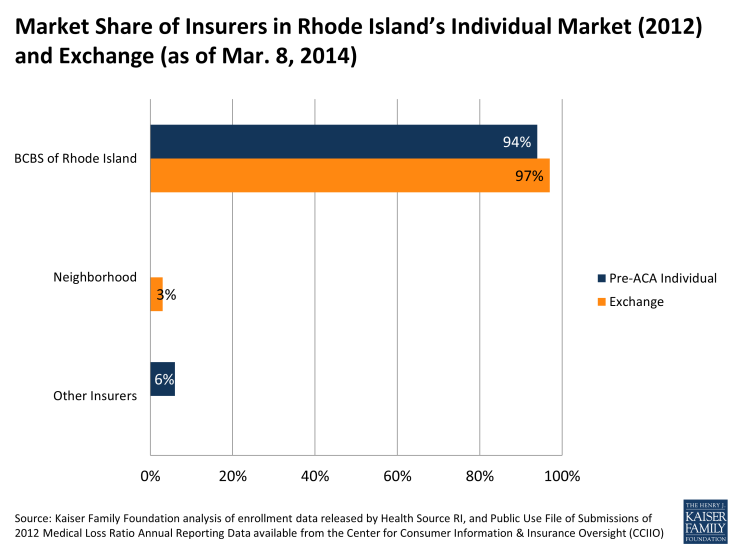
All three of the competition indicators suggest that Rhode Island’s exchange market is similarly situated to its 2012 individual market. Rhode Island’s exchange, like its 2012 individual market, is extremely concentrated, with almost all of the market controlled by a single insurer (Blue Cross & Blue Shield of Rhode Island).
|
Rhode Island Insurance Market Competition |
|||
|
Market |
Herfindahl-Hirschman Index (HHI) |
% Market Share of Largest Company |
Number of Companies over 5% Market Share |
|
2012 Individual Market |
8,824 (Highly Concentrated) |
94% |
1 |
|
2014 Exchange Market |
9,361 (Highly Concentrated) |
97% |
1 |
|
How Competitive is Exchange? |
Similar |
Similar |
Similar |
|
Source: Kaiser Family Foundation. |
|||
There are only two insurers competing in Rhode Island’s exchange market. Blue Cross Blue Shield of Rhode Island holds 97% market share. That it controls so much of the exchange is unsurprising as the insurer previously held 94% of the overall individual market before the ACA.
Rhode Island’s other plan, Neighborhood Health Plan of Rhode Island (NHPRI), currently holds 3% of the market. Before the ACA, NHPRI served Medicaid enrollees, but entered into the exchange this year. Rhode Island’s exchange director has indicated that they are in conversations with other carriers and are hopeful for additional entrants in the coming years.
Washington
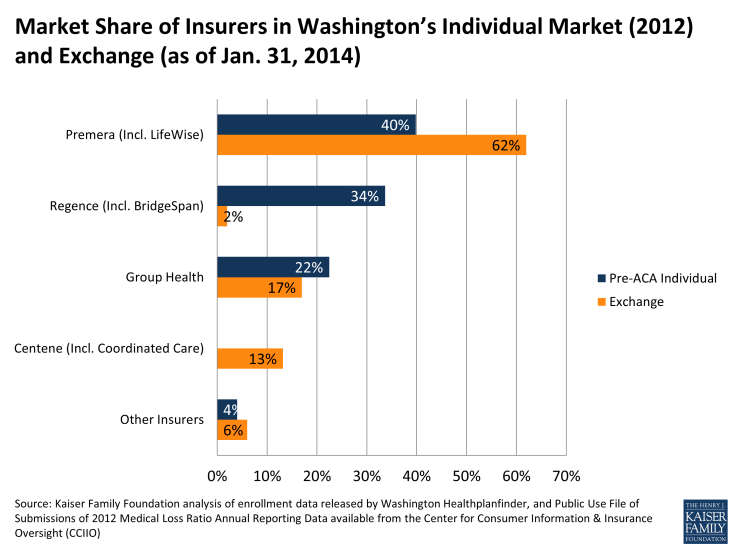
Much like its individual market in 2012, Washington’s exchange market is shaping up to be highly concentrated. Washington State initially rejected filings from several insurers wishing to participate in the state’s exchange, temporarily leaving the state with just four exchange insurers. Shortly before the exchanges opened, however, the state approved additional insurers, bringing participation to a total of 9 insurers (three of which are owned by the same parent company, Premera).
|
Washington Insurance Market Competition |
|||
|
Market |
Herfindahl-Hirschman Index (HHI) |
% Market Share of Largest Company |
Number of Companies over 5% Market Share |
|
2012 Individual Market |
3,230 (Highly Concentrated) |
40% |
3 |
|
2014 Exchange Market |
4,309 (Highly Concentrated) |
62% |
3 |
|
How Competitive is Exchange? |
Less Competitive |
Less Competitive |
Similar |
|
Source: Kaiser Family Foundation. |
|||
Three parent companies hold about 92% of the exchange market: Premera, Group Health, and Centene. Coordinated Care (a Centene subsidiary) is a new entrant that has picked up substantial market share in the exchange. Centene contracted with the state of Washington in 2012 to serve Medicaid beneficiaries and subsequently entered into the individual exchange market. It now offers the lowest silver premiums in all areas in which it operates.
While Premera’s premiums are not the lowest, the insurer did pick up a substantial portion of the market, now controlling nearly two thirds of the exchange market. Premera did offer the second-lowest cost silver plans in much of the state and may have benefited from more name-recognition than Centene.
As in Minnesota, market share in Washington’s exchange has shifted significantly as compared to the pre-ACA individual market. Regence, a major player in the individual market previously, has picked up very few exchange enrollees. However, if Regence is still enrolling a significant number of people outside the exchange, the individual market as a whole may end up being more competitive than the exchange-only enrollment information suggests.

