Millions of Seniors Live In Households with School-Age Children
There are many factors that state and local officials, as well as individual schools or school systems, are likely to consider as they decide when and how to reopen in the upcoming school year. One set of issues involves the myriad of practical considerations needed to keep students, teachers and others who work at schools safe, particularly those who may be at higher risk of severe illness if they become infected with coronavirus. Doing so is challenging, however, given the concentration of students and teachers in relatively tight spaces, limited budgets to cover additional expenses for personal protective equipment (PPE) and physical space reconfiguration, along with the difficulty in enforcing social distancing and safe habits among school-age children. For these reasons, there is a concern that transmission will occur in schools, potentially placing students and teachers at risk. Our prior analysis shows one in four teachers are at-risk of becoming seriously ill if they contract COVID19. So far, the effects of opening schools in other countries has been mixed.
Another concern is that children may become infected at school and carry the virus back to their homes, potentially infecting others in their household. It is still unclear how frequently children transmit the virus to others. While experts believe children are not the main source of infection in communities, transmission from children does occur. Evidence so far indicates that children are at a lower risk of infection, present with milder symptoms, and are much less likely to die from the infection compared to older adults, but they still could present a risk to others in their household, especially in households with people at higher risk, such as older adults and others with pre-existing conditions. To better understand how big this group might be, we used data by state on family composition to analyze the number of older adults with at least one school-age child at home.
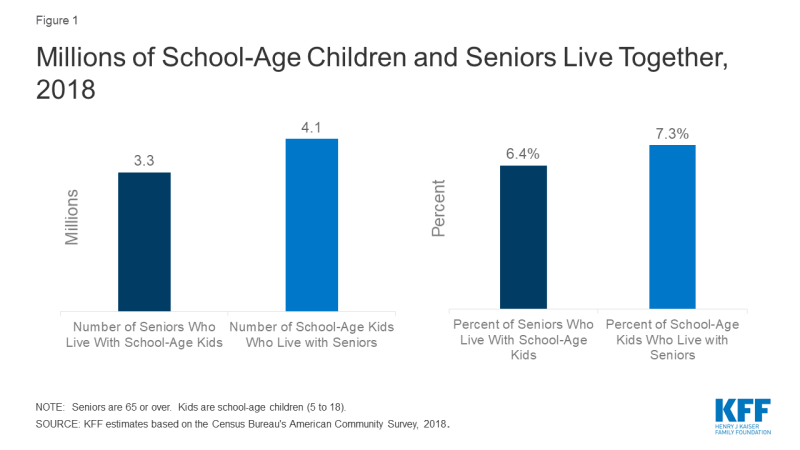
Our analysis finds about 6% of people age 65 or older, or about 3.3 million people, lived in a household with a school-age child (ages 5-18) in 2018 (Figure 1). Looking the other way, 4.1 million school-age children, about 7% of those between the ages of 5 and 18, live in a household with someone 65 or over.
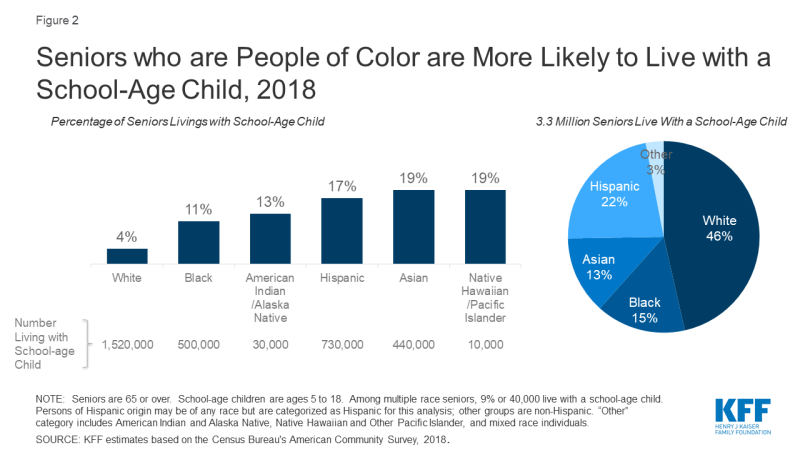
While nearly half of older adults living with a school-age child are White, older people of color are significantly more likely to live with a school-age child compared to their White counterparts. Nearly one in five (19%) Asian and Native Hawaiian or Other Pacific Islander older adults live with a school-age child, as do 17% of Hispanic older adults, 13% of American Indian or Alaska Native older adults, and over one in ten (11%) Black older adults. In contrast, 4% of older White adults lives with a school-age child. COVID19 already has disproportionately affected people of color, and if schools become a source of infection, older people of color would be at increased risk of exposure through school- age children.
There is considerable variation in the share of older adults living with a school age child across the country (Figure 3), California, Texas, and Florida each have relatively large numbers of seniors who cohabitated with a school-age child (590, 321 and 279 thousand respectively) (Table 1). The highest share is in Hawaii, where 15% of seniors live with a school-age child, and 20% of school-age children lives with an adult age 65 or older.
The risk posed by COVID-19 to older family members is just one of the many factors that state and local officials will need to consider as they develop plans to safely reopen schools, but as we’ve shown here, these decisions could affect several million older adults. In addition, these decisions are likely to disproportionately affect older people of color who are more likely than older White adults to live in households with a school-age child.
| Table 1: The Share of School-Age Children and Seniors Living Together, by State, 2018 | ||||||
| State | Number of Seniors Livings with School-Age Kids | Number of Seniors | Share of Seniors living With School-Age Kids | Number of School-Age Kids Living with Seniors | Number of School-Age Kids | Share of School-Age Kids Living with Seniors |
| U.S. Total | 3,282,000 | 51,121,000 | 6% | 4,133,000 | 56,643,000 | 7% |
| Alabama | 44,000 | 811,000 | 5% | 54,000 | 850,000 | 6% |
| Alaska | 6,000 | 85,000 | 7% | 8,000 | 142,000 | 6% |
| Arizona | 77,000 | 1,246,000 | 6% | 104,000 | 1,280,000 | 8% |
| Arkansas | 25,000 | 489,000 | 5% | 31,000 | 543,000 | 6% |
| California | 590,000 | 5,577,000 | 11% | 707,000 | 6,929,000 | 10% |
| Colorado | 43,000 | 795,000 | 5% | 56,000 | 996,000 | 6% |
| Connecticut | 30,000 | 591,000 | 5% | 35,000 | 589,000 | 6% |
| Delaware | 11,000 | 178,000 | 6% | 11,000 | 153,000 | 7% |
| District Of Columbia | 5,000 | 83,000 | 6% | 7,000 | 85,000 | 8% |
| Florida | 279,000 | 4,294,000 | 7% | 305,000 | 3,285,000 | 9% |
| Georgia | 113,000 | 1,426,000 | 8% | 145,000 | 1,976,000 | 7% |
| Hawaii | 39,000 | 258,000 | 15% | 46,000 | 227,000 | 20% |
| Idaho | 14,000 | 276,000 | 5% | 18,000 | 351,000 | 5% |
| Illinois | 117,000 | 1,926,000 | 6% | 162,000 | 2,218,000 | 7% |
| Indiana | 44,000 | 1,015,000 | 4% | 62,000 | 1,205,000 | 5% |
| Iowa | 13,000 | 518,000 | 3% | 18,000 | 560,000 | 3% |
| Kansas | 16,000 | 442,000 | 4% | 21,000 | 545,000 | 4% |
| Kentucky | 34,000 | 711,000 | 5% | 43,000 | 758,000 | 6% |
| Louisiana | 43,000 | 700,000 | 6% | 59,000 | 847,000 | 7% |
| Maine | 11,000 | 268,000 | 4% | 15,000 | 191,000 | 8% |
| Maryland | 66,000 | 906,000 | 7% | 88,000 | 1,026,000 | 9% |
| Massachusetts | 64,000 | 1,103,000 | 6% | 85,000 | 1,062,000 | 8% |
| Michigan | 66,000 | 1,676,000 | 4% | 82,000 | 1,673,000 | 5% |
| Minnesota | 33,000 | 857,000 | 4% | 45,000 | 990,000 | 5% |
| Mississippi | 28,000 | 461,000 | 6% | 41,000 | 561,000 | 7% |
| Missouri | 39,000 | 1,001,000 | 4% | 52,000 | 1,046,000 | 5% |
| Montana | 12,000 | 198,000 | 6% | 16,000 | 173,000 | 9% |
| Nebraska | 10,000 | 292,000 | 4% | 11,000 | 363,000 | 3% |
| Nevada | 34,000 | 474,000 | 7% | 40,000 | 527,000 | 8% |
| New Hampshire | 10,000 | 237,000 | 4% | 14,000 | 204,000 | 7% |
| New Jersey | 101,000 | 1,403,000 | 7% | 134,000 | 1,517,000 | 9% |
| New Mexico | 20,000 | 364,000 | 6% | 26,000 | 382,000 | 7% |
| New York | 227,000 | 3,114,000 | 7% | 291,000 | 3,077,000 | 9% |
| North Carolina | 88,000 | 1,648,000 | 5% | 120,000 | 1,799,000 | 7% |
| North Dakota | 1,000 | 110,000 | 1% | 3,000 | 127,000 | 2% |
| Ohio | 82,000 | 1,926,000 | 4% | 101,000 | 1,985,000 | 5% |
| Oklahoma | 34,000 | 598,000 | 6% | 42,000 | 736,000 | 6% |
| Oregon | 35,000 | 729,000 | 5% | 47,000 | 673,000 | 7% |
| Pennsylvania | 96,000 | 2,251,000 | 4% | 126,000 | 2,039,000 | 6% |
| Rhode Island | 8,000 | 175,000 | 5% | 10,000 | 154,000 | 7% |
| South Carolina | 49,000 | 881,000 | 6% | 65,000 | 868,000 | 8% |
| South Dakota | 4,000 | 139,000 | 3% | 7,000 | 160,000 | 5% |
| Tennessee | 67,000 | 1,075,000 | 6% | 84,000 | 1,165,000 | 7% |
| Texas | 321,000 | 3,511,000 | 9% | 406,000 | 5,727,000 | 7% |
| Utah | 27,000 | 343,000 | 8% | 34,000 | 721,000 | 5% |
| Vermont | 5,000 | 119,000 | 4% | 7,000 | 90,000 | 8% |
| Virginia | 90,000 | 1,296,000 | 7% | 109,000 | 1,444,000 | 8% |
| Washington | 62,000 | 1,143,000 | 5% | 77,000 | 1,261,000 | 6% |
| West Virginia | 16,000 | 353,000 | 5% | 24,000 | 283,000 | 9% |
| Wisconsin | 26,000 | 956,000 | 3% | 35,000 | 983,000 | 4% |
| Wyoming | 2,000 | 95,000 | 2% | 5,000 | 102,000 | 5% |
| NOTE: Seniors are 65 or over. School-age kids are 5 to 18. Counts are rounded to the nearest 1,000. | ||||||
| SOURCE: KFF estimates based on the Census Bureau’s American Community Survey, 2018. | ||||||
| Methods |
| This analysis is based on KFF analysis of the 2018 American Community Survey (ACS), 1-year file. The ACS includes a 1% sample of the US population. There are over 511,000 observations for those between 5 and 18, representing 57 million people. There are over 611,000 observations for those 65 or older, representing 51 million people. Throughout the brief, individuals of Hispanic origin may be any race, but are classified as Hispanic for this analysis; all other groups are limited to non-Hispanic individuals. |


