Nursing Facilities, Staffing, Residents and Facility Deficiencies, 2009 Through 2016
Staffing Levels
Over the past 25 years, numerous research studies have documented a significant relationship between nurse staffing levels, particularly RN staffing, and the outcomes of care.1 The benefits of higher staffing levels, especially RNs, include lower mortality rates; improved physical functioning; less antibiotic use; fewer pressure ulcers, catheterized residents, and urinary tract infections; lower hospitalization rates; and less weight loss and dehydration.2,3,4,5,6,7 Moreover, in states that have introduced higher minimum staffing standards for nursing facilities, nurse staffing levels and quality outcomes have improved.8,9,10,11 The evidence from research studies led the Institute of Medicine to conclude that the preponderance of evidence from a number of studies with different types of quality measures shows a positive relationship between nursing staffing and quality of nursing facility care.12,13,14
Several recommendations for minimum staffing levels have been put forth. A CMS study in 2001 established the importance of having 1.3 hours per resident day (hprd) of licensed nursing care (including 0.75 registered nurse (RN) hprd) and 2.8 certified nursing assistant (CNA) hprd, for a total of 4.1 nursing hprd to prevent harm or jeopardy to residents. An expert panel recommended minimum staffing levels of 4.55 hours per resident day,15 including all RNs, LVNs, and nursing assistants. However, in spite of calls for mandatory minimum staffing standards, CMS and Congress have not implemented specific nurse staffing levels (IOM, 2003).16,17,18 The Nursing Home Reform Act of 1987 required nursing facilities to have sufficient nursing staff to provide nursing and related services to attain or maintain the highest practicable physical, mental, and psychosocial well-being of residents. Facilities must also have a registered nurse as a Director of Nursing for at least eight consecutive hours a day, seven days a week and licensed nurses on-site twenty-four hours a day. Some states also have their own minimum staffing requirements, although these are generally lower than the levels recommended by experts.19
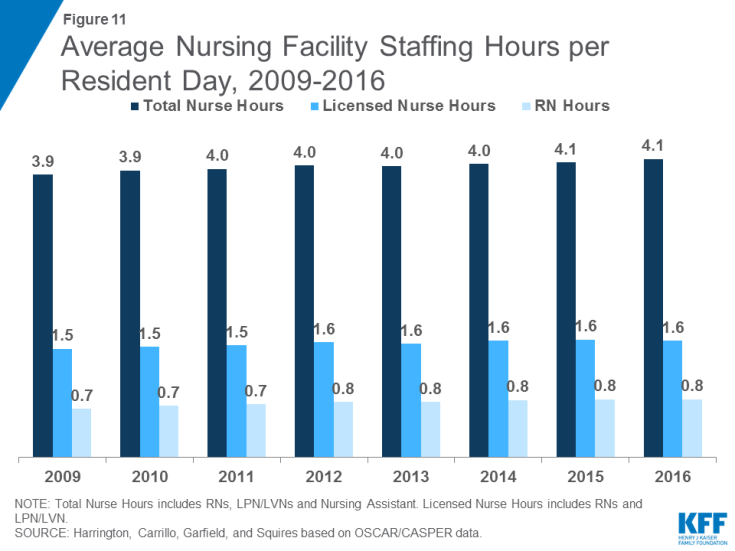
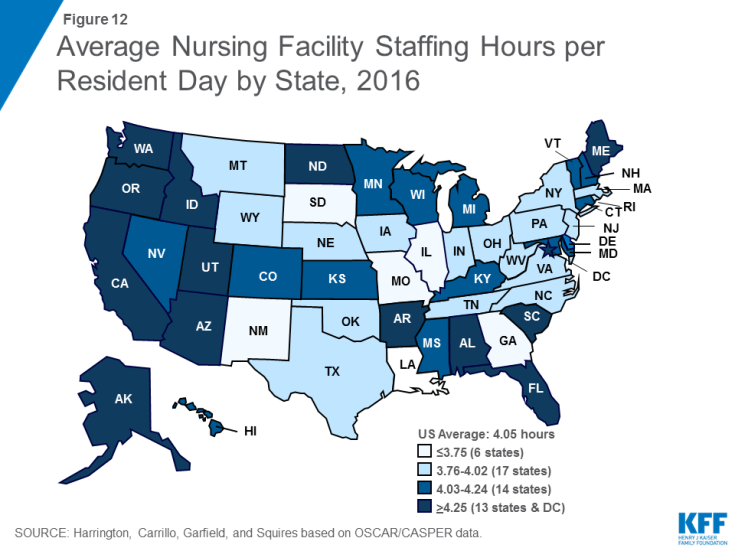
In 2016, total nursing hours (including RNs, LPN/LVNs, and NAs) averaged 4.1 hours per resident day, a small increase from 3.9 in 2009 (Figure 11 and Table 7). There was wide state variation in average nursing hours per resident day, ranging from 3.7 in South Dakota to 5.8 in Alaska. Nationwide, many of these hours are accounted for by non-licensed nursing care (i.e., nursing assistants): the average licensed nursing hours (only RNs and LPN/LVNs) per resident day was 1.6, up from 1.5 in 2009 (Figure 11). Within licensed nursing hours, about half on average are RN hours, which have increased slightly over time, from 0.7 in 2009 to 0.8 in 2016. Both LPN/LVN and NA hours were fairly flat over the period, reaching 0.8 and 2.4 hours per resident day in 2016, respectively (Table 8). Note that because not all facilities have usable staffing data, a small number of facilities are excluded from these estimates. Detail on the staffing measures included and underlying methods are provided in the Appendix at the end of the report.


