Three Questions about Firearm Deaths: Key Patterns from a Decade of Data
Firearm deaths increased sharply over the past decade, rising from 92 deaths per day to 132 deaths per day from 2012 to 2022. During that time, firearms surpassed motor vehicle accidents to become the leading cause of death for young adults in 2015, and the leading cause of death among children and adolescents in 2020. Over half of adults report a gun-related incident personally or among family, according to KFF polling, and one-fifth report death of a family member due to a firearm. On the second anniversary of the Bipartisan Safer Communities Act, the Surgeon General issued an Advisory, declaring gun violence a public health crisis. Headed into the presidential election, debate about firearms is likely to continue to be an area of stark contrast between candidates.
This analysis uses the most comprehensive and recent firearm death data available from CDC WONDER to examine firearm deaths from a decade of data (2012-2022), including who is affected, trends, and state-level differences. This analysis of firearm deaths includes suicides, homicides, and other firearm-related deaths (including accidents, legal intervention, and undetermined). Firearm suicide and homicides are often combined under the term, “firearm violence” or “gun violence”.
Key takeaways include the following:
- The total firearm death rate increased by 35% from 2012 to 2022. Firearm homicides increased more sharply during the pandemic, but firearm suicides continue to account for over half of firearm deaths. Firearms account for more than half of all suicide and homicide deaths.
- Firearm deaths are the leading cause of death among young adults (ages 18-25) and occur at a higher rate in this age group than in any other. Firearm deaths in young adults are predominantly due to homicides, while suicides account for the largest share of firearm deaths in older adults.
- Firearm deaths have sharply increased among Black and American Indian or Alaska Native (AIAN) people, while remaining relatively steady among White people. Further, while about 80% of firearm deaths among White people are due to suicides, about 80% of firearm deaths among Black people are due to homicides.
- Firearm death rates vary widely across states, with nearly a tenfold difference between the lowest and highest states. Nearly all states experienced an increase in firearm deaths from 2012 to 2022. Further, distribution of type of firearm death varies widely across states – with firearm suicides being predominant in some states, and firearm homicides in others.
How have the amount and distribution of firearm deaths changed over time?
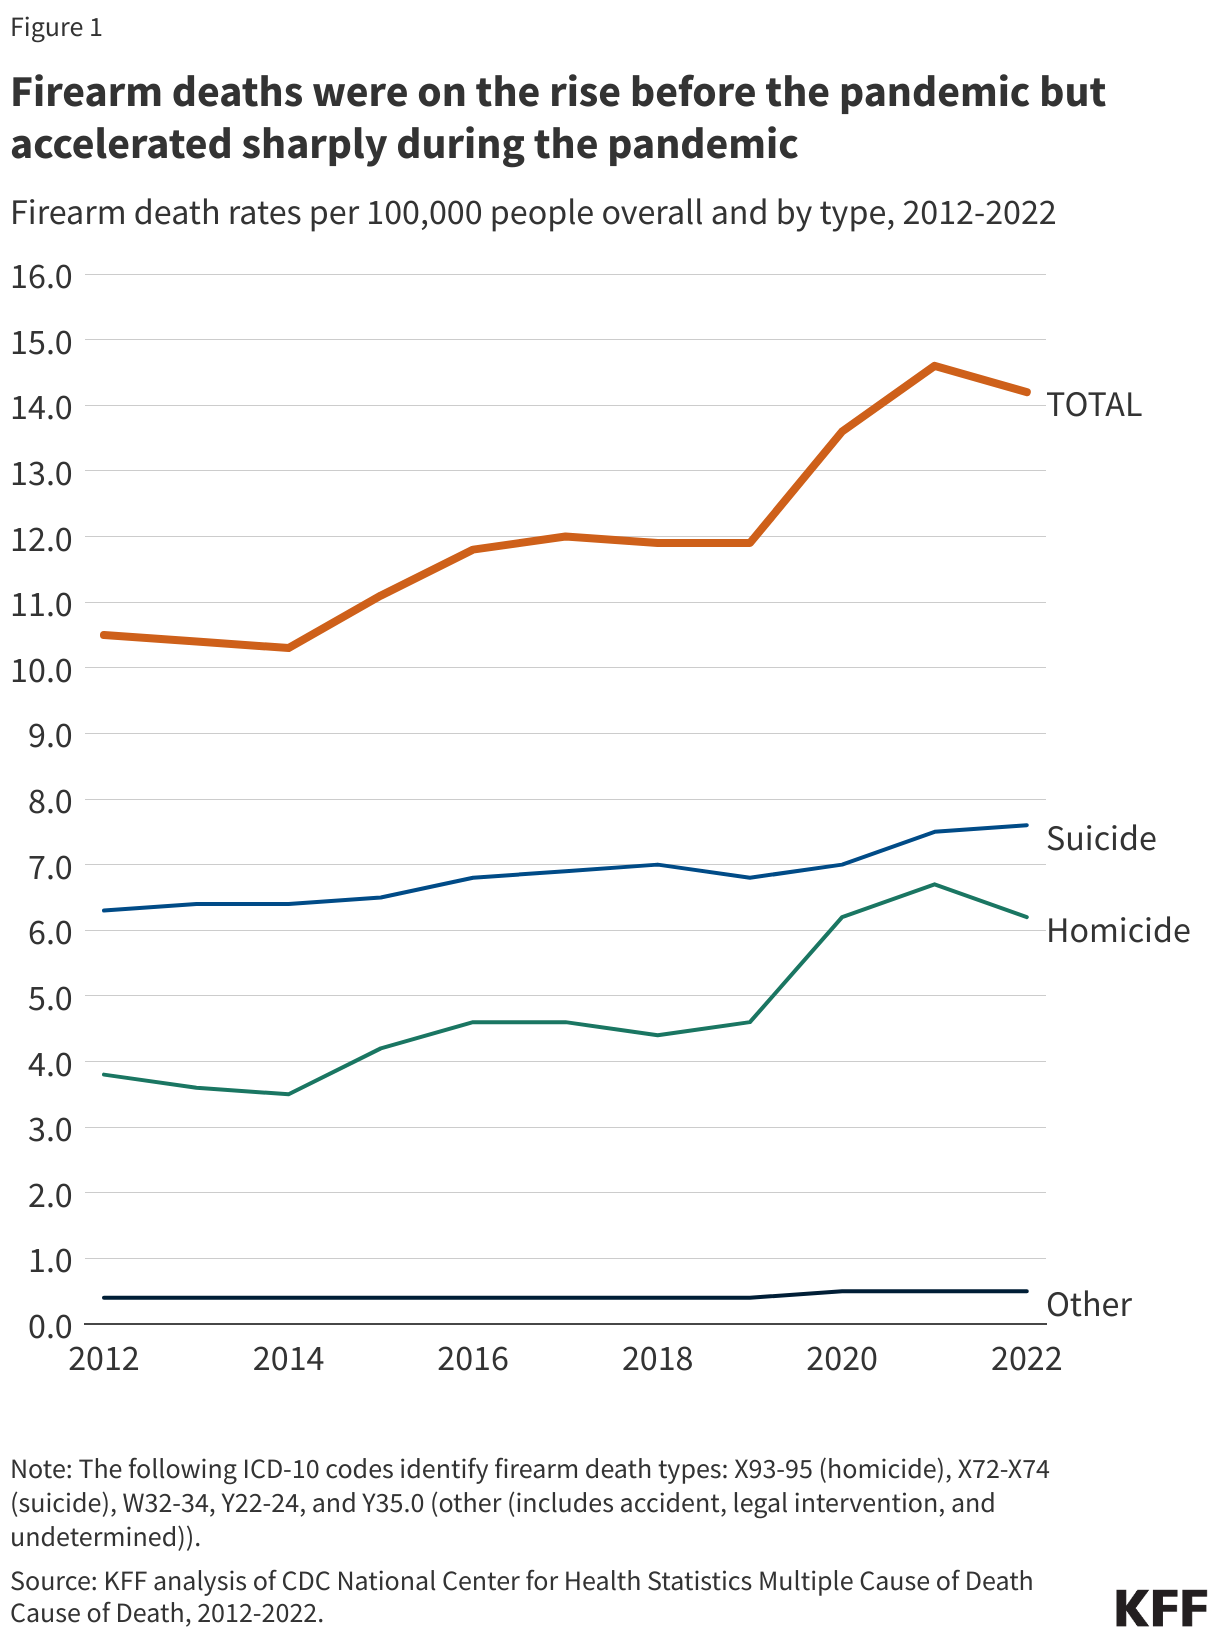
When adjusted for population growth and age, the total firearm death rate has increased by 35% from 2012 to 2022, moving from 10.5 to 14.2 deaths per 100,000 people (Figure 1). Firearm deaths began to steadily rise in 2014, before sharply accelerating during the pandemic. Although there was a small decrease in deaths from 2021 to 2022, these years still have the highest number of firearm deaths in CDC record (since 1999).
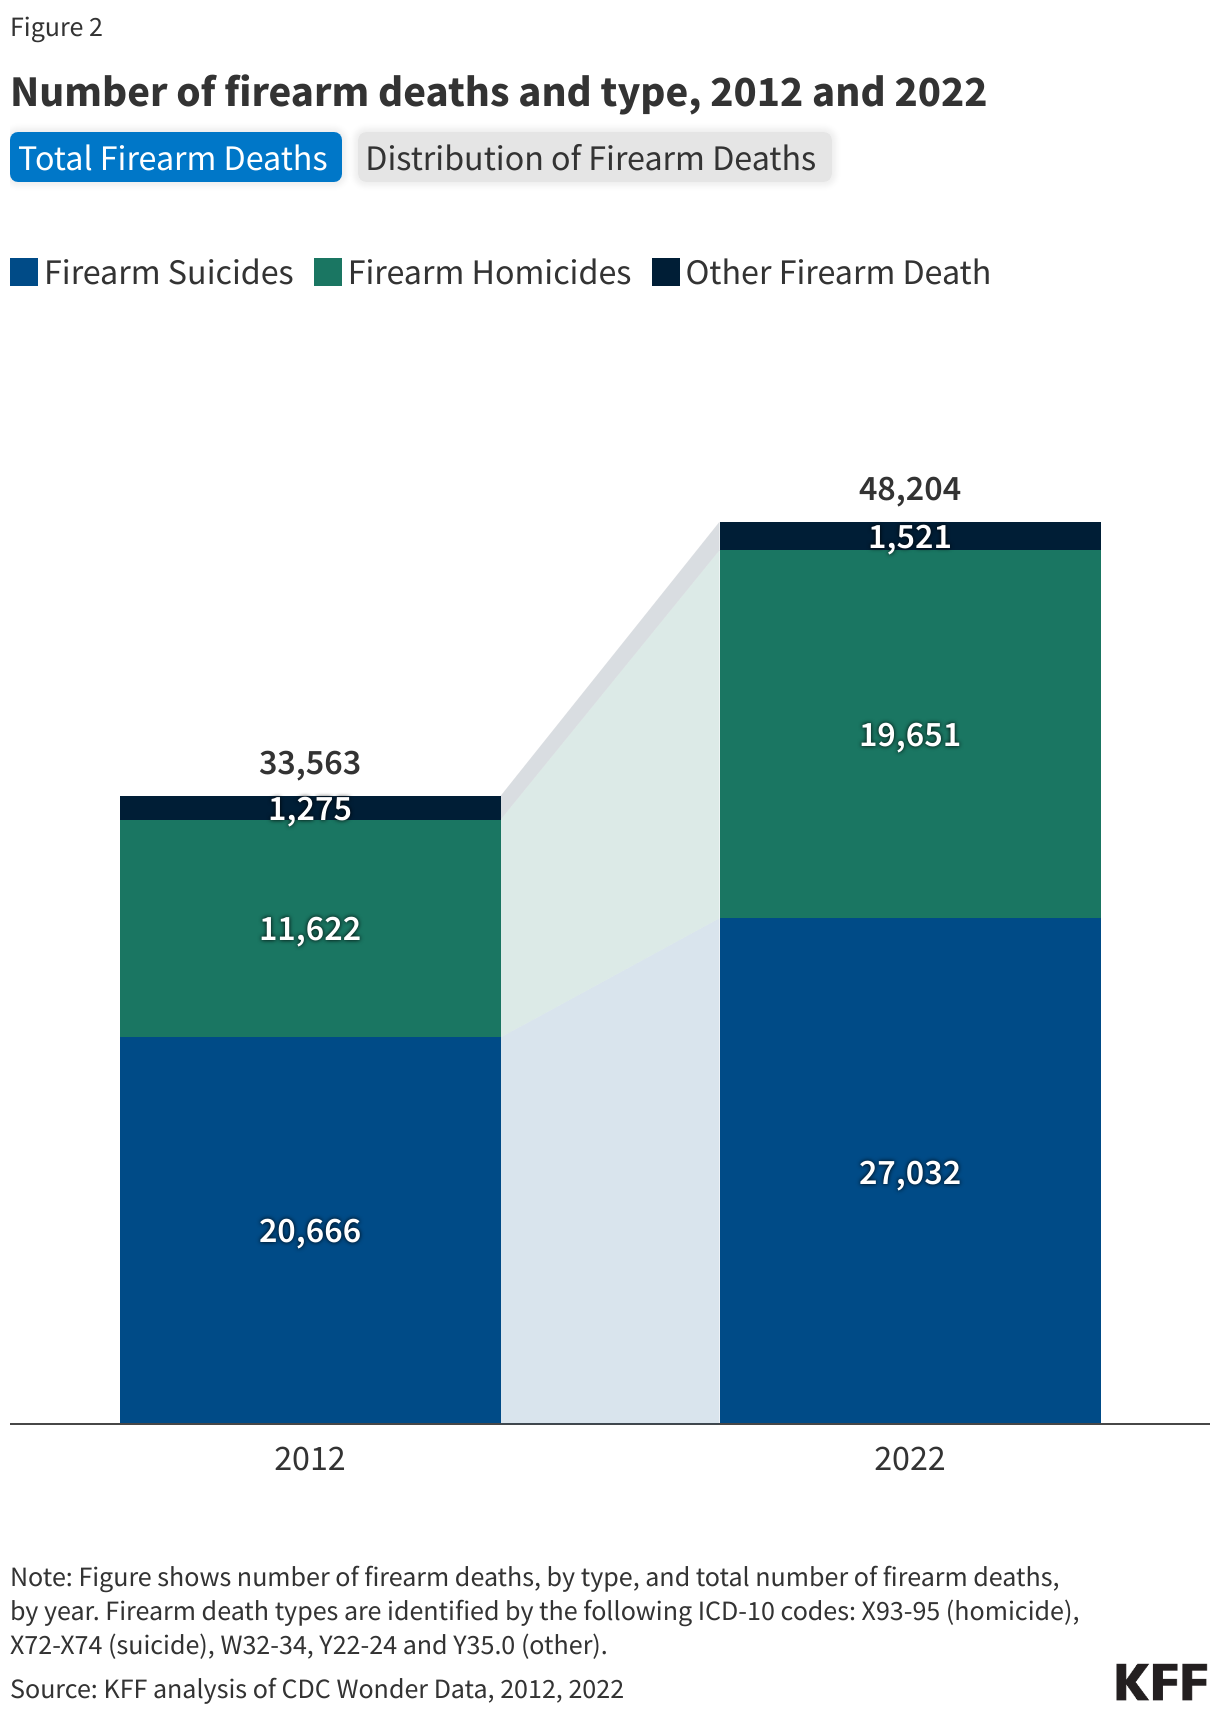
Firearm homicides sharply increased in recent years; however, suicides still account for more total firearm deaths, making up 56% of these deaths in 2022. Total firearm homicides increased by 69% from 11,622 to 19,651, and the number of firearm suicides increased by 31% from 20,666 to 27,032. Despite the larger increase in firearm homicides, firearm suicides consistently accounted for more than half of total firearm deaths from 2012 (62%) to 2022 (56%) (Figure 2). Cumulatively this translates to nearly 100,000 more firearm suicides compared to homicides over the 2012 to 2022 period (258,062 vs. 164,139).
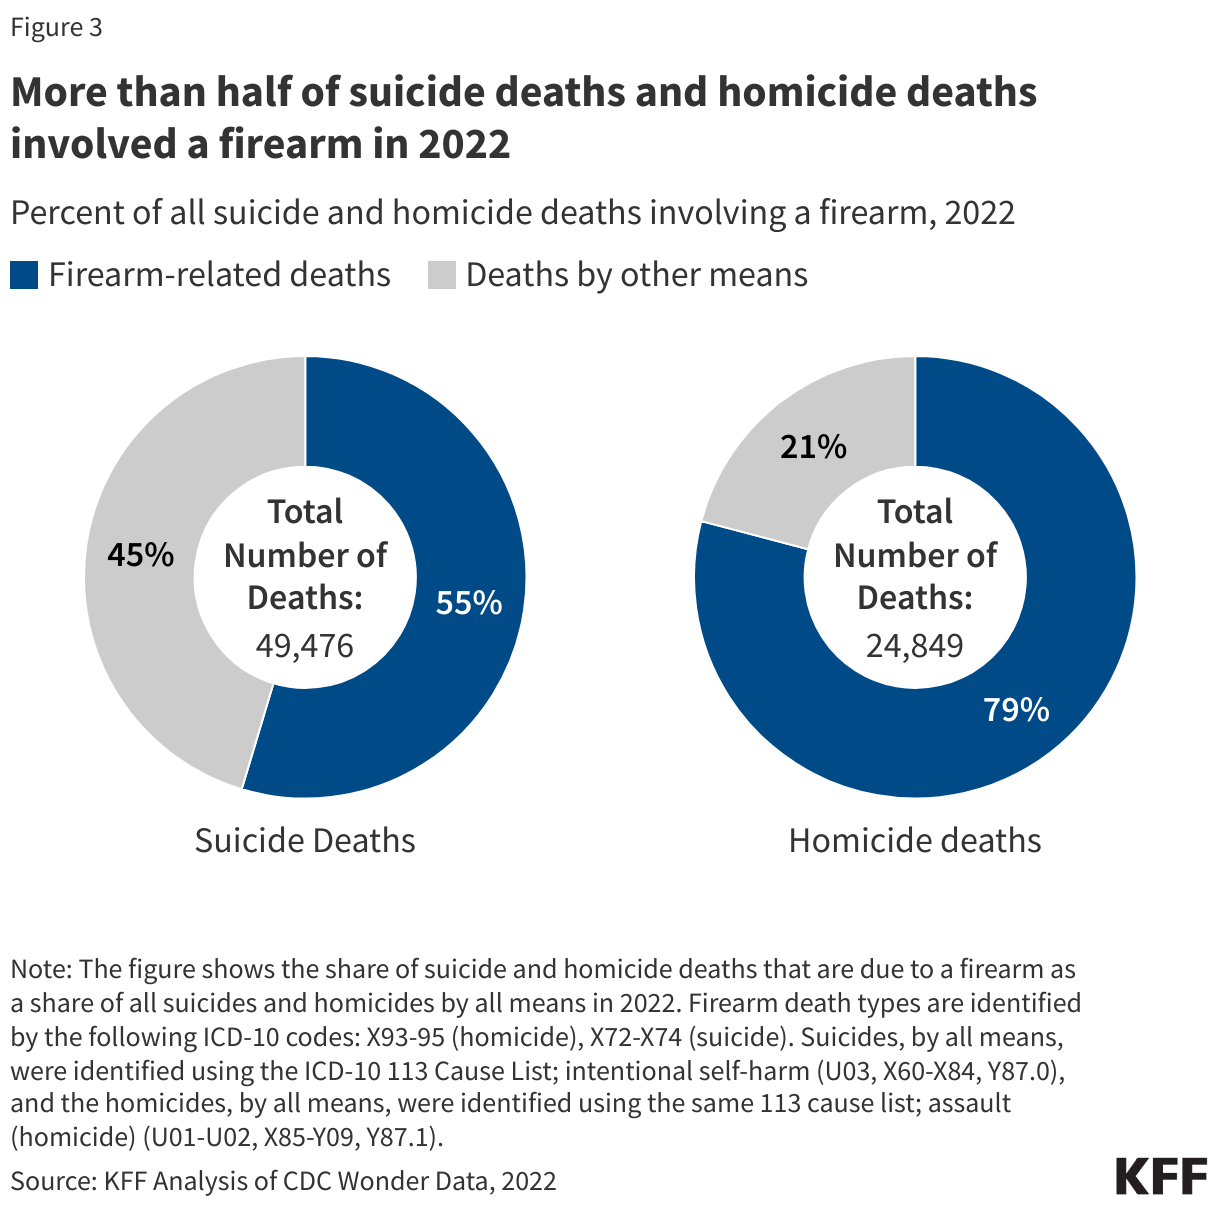
Firearms are the leading cause of total suicides and homicides, making up 55% of all suicide deaths and 79% of all homicides in 2022 (Figure 3). Firearm suicides are the most lethal method of suicide attempt, and their recent increase has led to the highest number of total suicides on CDC record. At the same time, non-firearm suicides have decreased. With about half of suicide attempts occurring within 10 minutes of the current suicide thought, access to firearms is a suicide risk factor. Efforts to reduce firearm suicides include the development of 988 and crisis services, increasing education about the link between firearm ownership and suicide risk (lethal means counseling) and providing safety locks to at-risk firearm owners. For homicides, firearms account for 79% of total homicide deaths in 2022 (Figure 3). Focused interventions, such as hospital and community violence intervention programs, have been pointed to as potential paths to reducing firearm homicides.
What are trends in firearm deaths by demographic?
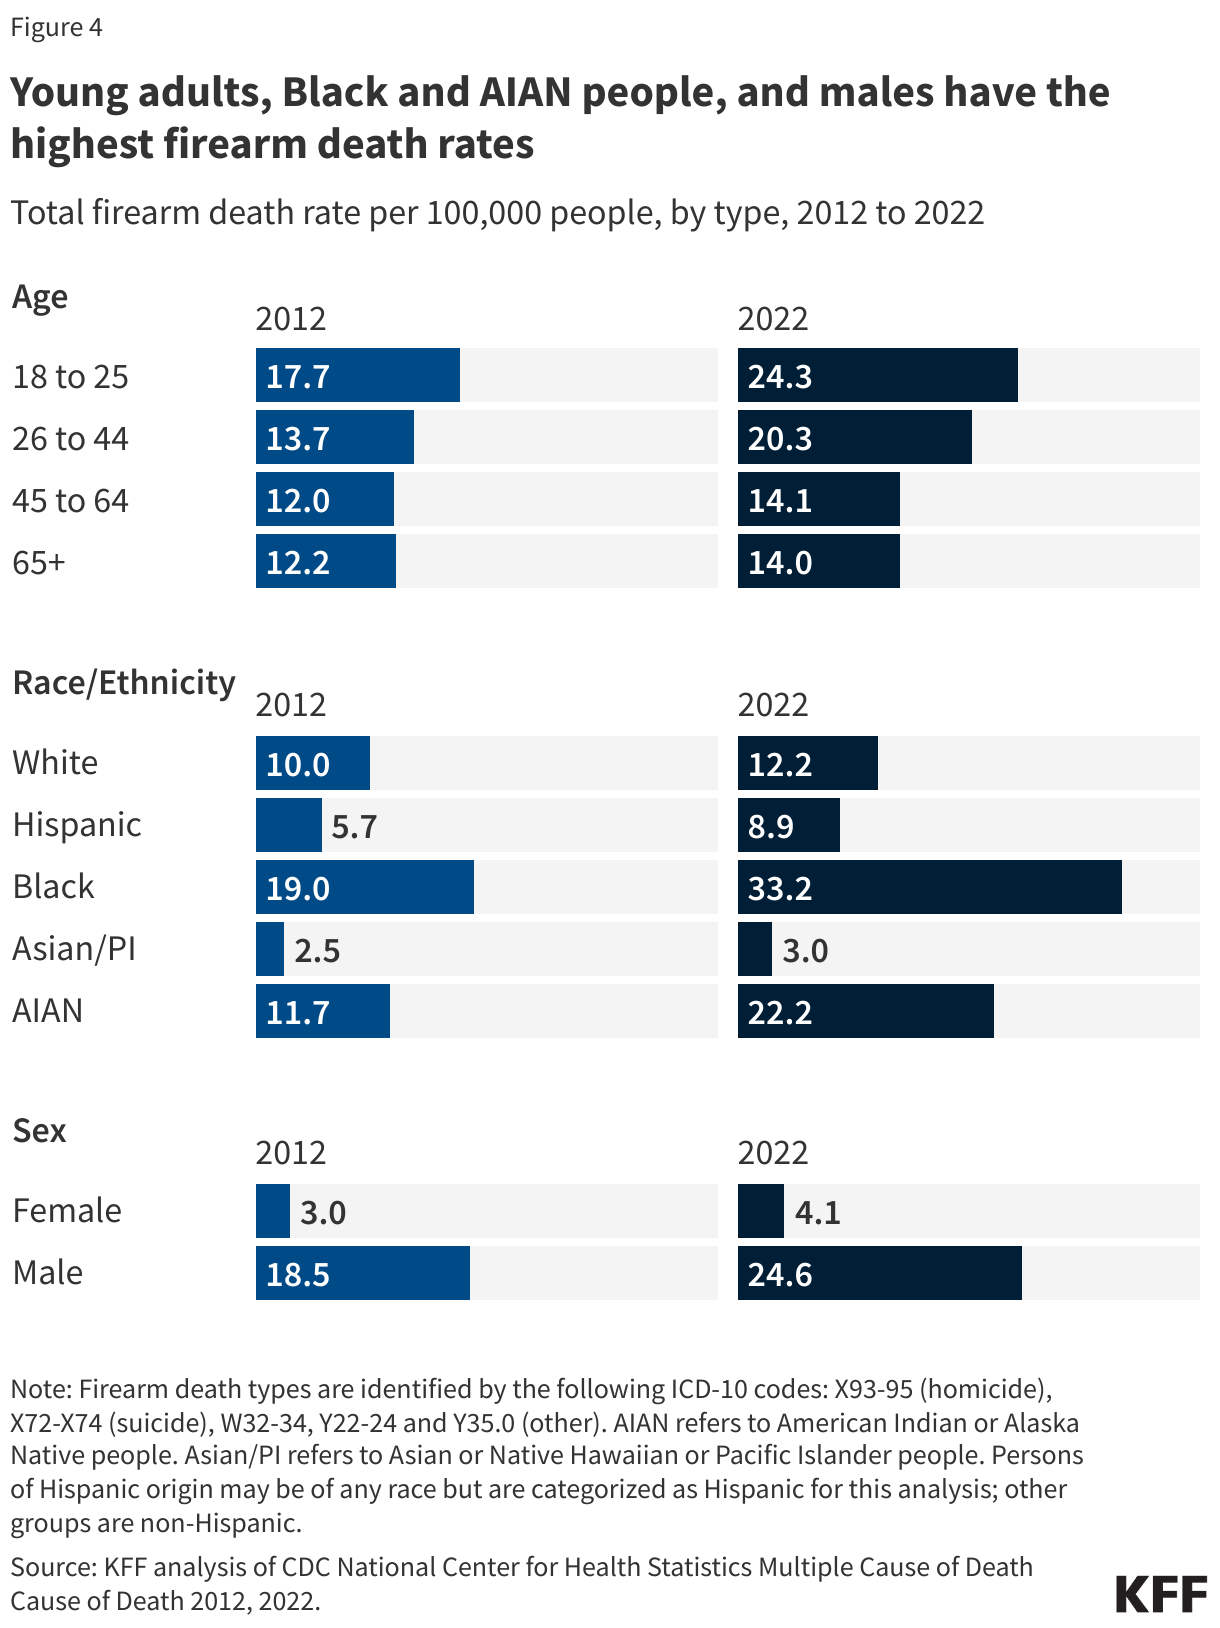
Firearm death rates vary by demographics and were consistently higher among young adults, Black people, and males compared to their respective peers from 2012 to 2022 (Figure 4). For example:
- Young adults (ages 18-25) had the highest rate of firearm deaths compared to all other age groups in 2022; however, adults ages 26-44 have experienced the fastest growth in these death rates over time (Figure 4). Between 2012 and 2022, the firearm death rate among young adults increased by 37%, from 17.7 to 24.3 deaths per 100,000, surpassing motor vehicle accidents as the leading cause of death among young adults in 2015. Adults ages 26 to 44 experienced the fastest growth in these death rates over time, with their rate rising 48% from 2012 to 2022 (13.7 vs. 20.3 per 100,000 people, respectively).
- Firearm death rates in 2022 as well as rates of increase from 2012 to 2022 were highest for Black and AIAN people. In 2022, firearm death rates for Black (33.2 per 100,000) and AIAN people (22.2 per 100,000) far exceeded the rate for White people (12.2 per 100,000) (Figure 4). Further, from 2012 to 2022, the firearm death rate increased by 75% for Black people and 90% for AIAN people, compared to 22% for White people. The firearm death rate was lowest for Asian/PI people, at 3.0 per 100,000 people in 2022.
- Males were six times more likely to die from firearms than females (24.6 vs. 4.1 per 100,000) in 2022 (Figure 4). Firearm death rates were consistently higher for males compared to females over time, although both groups experienced increases from 2012 to 2022. Men are about twice as likely to own a firearm compared to women. During the pandemic, firearm purchases by women rose, which may lead to shifts in these demographic trends of firearm deaths in coming years.
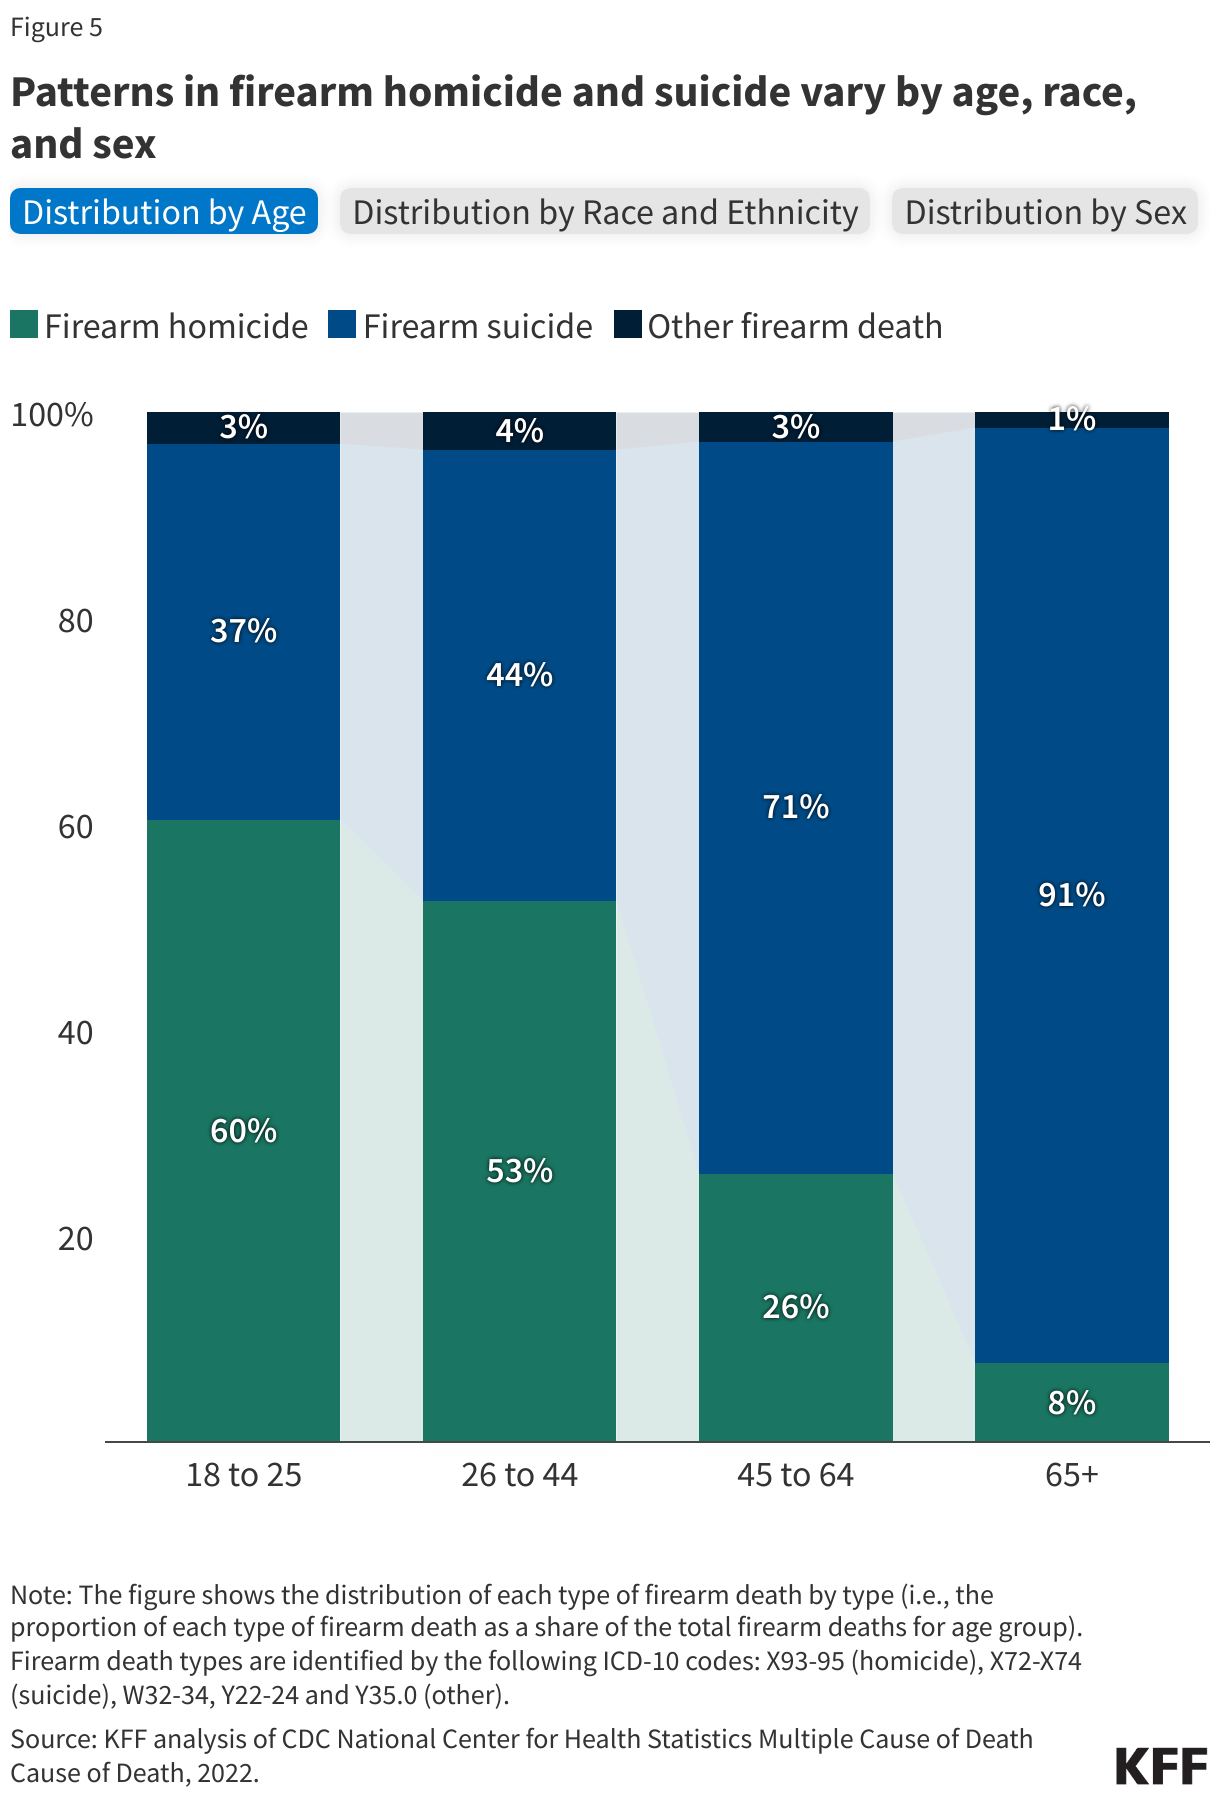
Patterns in the distributions of firearm suicide and homicide deaths vary across race and ethnicity and age (Figure 5). For example:
- Firearm deaths in young adults are predominantly due to homicides, while suicides account for the largest share of deaths among older adults. Firearm homicides peak in young adults, accounting for nearly two-thirds of all firearm deaths in this age group. The share of firearm homicides steadily decreases with age, dropping to less than 10% by age 65+. Conversely, suicides make up a smaller share of firearm deaths in young adults but increase with age, comprising 91% of all firearm deaths in the 65+ age group.
- About eighty percent of firearm deaths among White people are suicides, while 80% among Black people are homicides. Among other racial and ethnic groups, the distribution of homicide and suicide firearm deaths is more mixed. These differences may be tied to underlying structural inequities such as poverty and racism, which are linked to higher homicide rates. They may also reflect differences in firearm ownership rates, as White people are more likely to own firearms and firearm availability is closely tied to suicide risk. Although 8 in 10 firearm deaths among Black people are homicides, this share has decreased since 2012, reflecting a sharper relative growth in firearm suicides among Black people. This group has also experienced rising mental health needs and low treatment rates.
- Homicides account for a somewhat larger share of firearm deaths among females compared to males. The share of firearm homicides is higher in females (47% vs. 40%), whereas the share of firearm suicides is larger in males. Suicide risk is tied to gun ownership and men are about twice as likely to own a firearm compared to women. Further, many female firearm homicides are linked to intimate partner violence.
How do firearm deaths vary by state?
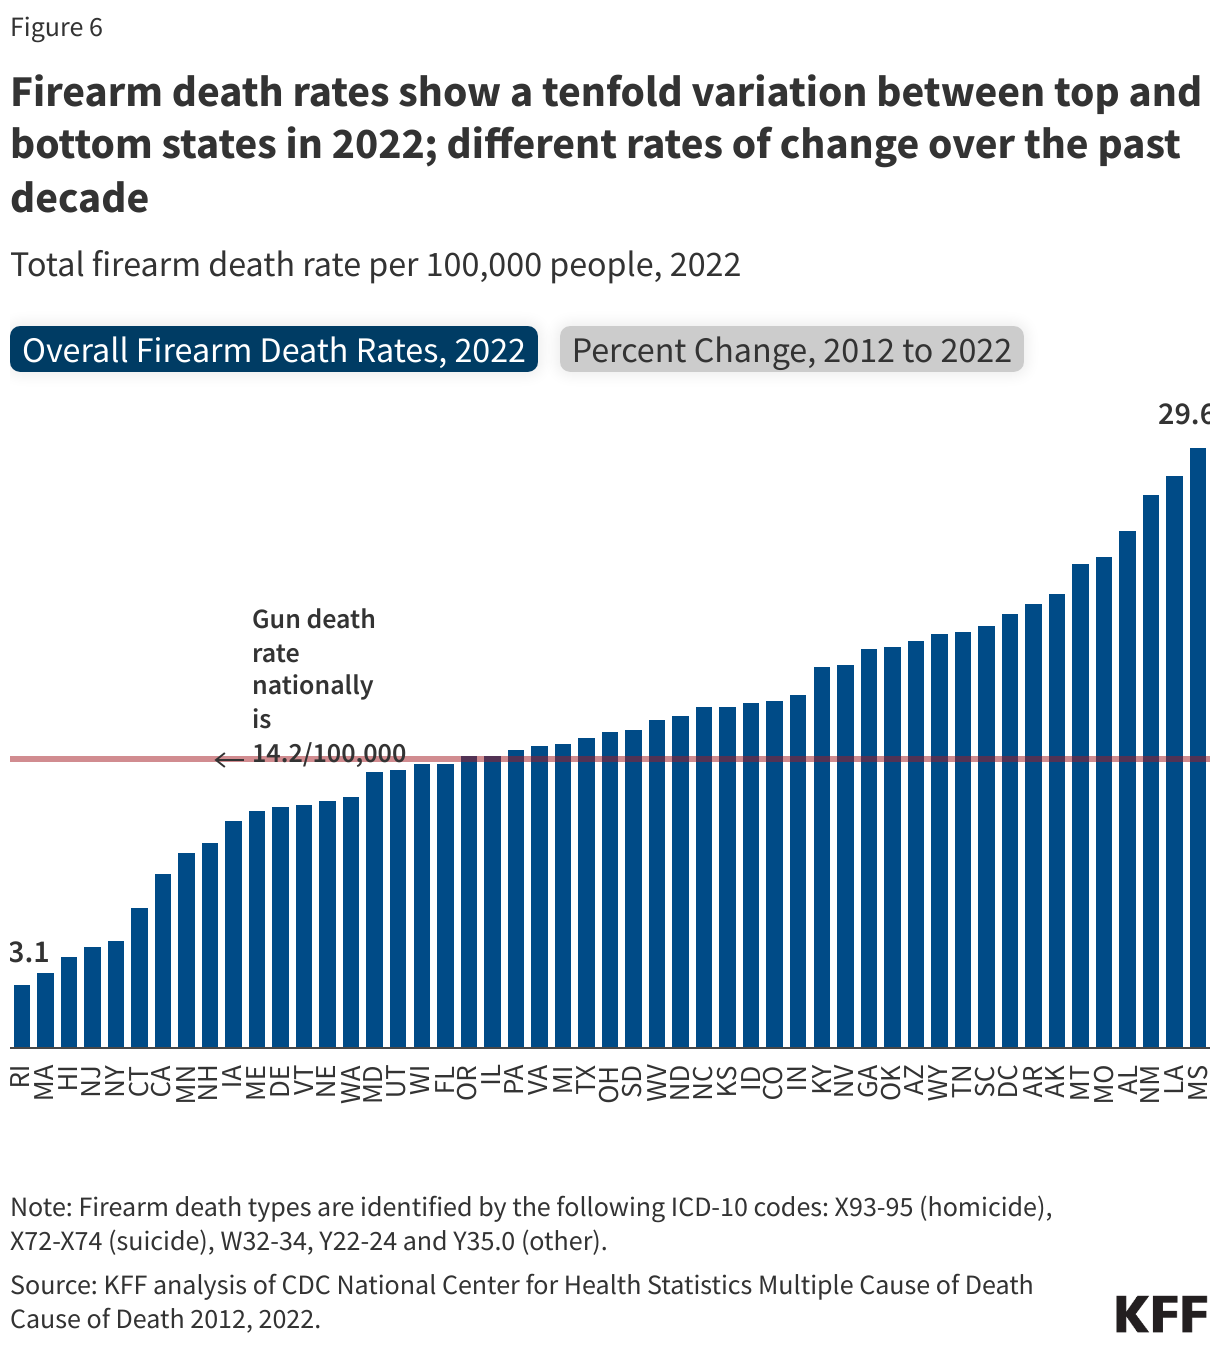
Firearm death rates vary widely across states, with nearly a tenfold difference between the lowest rate in Rhode Island (3.1 per 100,000) and the highest in Mississippi (29.6 per 100,000). In 2022, about two-thirds of states had firearm death rates above the national average of 14.2 per 100,000, with the highest rates in Mississippi, Louisiana, and New Mexico. About one-third of states, including Rhode Island, Massachusetts, and New Jersey, had rates below the national average. From 2012 to 2022, firearm death rates increased in all states – except Rhode Island and New Jersey – with rate increases ranging from 1% in Wyoming to 128% in the District of Columbia (Figure 6). Variations in firearm death rates may be due to a combination of factors, including rates of firearm ownership, and other state policies—which may include child access prevention laws. At the end of last year, the White House Office of Gun Violence Prevention was established with one of its goals being to partner with states to address gun violence. The office recommended that states create their own gun violence prevention offices. While a few states already had similar offices, Maryland recently formed its own and more states may have efforts underway.
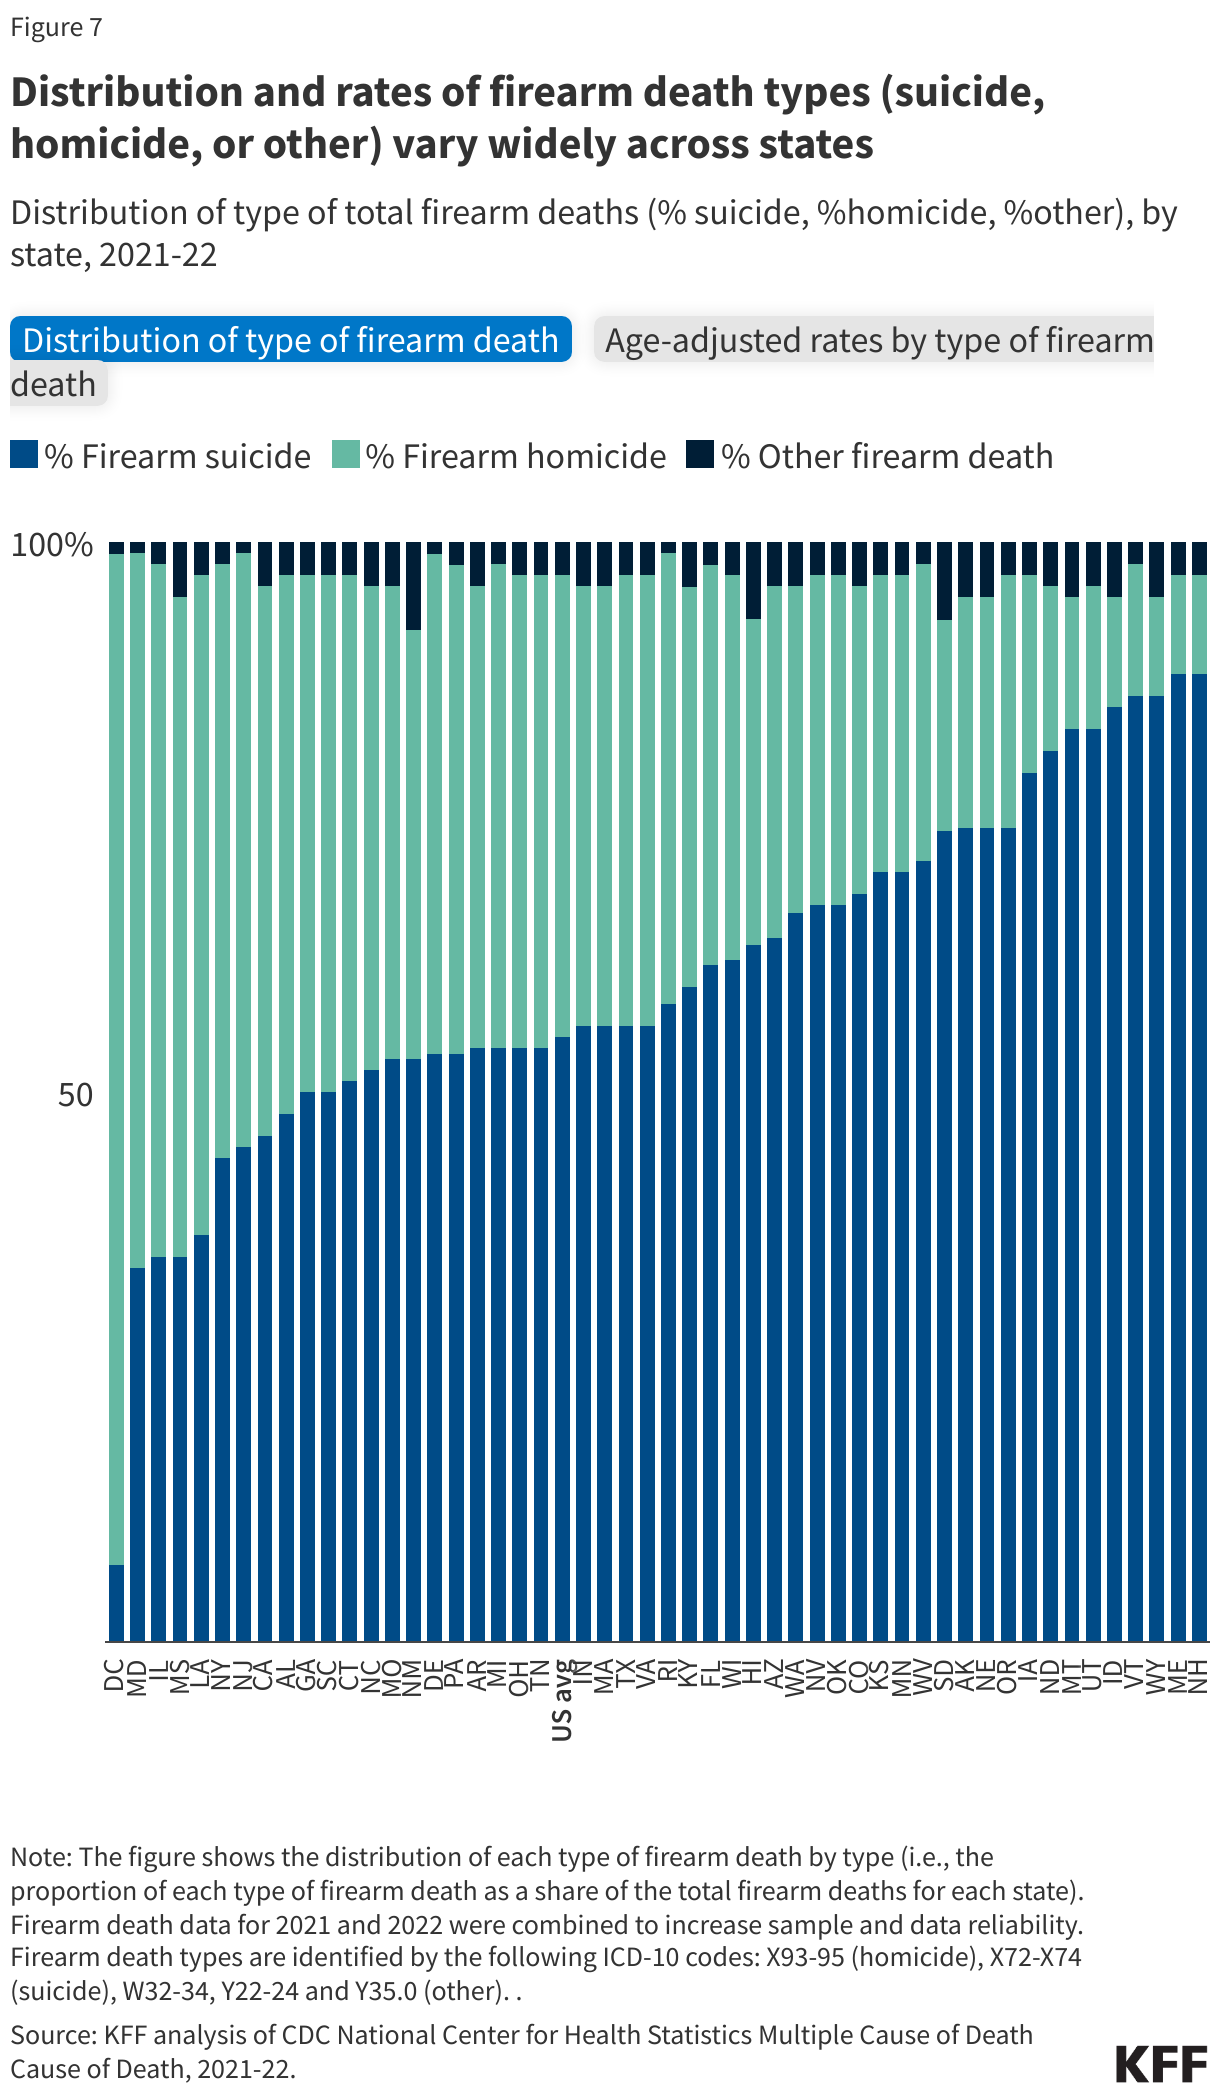
The type of firearm death varies by state, with suicide predominant in some states, homicide in others, and some states more evenly mixed. Nationally, suicides account for 56% of all firearm deaths, homicides account for 41%, and other firearm deaths account for 3%, but these proportions differ substantially at the state level. For instance, in Utah and New Hampshire suicides account for most firearm deaths (over 80%). In contrast, in the District of Columbia and Maryland, homicides make up about 65% or more of the state’s firearm deaths. Other states, like Pennsylvania and Georgia, have a more even split. Age-adjusted rates show the magnitude of each type of firearm death by state, adjusted for age and population. For instance, Montana has the highest firearm suicide death rate (20.0 per 100,000 people), whereas D.C. has a similarly high rate, but for firearm homicides (21.0 per 100,000 people) (Figure 7). While the reasons behind these variations in distribution aren’t entirely clear, they may be linked to factors like gun ownership rates, policy, and economic factors.