Data Note: Predictors Of Positive And Negative Attitudes Towards The ACA Among Non-Group Insurance Enrollees
One of the groups perhaps most affected by changes brought about by the Affordable Care Act (ACA) are people who purchase their own health insurance in the non-group market. In this Data Note, we examine data from the Kaiser Family Foundation Wave 2 Survey of Non-Group Health Insurance Enrollees to explore the characteristics of non-group enrollees that are associated with positive and negative attitudes towards the ACA, including feeling personally benefited or negatively affected by the law.1 To do this, we use a statistical technique called logistic regression analysis that allows us to isolate associations between a given attitude and one characteristic (such as age or political party identification) while holding other factors constant.
Results

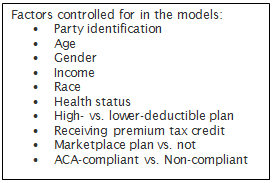
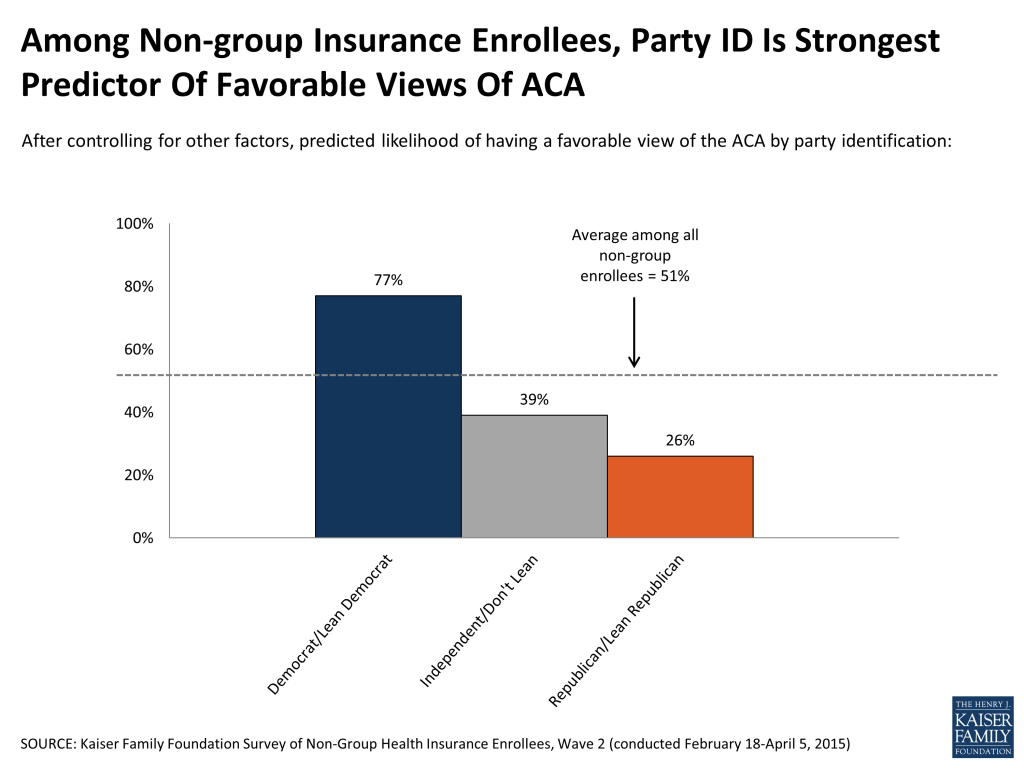
Overall, the survey found that about half of non-group enrollees (51 percent) report a favorable view of the ACA, while 43 percent have an unfavorable view. As is true among the public overall, partisanship is the biggest driver of this opinion. Even after controlling for demographics and other factors (see sidebar for full list), a person with non-group insurance who is a Democrat or Democratic-leaning independent has a predicted likelihood of having a favorable view of the law of 77 percent, compared with 39 percent for a “pure” independent (one who doesn’t lean toward either major party) and 26 percent for a Republican or Republican-leaning independent. Other demographic factors in the model, including gender, income, race, health status, and type of health plan, were not significant predictors of favorable views. Age had a small effect, with those ages 35-54 being slightly more likely to express a favorable view when controlling for other factors, but the size of the age effect was much smaller than the effect of party identification.

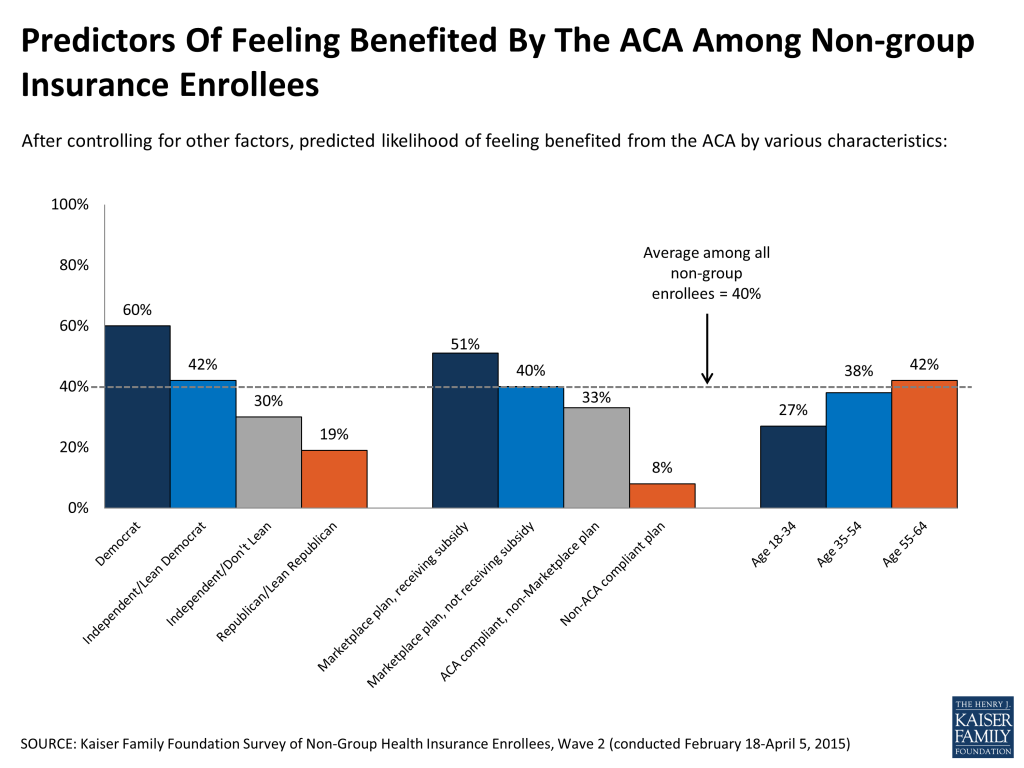
When examining factors associated with saying one has personally benefited or been negatively affected by the law, partisanship remains the strongest predictor, but other factors play a role as well. For instance, after controlling for other factors, individuals with Marketplace plans who are receiving premium tax credits have a predicted likelihood of feeling benefited by the law of 51 percent, compared with 40 percent for those in Marketplace plans who are not getting a tax credit and just 8 percent for those in pre-ACA, non-compliant plans.2 Age also plays a factor, with non-group enrollees ages 18-34 having a predicted likelihood of feeling helped by the law of 27 percent, compared with 38 percent for those ages 35-54 and 42 percent for those ages 55-64. Partisanship remains one of the strongest predictors: after controlling for other factors, the “average” Democrat enrolled in a non-group plan has a predicted likelihood of feeling the ACA has benefited them of 60 percent – three times the likelihood for a Republican or Republican-leaning independent (19 percent).

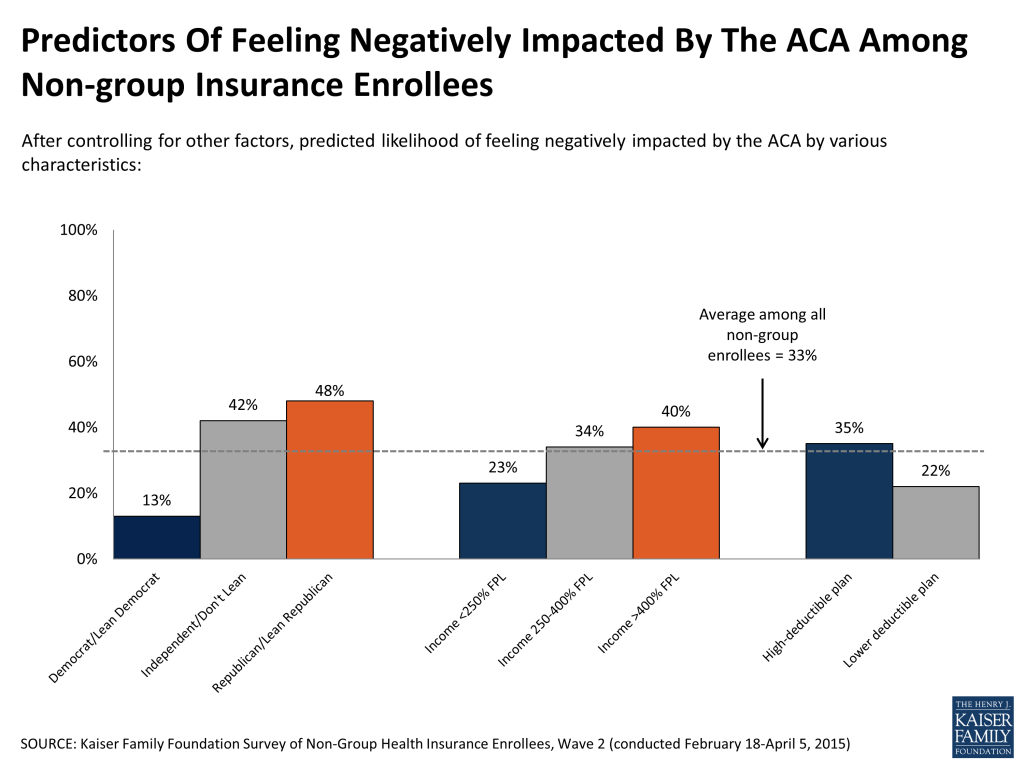
A somewhat different set of predictors emerges when looking at who feels the ACA has had a negative effect on their families. Again, partisanship is a strong predictor; controlling for other factors, a Republican or Republican-leaner with non-group insurance has a 48 percent likelihood of saying they have been negatively affected by the law, compared with just 13 percent for a Democrat or Democratic-leaner. Non-group enrollees with higher incomes are also more likely to feel harmed by the law, even after controlling for other factors. The predicted likelihood that the “average” non-group enrollee will say the law has negatively impacted them is 40 percent for those with incomes above 400 percent of the federal poverty level (FPL) compared with 23 percent for those with incomes less than 250 percent FPL. The deductible of a person’s health plan is also a significant predictor. Controlling for other factors, those in non-group plans with high deductibles (defined as $1500 or more for an individual or $3000 or more for a family) have a 35 percent predicted likelihood of feeling negatively affected, compared with 22 percent for those in plans with lower deductibles.

Discussion
Given the deep partisan divide over the ACA in the country overall, it comes as no surprise that party identification is the biggest factor associated with overall views of the law among individuals who purchase their own insurance. Beyond their general views, our analysis reveals that within the non-group market, people’s perceptions of whether the ACA has benefited or negatively impacted them are also strongly associated with their partisan identification. However, other factors beyond partisanship also emerge as significant predictors. Even when controlling for party and other demographics, older non-group enrollees and those receiving government tax credits are more likely to feel the law has helped them, while those with higher incomes and those in high-deductible plans are more likely to feel they’ve been negatively impacted. This suggests that the specifics of how people get their plans, their eligibility for government financial assistance, and the type of plan they end up with are all important factors in determining whether a non-group enrollee feels like a “winner” or a “loser” under the ACA.
- For more detail on the survey methods and main findings, see : https://modern.kff.org/health-reform/poll-finding/survey-of-non-group-health-insurance-enrollees-wave-2/ ↩︎
- Non-compliant plans are those purchased before January 1, 2014. They include plans purchased before the law was enacted in March 2010 that were grandfathered in under the ACA, as well as those purchased before October 2013 and allowed to continue under a federal transition policy at the discretion of states. For more details, see: https://modern.kff.org/health-reform/poll-finding/survey-of-non-group-health-insurance-enrollees-wave-2/ ↩︎