Congressional District Interactive Map: How Much Will ACA Premium Payments Rise if Enhanced Subsidies Expire?
Enhanced Affordable Care Act (ACA) subsidies were first made available as part of the American Rescue Plan Act in 2021 and were extended through the end of 2025 by the Inflation Reduction Act. The enhanced subsidies build on the ACA’s original tax credits by increasing the amount of premium assistance lower-income enrollees receive, and by making middle- and higher-income enrollees (with incomes over four times poverty) newly eligible for financial assistance to buy health insurance. These enhanced subsidies will expire at the end of this year unless Congress further extends them and President Trump signs it into law. In 2024, 56% of ACA Marketplace enrollees live Congressional Districts represented by Republicans and 76% of enrollees are in states won by President Trump in the 2024 election.
If the enhanced subsidies expire, monthly premium payments for the vast majority of Marketplace enrollees will increase sharply starting January 1, 2026. Among subsidized enrollees living in states that use Healthcare.gov (where data are available), premium payments would have been an average of 93% higher in 2024 without the enhanced tax credits. If these enhanced subsidies expire, the Congressional Budget Office (CBO) projects that there will be an average of 3.8 million more uninsured people each year. Unsubsidized premiums will also likely rise as healthier enrollees drop their coverage. While some state-based Marketplaces offer additional premium financial assistance for certain enrollees, the amount of and availability of these state subsidies would not be enough to fully replace the federal enhanced subsidies.
The interactive map below illustrates how much premium payments would rise without the enhanced subsidies, net of tax credits, at the congressional district level. The tool presents average net premium increases (for states that use Healthcare.gov, where data are available) and two hypothetical scenarios (in all states): one of an older couple who would lose subsidy eligibility due to their income exceeding four times poverty and another for a single individual with a $31,000 income (206% of poverty). A KFF calculator allows users to evaluate zip-code specific changes in premium payments with and without enhanced subsidies for other income and family scenarios.
Because enhanced tax credits decrease premium payments across the board for people receiving a tax credit, all subsidized Marketplace enrollees will experience increases in their monthly premium payments if the enhanced subsidies expire. However, how much each enrollee’s premium payment increases will vary widely and will depend on their family size, location, and income.
Average Increases in Premium Payments Among Subsidized ACA Enrollees
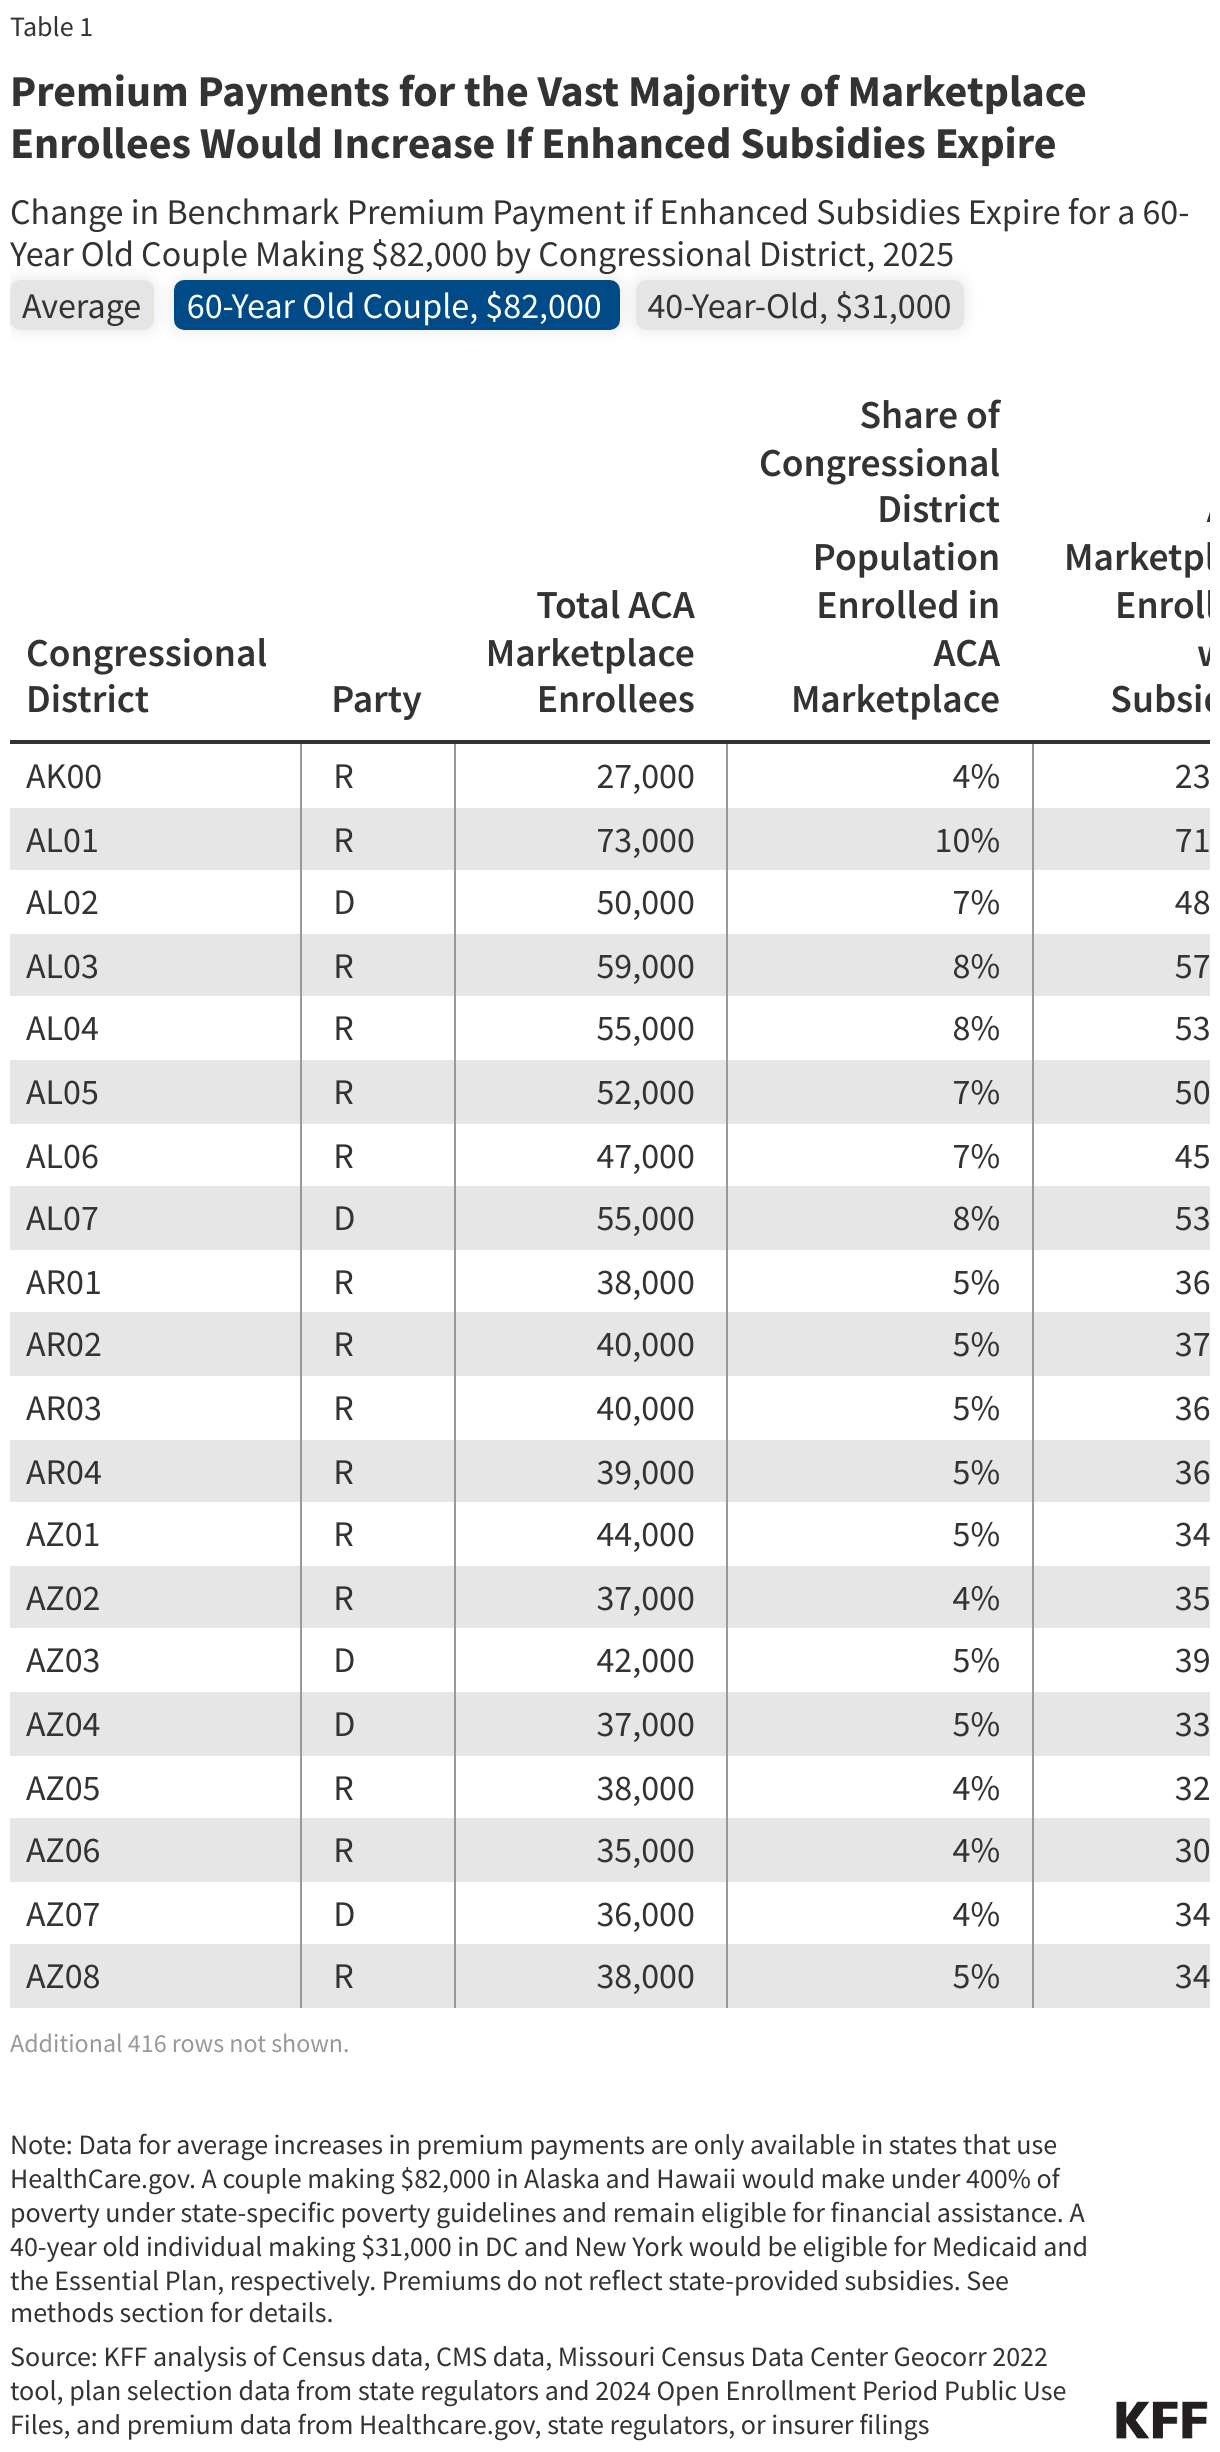
In some congressional districts, there is both a large share of the population enrolled in ACA Marketplace coverage and an expectation of very high average increases in premium payments without the enhanced tax credits. Among states that use Healthcare.gov (where average enhanced tax credit data are available), there are 39 congressional districts where at least 10% of the population is enrolled in the ACA Marketplaces and where 2024 average premium payments would have been double or more had it not been for the enhanced subsidies (Table 1). While these 39 districts are politically split (19 are represented by Democrats and 20 are represented by Republicans), these districts are mostly concentrated in a few red states. Twenty of these 39 districts are in Texas, 7 are in Florida, and 3 are in Georgia. These states are among those that have seen ACA Marketplace enrollment grow the most since the enhanced subsidies went into effect. Since 2020, ACA Marketplace enrollment has more than doubled in Florida and more than tripled in Texas and Georgia.
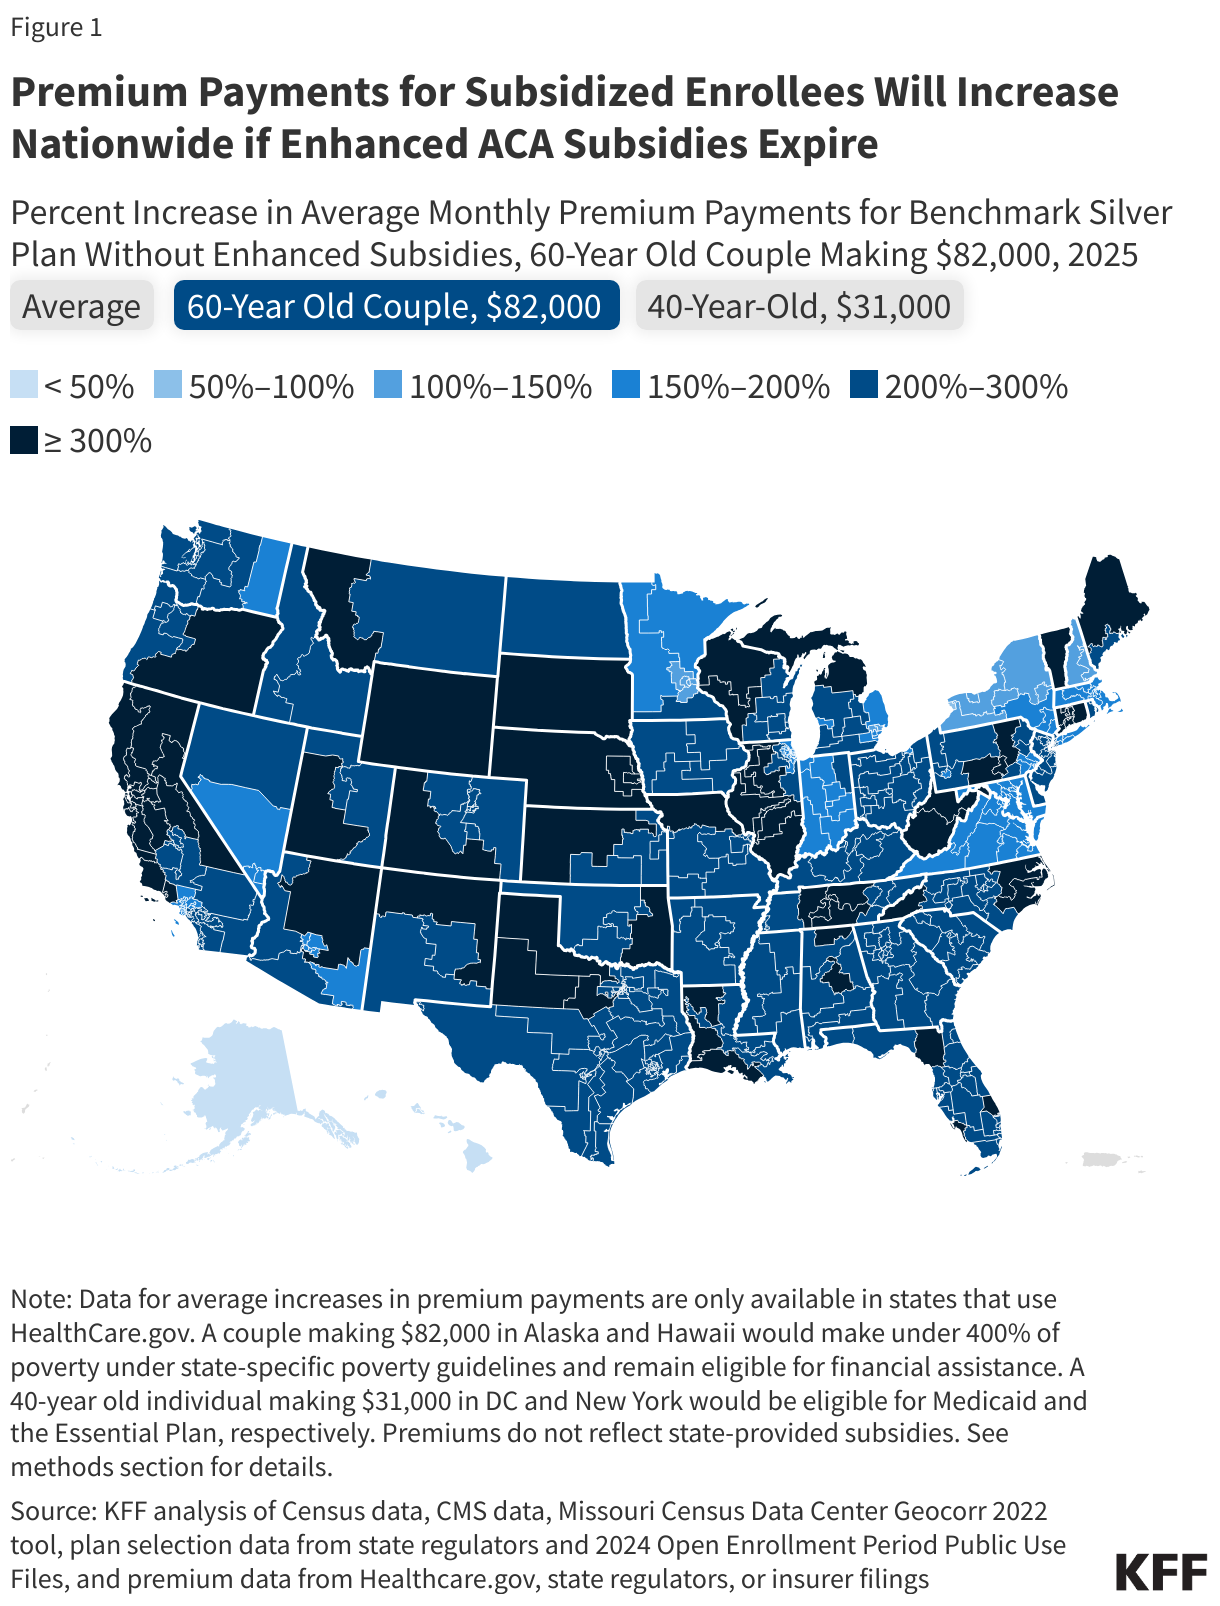
Increases in Premium Payments for An Older Couple on the “Subsidy Cliff”
The expiration of the enhanced premium tax credits would mean that people with incomes over four times the poverty level are no longer eligible for financial assistance. Prior to the availability of enhanced subsidies, ACA Marketplace premium assistance eligibility capped at 400% of poverty (which is $60,240 for a single person or $81,760 for a couple in 2025). If enhanced subsidies expire, Marketplace enrollees making just above 400% of poverty will encounter the “subsidy cliff” and would face the full price of a Marketplace plan. If the enhanced subsidies expire, a 60-year-old couple making $82,000 (401% of poverty) would see their premium payment for the benchmark silver plan, on average, at least double in the vast majority of congressional districts. The benchmark silver premium for a 60-year-old couple at this income would triple or more, on average, in 328 congressional districts.
Premium Increases for Lower-Income Enrollees
A 40-year-old Marketplace enrollee in the contiguous U.S. making $31,000 (206% of poverty) would see monthly premium payments in 2025 rise by $95 (a 165% increase) from $58 to $153. (Alaska and Hawaii have different poverty guidelines). Nationally, there are 75 congressional districts where at least 10% of the population is enrolled in the Marketplace. For a 40-year-old making $31,000, premium payments would at least double on average in all 75 districts. 62 of these districts are in Florida, Georgia and Texas. 38 of these 62 districts are represented by Republicans while 24 are represented by Democrats.
Under the enhanced phase out caps, Marketplace enrollees with incomes up to 150% of poverty currently pay zero (or near zero) dollars for a benchmark silver plan. Should the enhanced subsidies expire, enrollees in this income group will be on the hook for some of the cost of their premiums if they want to keep a silver plan. Before the enhanced subsidies went into effect, Marketplace enrollees at this income group paid about 2-4% of their income for a benchmark plan. A sizeable portion of the Marketplace population benefits from zero dollar premiums, with 42% of HealthCare.gov enrollees in 2024 paying nothing for Marketplace coverage (up from 14% of HealthCare.gov enrollees in 2021).
Methods |
| These maps visualize the 119th Congressional District boundaries in place for 2025-2026, as of September 2024. County to Congressional District designations are taken from the Missouri Census Data Center GeoCorr 2022 data.
Premium changes displayed for the average scenario are calculated using CMS data on subsidized HealthCare.gov enrollees in 2024. Average premiums by congressional district for income-specific scenarios are calculated using 2025 county-level premiums weighted by 2024 county-level plan selections, which are taken from a combination of CMS files, state-provided data, or estimated using plan selections from prior years when otherwise not available. When a county is part of multiple congressional districts, an allocation factor from the GeoCorr tool is used to apportion county-level plan selections among the congressional districts based on the 2020 decennial census. 2025 county-level premiums are collected from a combination of insurer rate filings, state regulatory authorities, or state shopping tools. Hypothetical premium payments without enhanced subsidies are calculated using indexed required contribution percentages provided by CBO. Premiums used in this map do not account for state-based premium assistance and may not reflect non-essential health benefits. Enrollment by Congressional District displayed for HealthCare.gov states is taken from CMS data, while estimates are displayed for state-based Exchanges using plan selections for each county allocated to Congressional District using the GeoCorr allocation factor. To calculate the share of people in each Congressional District enrolled in the ACA Marketplace, total Marketplace enrollment is divided by Census estimates of population for the 119th Congressional Districts. For non-HealthCare.gov states, the share of population enrolled in an ACA Marketplace plan may differ from the estimate if population growth diverge from the proportions recorded in the Census. |