A Medicaid Per Capita Cap on the ACA Expansion Population: State by State Estimates
The concurrent budget resolution that passed the House and Senate includes instructions for the House to reduce federal Medicaid spending by up to $880 billion or more over the next decade. The Senate is expected to seek at least $1.5 trillion in overall spending cuts, including substantial cuts to Medicaid. Medicaid is the primary program providing comprehensive health and long-term care to one in five people living in the U.S. and accounts for nearly $1 out of every $5 spent on health care. Medicaid is administered by states within broad federal rules and jointly funded by states and the federal government, meaning restrictions in federal Medicaid spending could leave states with tough choices about how to offset reductions through cuts to Medicaid, cuts to other programs, or tax increases.
While the detailed proposals under consideration by Congress to achieve federal Medicaid spending reductions have yet to be released, there are several options raised earlier in 2025, including eliminating the enhanced match rate for the Affordable Care Act (ACA) expansion population and implementing a per capita cap on the federal share of Medicaid spending, which were both examined in previous KFF analyses. This analysis examines the potential impacts on states and Medicaid enrollees of implementing a per capita cap on the federal share of Medicaid spending for the ACA Medicaid expansion population only, which is another proposal that has been discussed by members of Congress. Other proposals to reduce federal Medicaid spending may also be under consideration, including work requirements, a reduced federal matching rate, limits on provider taxes to finance the state share of Medicaid spending, and repeal of certain Medicaid regulations issued by the Biden administration. To achieve spending reduction targets, multiple proposals may be considered together. Future KFF analyses will examine these proposals as well.
Key takeaways
The estimated effects of a per capita cap depend highly on what assumptions are made about policy specifications, future growth in Medicaid spending, and states’ responses to federal cuts. This analysis is designed to illustrate the magnitude of the impact of a per capita cap on the ACA expansion population if all states responded by maintaining their ACA expansion coverage and spending and picking up the new expansion costs. However, in practice, states may respond to the policy change differently, and many may ultimately drop their Medicaid expansion coverage over time as the magnitude of the federal spending cuts grows.
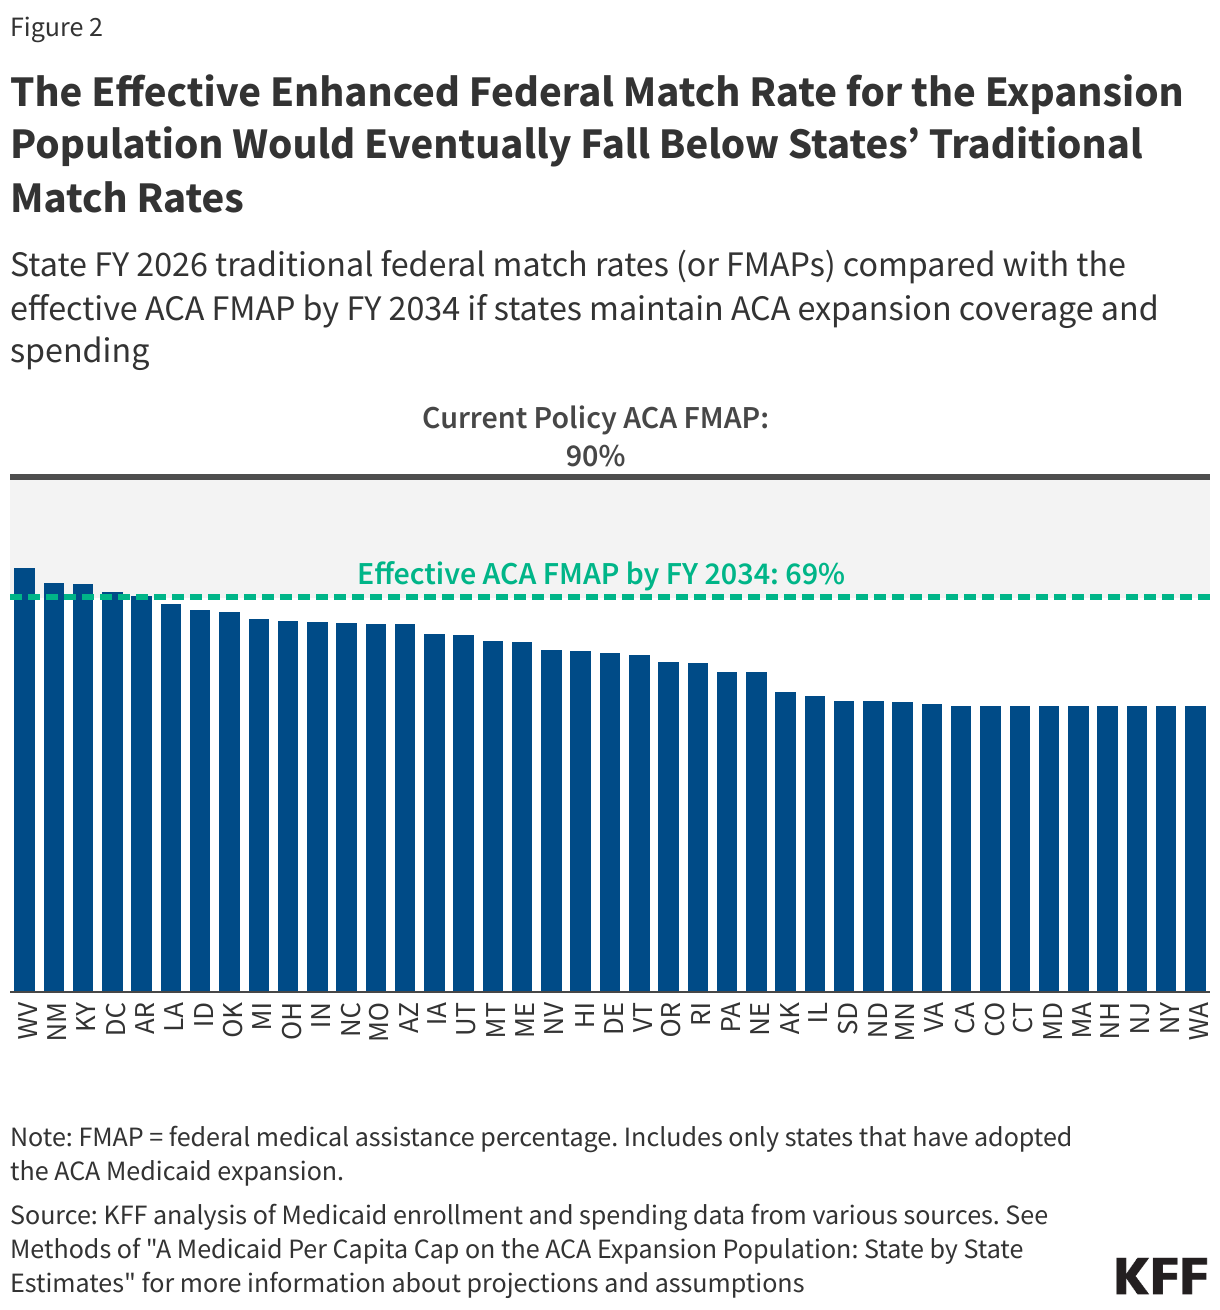
- If states maintain their ACA expansion coverage and spending at current levels, a per capita cap on the expansion population tied to medical inflation would erode the effective enhanced federal match rate for the ACA expansion population over time. Assuming Medicaid spending grows as projected by the Congressional Budget Office, by FY 2034, the federal share of spending or the effective federal match rate for expansion enrollees would be 69%, a decrease of 21 percentage points from 90%, the current federal match rate for expansion enrollees.
- The effective enhanced federal match rate for the ACA expansion population would eventually fall below states’ traditional match rates, assuming there is no limit or floor on the federal contribution to the expansion population. The effective federal match rate in FY 2034 of 69% is lower than the traditional match rate in five states, though eventually the effective federal match rate for the expansion population would be lower than the traditional match rate (which is 50% or more) in all states as the federal contribution decreases over time.
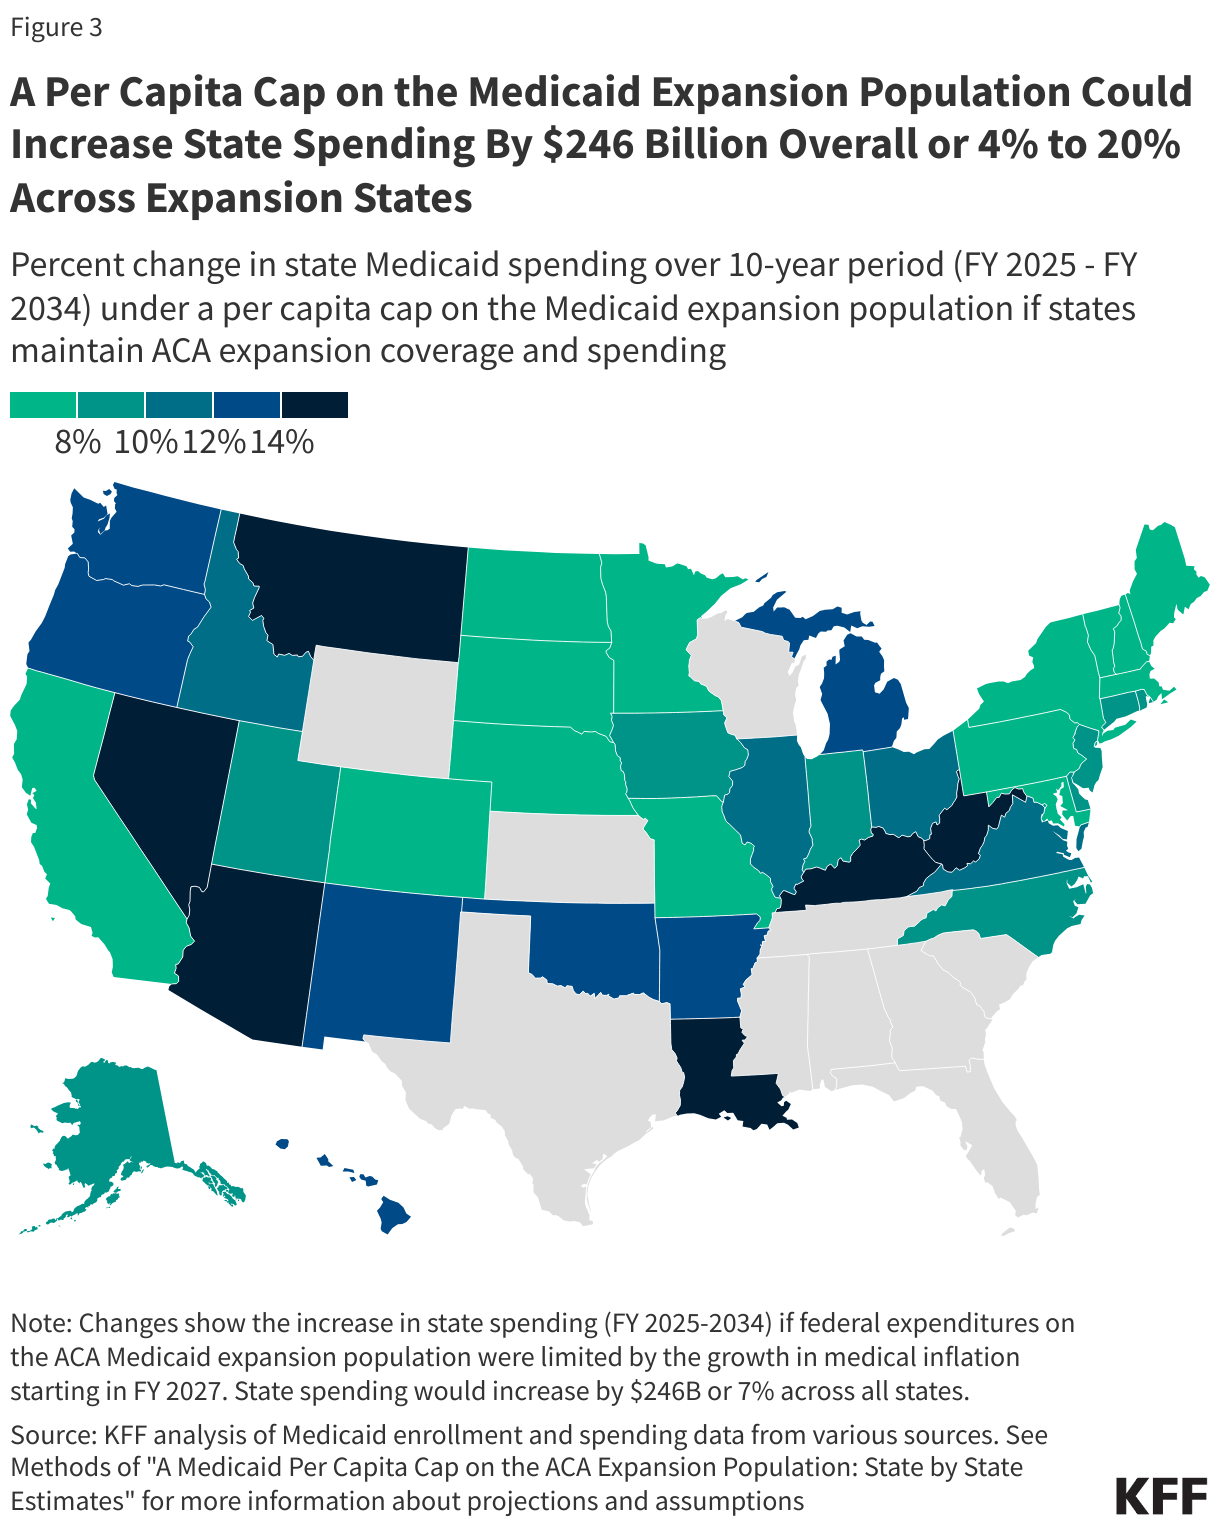
- A per capita cap on the Medicaid expansion population could shift $246 billion in costs to states over the next ten years, with state spending increasing anywhere from 4% to 20% across expansion states.
As the effective FMAP for expansion enrollees declines, the pressure on states to eliminate ACA coverage would increase. Twelve states currently have “trigger” laws in place that would automatically end expansion or require changes if the federal match rate were to drop, but it is unclear how those trigger laws would treat a per capita cap that effectively lowers the federal match rate over time. If all states ultimately drop their Medicaid expansion coverage, up to 20 million Medicaid expansion enrollees could lose Medicaid coverage and the number of uninsured would increase.
What is the proposed policy change?
Like all other Medicaid spending, Medicaid spending on the ACA Medicaid expansion population is currently shared by states and the federal government without a cap; unlike most other spending, the federal government pays 90% of the costs of expansion enrollees. States that have implemented the ACA Medicaid expansion currently receive a 90% federal match rate or “FMAP” for adults covered through the expansion. The FMAP for services used by people eligible through traditional Medicaid is determined by a formula set in law designed to provide a higher federal match rate for states with lower per capita incomes and ranges from 50% to 77%. The ACA expanded Medicaid coverage to nearly all adults with incomes up to 138% of the Federal Poverty Level ($21,597 for an individual in 2025). However, a Supreme Court ruling effectively made the decision to implement the Medicaid expansion an option for states. Forty-one states (including DC) have since adopted Medicaid expansion, and Medicaid expansion enrollees represent nearly a quarter of Medicaid enrollment and one-fifth of total Medicaid spending.
This analysis estimates the impact of implementing a per capita cap on the federal share of Medicaid spending for the ACA expansion population. While specifics on the implementation of this policy would be included in a legislative proposal, details have yet to be released, and assumptions made here may differ from details included in any proposed legislation. To estimate a per capita (i.e., per enrollee) cap on the expansion group, this analysis first establishes FY 2025 per enrollee spending as the base year estimate; then, starting in FY 2027, the analysis limits federal spending growth for expansion adults to the consumer price index (CPI-U) plus 0.4 percentage points, which is KFF’s estimate of the difference between CPI-U and medical inflation (CPI-M) over the past 20 years (see Methods). Federal spending for all other eligibility groups remains as projected under current policy. There are a number of other Medicaid policy changes that have been suggested, and policy estimates would likely differ depending on the combination of policies and their interactive effects. The effects of a per capita cap on Medicaid spending and enrollment are also highly sensitive to policy design, inflation rates, and how states respond to the cuts; and estimates are highly sensitive to assumptions about those factors. We assume that Medicaid expansion spending per enrollee will grow at 5% per year on average over the period, based on CBO projections. A cap based on CPI-U plus 0.4 percentage points is projected to grow by 2% per year on average.
What is the potential impact on Medicaid spending?
This analysis does not make assumptions about specific state behavioral responses to a per capita cap on the ACA expansion population and instead examines the potential impact on Medicaid spending if all states maintained their ACA expansion coverage and spending at current levels in response to this policy change. This analysis assumes states would maintain expansion group per enrollee spending and eligibility at current levels, picking up new costs due to the federal cap on per enrollee spending. Enrollment and total spending would remain constant while costs would shift from the federal government to the states, and states would have to make offsetting cuts in other parts of Medicaid or in programs other than Medicaid or raise revenues. The analysis is designed to illustrate the magnitude of the impact of the policy change if states maintain their Medicaid expansion coverage and spending levels; however, in practice, state responses may vary. While some states may choose to continue ACA Medicaid expansion coverage with substantially reduced federal funding, many states may seek to restrain the growth in Medicaid expansion spending by reducing provider payment rates or eliminating the expansion altogether as the magnitude of the federal spending cuts compounds over time.
If states maintain ACA expansion coverage and spending at current levels, a per capita cap on the expansion population would erode the effective enhanced federal match rate for the expansion population over time (Figure 1). Per capita caps are typically designed to constrain federal Medicaid spending growth to a rate slower than is expected under current law, which is how they achieve federal savings. As time passes, the effects compound. If states maintain their ACA expansion coverage and spending, the federal share of Medicaid expansion spending would decrease while the state share of spending would increase to offset the loss of federal funds. By FY 2034, the final year in the analysis, the federal share of spending or the effective federal match rate for expansion enrollees would be 69%, a decrease of 21 percentage points from 90%, the current federal match rate for expansion enrollees.

Under these assumptions, the effective enhanced federal match rate for the expansion population would eventually fall below states’ traditional match rates. This analysis does not assume there is any kind of limit or floor on the federal contribution to the expansion population, meaning the federal share of spending on the expansion population would continue to decline over time. This would eventually result in the effective enhanced federal match rate for the expansion population falling below states’ traditional federal match rates. The effective federal match rate in FY 2034 of 69% is lower than the FY 2026 traditional match rate in five states: West Virginia (74%), New Mexico (72%), Kentucky (71%), District of Columbia (70%, which is set in statute), and Arkansas (69%). Another nine states have traditional match rates that are within 5 percentage points of 69%, including Louisiana (68%), Idaho (67%), Oklahoma (67%), Michigan (65%), Ohio (65%), Indiana (65%), North Carolina (65%), Missouri (64%), and Arizona (64%). The federal share of spending on the expansion population would continue to decline beyond FY 2034, resulting in more states where the effective federal match rate for the expansion population is lower than the traditional match rate over time.
If states maintain their Medicaid expansion spending and coverage, a per capita cap on the Medicaid expansion population could shift $246 billion in costs to states over the next ten years. Federal Medicaid spending could decrease by 4% or $246 billion over the 10-year period, and states would pay those costs, increasing the state share by 7% across all states. All expansion states would be impacted, but the increase in state spending would vary across states, ranging from 4% in Massachusetts and South Dakota to 20% in Louisiana. States with larger shares of expansion enrollment and spending would experience the largest shifts in spending from the federal government to the state.
What are other implications to consider?
As the effective FMAP for expansion enrollees declines, the pressure on states to eliminate ACA coverage would increase. As the effective ACA FMAP declines, states would face increasing difficulties raising the necessary state tax revenues or decreasing spending on non-Medicaid services such as education needed to offset federal cuts, resulting in increasing pressure to eliminate ACA expansion coverage.
Pressure to eliminate ACA expansion coverage might be greatest in the twelve states that currently have “trigger” laws in place that would automatically end expansion or require changes if the federal match rate were to drop. While not a direct change to the expansion FMAP, this change would reduce the federal contribution for expansion enrollees and could put people in states with trigger laws at greater risk of losing coverage. Amid the threat of changes to federal support for Medicaid expansion, some states are actively debating their Medicaid expansion trigger laws. Three states (South Dakota, Missouri, and Oklahoma) have passed constitutional amendments that require the state to cover the Medicaid expansion population, which means they could not easily drop their ACA expansion coverage and would have to find a way to offset the additional costs.
If all states ultimately drop their Medicaid expansion coverage, up to 20 million Medicaid expansion enrollees could lose Medicaid coverage and the number of uninsured would increase. Prior KFF analysis shows that if all states drop their Medicaid expansion coverage, federal Medicaid spending would decrease a quarter ($1.7 trillion) over a 10-year period and up to nearly a quarter of all Medicaid enrollees (20 million people) could lose Medicaid coverage. It’s unknown whether states would increase eligibility for other groups, such as parents and people with disabilities to offset some of the coverage losses associated with eliminating the expansion. While some people losing Medicaid would be eligible for ACA marketplace coverage (those with incomes 100-138% of the poverty level) and others may be able to obtain employer-sponsored health insurance, many expansion enrollees would become uninsured, with some enrollees with incomes below poverty falling into the coverage gap. A large body of prior research shows that Medicaid expansion has helped to reduce the uninsured rate and improve health care access, affordability, and financial security among the low-income population. More recent research shows improvements in health outcomes and continues to show positive effects for providers (particularly rural hospitals) and for sexual and reproductive health.
The effects of this policy change could be larger if paired with other Medicaid cuts, and there would be interactive effects across policies that affect the ACA expansion population, such as Medicaid work requirements. A number of House Republicans have expressed support for work requirements as a condition of eligibility for Medicaid. Work requirement proposals would likely apply to ACA Medicaid expansion enrollees as well as other adults. Prior estimates show that work requirements result in lower federal spending, an increase in the number of uninsured, and no increase in employment. Because work requirements and a per capita cap on expansion enrollees would target the same population, it is likely that these two policies would have substantial interactive effects resulting in spending and coverage implications for ACA expansion enrollees. In addition, if Congress does not extend enhanced ACA premium tax credits due to expire at the end of this year, ACA marketplace coverage would be less affordable for people who lose Medicaid expansion coverage but are eligible for ACA tax credits.
Appendix

Methods |
| Data: To project Medicaid enrollment, spending, and spending per enrollee by state and eligibility group, this analysis uses the Medicaid CMS-64 new adult group expenditure data collected through MBES for FY 2023 (downloaded in December 2024), Medicaid new adult group enrollment data collected through MBES for June 2024 (downloaded in December 2024), the 2019-2021 T-MSIS Research Identifiable Demographic-Eligibility and Claims Files, and the June 2024 Congressional Budget Office (CBO) baseline.
Overview of Approach:
Definitions and Limitations:
We provide more details about the baseline model below. 1. Estimate initial Medicaid spending and enrollment by eligibility group using the most recent years’ data available (FY 2023 for spending data and FY 2024 for enrollment data).
2. Calculate initial spending per enrollee in FY 2024.
3. Project total spending and spending per enrollee for fiscal years 2025 through 2034 using CBO growth rates and use those estimates to calculate future years’ enrollment.
4. Split total Medicaid spending over the 10-year period into federal and state spending.
We provide more details about the policy change scenario below. 1. Calculate Medicaid spending under a per capita cap if states maintain ACA expansion coverage and spending. This follows the methodology in KFF’s previous per capita cap analysis, though only applies the cap to the ACA expansion population.
2. Calculate differences in Medicaid enrollment and spending (including federal and state spending) relative to the baseline projections. |