Quick Take: Geographic Variation in Dual Eligible Enrollment
Over 9 million elderly Americans and younger persons with disabilities are jointly enrolled in the Medicaid and Medicare programs. These “dual eligibles” receive coverage for most medical services from Medicare, and they also receive Medicaid assistance for Medicare premiums and cost-sharing and coverage of benefits not offered under Medicare (such as long-term care). Dual eligibles are among the sickest and poorest individuals covered by Medicare and Medicaid and, as a group, account for a disproportionate share of spending in both programs. For this reason, policymakers are focusing on dual eligible individuals in planning new initiatives to improve care coordination and quality, expand the use of managed care, or enhance current service delivery programs with the goal of achieving cost savings. States, which administer the Medicaid program jointly with the federal government, are playing an active role in the development of these proposals.
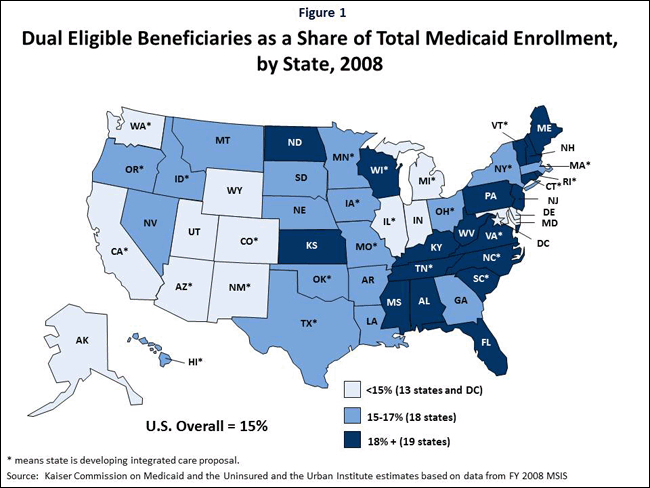
There is significant variation across states in the role that dual eligibles play within state Medicaid programs. Figure 1 shows that dual eligibles account for a varying share of Medicaid enrollees by state, from a low of 10 percent in Arizona and Utah to a high of 26 percent in Maine. These variations reflect a state’s demographic profile as well as state policy choices in Medicaid eligibility and coverage. In general, states in the East—which tend to have older overall populations—have a higher share of Medicaid enrollees who are dual eligibles than those in the Midwest and West. However, states with a relatively low share of Medicaid enrollees who are duals (such as California and Illinois) may have a much higher number of dual eligibles enrolled in Medicaid than states with a higher share, since these states have larger overall populations.
Figure 1 also indicates whether a state has developed a proposal for a federal demonstration program to integrate Medicare and Medicaid services and financing for dual eligibles. As of May 2012, 26 states were actively developing such proposals. Notably, many states developing proposals have a relatively low share of Medicaid enrollees who are dual eligibles, while many states that do have a high share of dual eligible Medicaid enrollees are not currently participating.

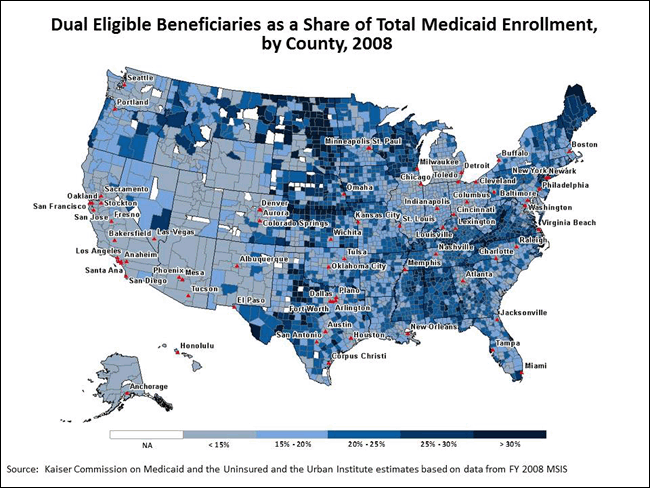
In addition to the variation across states in the share of Medicaid beneficiaries who are dually eligible, there is also variation between counties within states. Figure 2 shows county-level data on the share of Medicaid beneficiaries who are dual eligibles. This map also indicates the location of cities (marked by red dots) with populations greater than 250,000. It demonstrates how state-level averages can mask substantial geographic variation within a state. While some states, such as Ohio and Maine, have a fairly consistent share of dual eligible Medicaid beneficiaries across most counties, other states such as Idaho and Texas show wide county level variation. For example, in Texas, in Moore County, fewer than 10 percent of Medicaid enrollees are duals, versus nearly 46 percent in Terrell County. In many counties across the nation, the share of Medicaid beneficiaries who are dually eligible is over 30 percent, more than twice the national average. A handful of counties—primarily in largely rural areas such as Nebraska, North Dakota, South Dakota, and Montana—have more than half their Medicaid population dually enrolled in Medicare.
County-level data on dual eligible enrollment may help policymakers develop state or local initiatives. Some existing programs for dual eligibles, such as PACE or certain managed care initiatives, are locally-based, and county-level prevalence information can help assess whether they are reaching areas with a high share of dual eligibles. As states plan future efforts to improve care and financing for this population, county-level information can help in further targeting efforts or determining how to phase-in statewide initiatives.

More information on the methods underlying this analysis is available in the Methods box below. Data on specific states (.xls) or counties (.xls) is available.
Methods
The dual eligible enrollment and Medicaid beneficiary data in these maps comes from estimates made by the Kaiser Commission on Medicaid and the Uninsured and the Urban Institute using data from FY 2008 MSIS. Dual eligibles include both “full duals” (Medicare beneficiaries eligible for full Medicaid benefits) and “partial duals” (Medicare beneficiaries eligible for only premium and/or cost sharing assistance from Medicaid) whose last-known monthly Medicaid enrollment status showed that they were dual eligible beneficiaries during FY2008. County information in the MSIS was reconciled with county information from the Census Bureau’s American Community Survey 5-year estimate file, to address inconsistencies in county codes across data sets. The 100 missing counties (3% of all counties) include those with insufficient sample to display data as well as a very small number (18) with missing Medicaid data. There were 44,600 dual eligibles (<1% of all dual eligibles) in FY2008 MSIS who are not represented in the county data because their county information was missing, incorrect, or excluded due to privacy purposes.


