Medicare Advantage 2017 Spotlight: Enrollment Market Update
Medicare Advantage plans have played an increasingly larger role in the Medicare program as the share of Medicare beneficiaries enrolled in Medicare Advantage has steadily climbed over the past decade. The trend in enrollment growth is continuing in 2017, and has occurred despite reductions in payments to plans enacted by the Affordable Care Act of 2010 (ACA). This Data Spotlight reviews national and state-level Medicare Advantage enrollment trends as of March 2017 and examines variations in enrollment by plan type and firm. It analyzes the most recent data on premiums, out-of-pocket limits, and quality ratings. Key findings include:
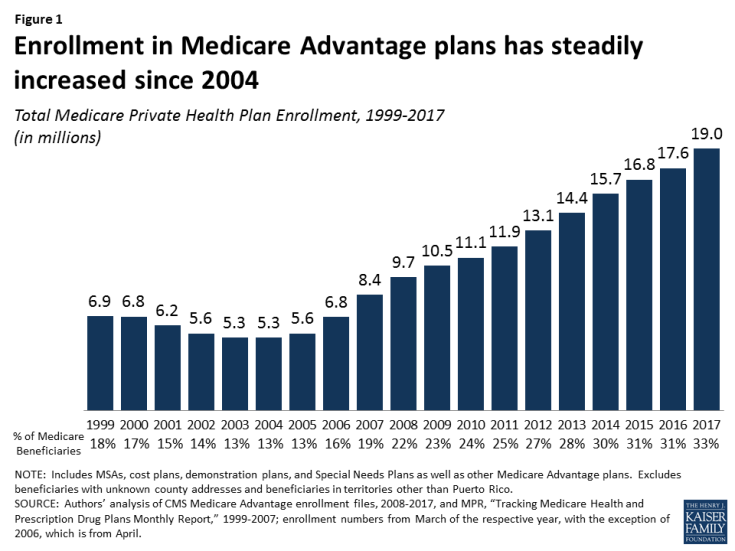
- Enrollment Growth. Since the ACA was passed in 2010, Medicare Advantage enrollment has grown 71 percent. As of 2017, one in three people with Medicare (33% or 19.0 million beneficiaries) is enrolled in a Medicare Advantage plan (Figure 1).
- Market Concentration. UnitedHealthcare and Humana together account for 41 percent of enrollment in 2017; enrollment continues to be highly concentrated among a handful of firms, both nationally and in local markets. In 17 states, one company has more than half of all Medicare Advantage enrollment – an indicator that these markets may not be very competitive.
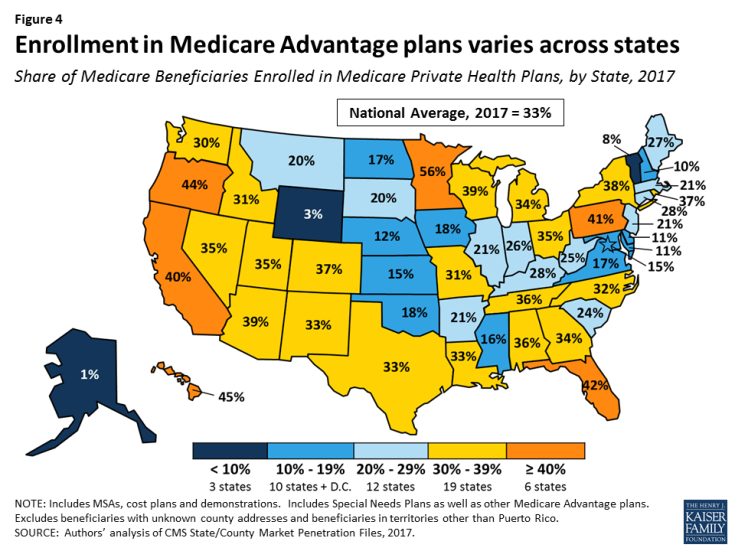
- Medicare Advantage Penetration. At least 40 percent of Medicare beneficiaries are enrolled in Medicare private plans in six states: CA, FL, HI, MN, OR, and PA. In contrast, fewer than 20 percent of Medicare beneficiaries are enrolled in Medicare Advantage plans in 13 states, plus the District of Columbia.
- Premiums and Cost-Sharing. While average Medicare Advantage premiums paid by MA-PD enrollees have been relatively stable for the past several years ($36 per month in 2017), enrollees may be liable for more of Medicare’s costs, with average out-of-pocket limits increasing 21 percent and average Part D drug deductibles increasing more than 9-fold since 2011; however, there was little change in out-of-pocket limits and Part D drug deductibles from 2016 to 2017.
Medicare Advantage enrollment is projected to continue to grow over the next decade, rising to 41 percent of all Medicare beneficiaries by 2027.1 As private plans take on an even larger presence in the Medicare program, it will be important to understand the implications for beneficiaries covered under Medicare Advantage plans and traditional Medicare, as well as for plans, health care providers and program spending.
Overall Trends in Enrollment
Nationwide Enrollment
In 2017, one in three (33%) Medicare beneficiaries – 19.0 million people – is enrolled in a Medicare Advantage plan (Figure 1). Total Medicare Advantage enrollment grew by about 1.4 million beneficiaries, or 8 percent, between 2016 and 2017. The growth reflects the ongoing expansion of the role of Medicare Advantage plans in the Medicare program.2
Trends in Enrollment by Plan Type
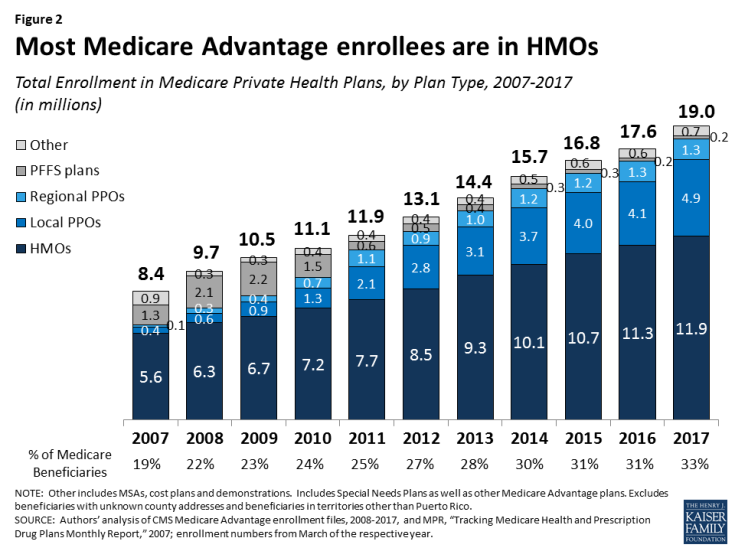
As has been the case each year since 2007, about two out of three (63%) Medicare Advantage enrollees are in HMOs in 2017. One-third of enrollees are in PPOs – with more in local PPOs (26%) than regional PPOs (7%) – and the remainder are in Private Fee-For Service (PFFS) plans (1%) and other types of plans (3%), including cost plans and Medicare Medical Savings Accounts (MSAs).
- HMOs. Enrollment in HMOs increased by 0.6 million to 11.9 million beneficiaries in 2017 (Figure 2 and Table A1).
- PPOs. Enrollment in local PPOs increased by 0.8 million, with 4.9 million beneficiaries in local PPOs. In 2017, 1.3 million beneficiaries are in regional PPOs, similar to 2016.
A key difference between an HMO and a PPO is that the latter covers part of the cost of care from providers outside of the plan’s provider network. Local PPOs, like HMOs, are required to serve areas no smaller than a county, whereas regional PPOs are required to serve areas defined by one or more states.
Group Enrollment
About 3.7 million of the 19.0 million enrollees (19%) are in a group plan in 2017 (Figure 3 and Table A2). Most Medicare beneficiaries who enroll in Medicare Advantage plans do so as individuals, but some enroll through group plans, comprised largely of plans sponsored by unions and employers for retirees. Under these arrangements, employers or unions contract with an insurer and Medicare pays the insurer a fixed amount per enrollee to provide benefits covered by Medicare, and the employer or union, and sometimes also the retiree as well, pays a premium for any additional benefits or lower cost-sharing. In contrast to the Medicare Advantage individual market where HMOs dominate, more than two-thirds (69%) of group plan enrollees are in local PPOs.
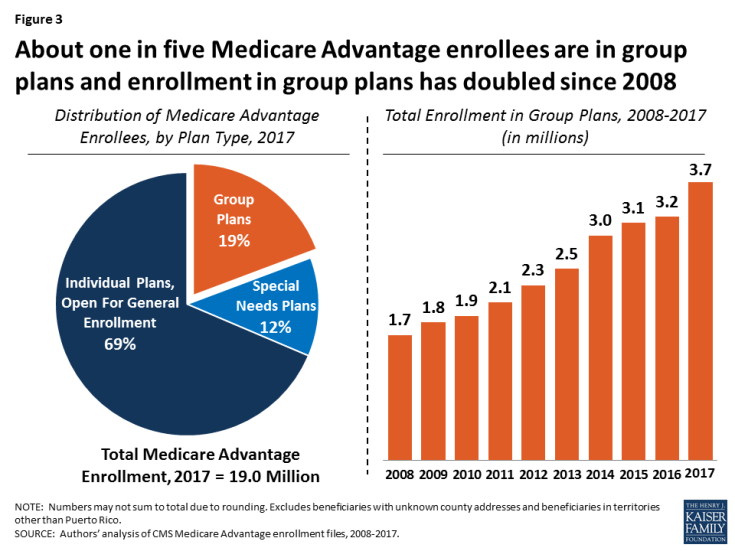
Figure 3: About one in five Medicare Advantage enrollees are in group plans and enrollment in group plans has doubled since 2008
Some states have a much larger than average share of Medicare Advantage enrollees in group plans, including Alaska (100%), West Virginia (53%), Michigan (49%), Illinois (43%), Kentucky (40%), and New Jersey (36%). Between 2016 and 2017, enrollment in Medicare Advantage group plans grew at least as much as enrollment in individual plans in all states except ten (HI, KY, MI, MN, MT, NE, OR, UT, WI, and WV) and the District of Columbia. Over this period, the share of Medicare beneficiaries in group plans increased considerably in Alabama and New Jersey due to changes in the states’ benefits for former state employees for the 2017 plan year.
In Alabama, enrollment in group plans increased by almost 90,000 beneficiaries between 2016 and 2017, due in large part to the Public Education Employees’ Health Insurance Plan (PEEHIP) automatically enrolling their retirees into a Medicare Advantage group plan operated by UnitedHealthcare for the 2017 plan year. In New Jersey, enrollment in group plans increased by more than 60,000 beneficiaries, mostly due to the State Health Benefits Program only offering coverage to retirees through Medicare Advantage group plans beginning in 2017. These changes reflect a larger trend by large employers and unions to limit their liability for retirees’ health costs by contracting with Medicare Advantage plans.
In addition, some employers or unions are addressing cost concerns by ending their group coverage for retiree health – either by terminating coverage altogether, or by offering retirees a defined contribution that could be used to purchase a Medigap policy (to supplement traditional Medicare) or a Medicare Advantage plan. This dynamic, which alters the share and composition of Medicare beneficiaries in the group and individual Medicare Advantage markets, respectively, is not captured in available Medicare Advantage data. This data gap makes it more difficult to understand the reasons behind trends in enrollment in both markets.3
Medicare Advantage Enrollment Growth by State
Medicare Advantage enrollment increased in all states in 2017, with the exception of North Dakota where enrollment declined slightly (by 1%) (Table 1). In eight states (AK, AL, DE, MD, NH, NJ, VT, and WY) enrollment increased by 20 percent or more. Since the penetration rates in these states were far below the national average and some have relatively few enrollees, their growth rates can be sensitive to small changes in enrollment.
In most states, the majority of enrollees are in HMOs; however, in 12 states (AK, AL, HI, IL, IN, IA, KS, KY, MI, MT, NC, and WV), the majority of enrollees are in local PPOs (Table A1). Additionally, in a few states (MN, ND, and SD), the preponderance of private plan enrollees is in cost plans, which are paid differently from Medicare Advantage plans and allow enrollees to see any Medicare provider and pay the cost-sharing they would pay in traditional Medicare. Regional PPOs also play an outsized role in some states, with at least 30 percent of enrollees in regional PPOs in 4 states (AR, MS, SC, and VT).
Enrollment Growth by County, based on Medicare Spending Quartiles
The Affordable Care Act reduced payments to all Medicare Advantage plans, and varied payment policy with the level of traditional Medicare spending in counties, grouped into four quartiles. As of 2017, payments are fully phased-in and range from 95 percent of traditional Medicare spending for counties in the top quartile of Medicare spending to 115 percent of traditional Medicare spending for counties in the bottom quartile.
Between 2011 and 2017, the counties in the middle quartiles saw the largest growth in Medicare Advantage enrollment (65% and 67% for the third and second quartiles, respectively) with the lowest growth in the lowest cost counties (49%; Table A3). The relationship between county cost and growth rates appears to vary between HMOs (which have a longer history with the program) and other plan types (mostly PPOs) that are newer. While HMOs showed little relationship between county cost and enrollment growth over the 2011-2017 period, enrollment in other types of plans grew more rapidly in higher than lower-cost counties.
| Table 1. Medicare Advantage Enrollment and Penetration Rate, by State, 2016-2017 | ||||||
| State | 2016 Total Enrollment | 2017 Total Enrollment | Change in Total Enrollment, 2016-2017 |
Percent Change in Enrollment, 2016-2017 |
2016 Penetration Rate | 2017 Penetration Rate |
| Total U.S. | 17,625,200 | 18,973,154 | 1,347,954 | 8% | 31% | 33% |
| Alabama | 257,218 | 358,325 | 101,107 | 39% | 26% | 36% |
| Alaska | 93 | 655 | 562 | 604% | <1% | 1% |
| Arizona | 442,282 | 463,447 | 21,165 | 5% | 38% | 39% |
| Arkansas | 121,543 | 130,465 | 8,922 | 7% | 20% | 21% |
| California | 2,244,709 | 2,348,224 | 103,515 | 5% | 39% | 40% |
| Colorado | 293,275 | 309,369 | 16,094 | 5% | 36% | 37% |
| Connecticut | 165,722 | 180,612 | 14,890 | 9% | 26% | 28% |
| Delaware | 16,792 | 20,739 | 3,947 | 24% | 9% | 11% |
| District of Columbia | 12,292 | 13,914 | 1,622 | 13% | 14% | 15% |
| Florida | 1,670,266 | 1,793,258 | 122,992 | 7% | 41% | 42% |
| Georgia | 508,161 | 554,075 | 45,914 | 9% | 33% | 34% |
| Hawaii | 113,451 | 116,082 | 2,631 | 2% | 46% | 45% |
| Idaho | 90,435 | 92,580 | 2,145 | 2% | 31% | 31% |
| Illinois | 405,756 | 454,965 | 49,209 | 12% | 19% | 21% |
| Indiana | 279,338 | 311,612 | 32,274 | 12% | 24% | 26% |
| Iowa | 98,790 | 104,458 | 5,668 | 6% | 17% | 18% |
| Kansas | 67,733 | 75,281 | 7,548 | 11% | 14% | 15% |
| Kentucky | 229,916 | 245,786 | 15,870 | 7% | 26% | 28% |
| Louisiana | 249,920 | 271,778 | 21,858 | 9% | 31% | 33% |
| Maine | 75,116 | 87,548 | 12,432 | 17% | 24% | 27% |
| Maryland | 88,998 | 106,861 | 17,863 | 20% | 9% | 11% |
| Massachusetts | 246,018 | 266,741 | 20,723 | 8% | 20% | 21% |
| Michigan | 621,118 | 673,166 | 52,048 | 8% | 32% | 34% |
| Minnesota | 510,713 | 542,941 | 32,228 | 6% | 55% | 56% |
| Mississippi | 85,208 | 93,708 | 8,500 | 10% | 15% | 16% |
| Missouri | 337,119 | 368,222 | 31,103 | 9% | 29% | 31% |
| Montana | 39,200 | 42,742 | 3,542 | 9% | 19% | 20% |
| Nebraska | 37,169 | 39,967 | 2,798 | 8% | 12% | 12% |
| Nevada | 157,379 | 169,207 | 11,828 | 8% | 34% | 35% |
| New Hampshire | 20,756 | 27,996 | 7,240 | 35% | 8% | 10% |
| New Jersey | 245,651 | 326,486 | 80,835 | 33% | 16% | 21% |
| New Mexico | 120,099 | 129,973 | 9,874 | 8% | 32% | 33% |
| New York | 1,243,714 | 1,325,900 | 82,186 | 7% | 37% | 38% |
| North Carolina | 547,079 | 587,632 | 40,553 | 7% | 30% | 32% |
| North Dakota | 21,627 | 21,353 | -274 | -1% | 18% | 17% |
| Ohio | 748,125 | 787,209 | 39,084 | 5% | 34% | 35% |
| Oklahoma | 116,489 | 124,677 | 8,188 | 7% | 17% | 18% |
| Oregon | 339,461 | 355,438 | 15,977 | 5% | 44% | 44% |
| Pennsylvania | 1,022,462 | 1,065,053 | 42,591 | 4% | 40% | 41% |
| Rhode Island | 72,954 | 77,285 | 4,331 | 6% | 35% | 37% |
| South Carolina | 224,130 | 243,030 | 18,900 | 8% | 23% | 24% |
| South Dakota | 31,158 | 32,694 | 1,536 | 5% | 20% | 20% |
| Tennessee | 440,394 | 465,345 | 24,951 | 6% | 35% | 36% |
| Texas | 1,174,621 | 1,284,153 | 109,532 | 9% | 32% | 33% |
| Utah | 120,237 | 127,850 | 7,613 | 6% | 34% | 35% |
| Vermont | 9,671 | 11,676 | 2,005 | 21% | 7% | 8% |
| Virginia | 219,382 | 241,530 | 22,148 | 10% | 16% | 17% |
| Washington | 360,712 | 382,571 | 21,859 | 6% | 30% | 30% |
| West Virginia | 103,805 | 107,246 | 3,441 | 3% | 25% | 25% |
| Wisconsin | 410,771 | 434,584 | 23,813 | 6% | 38% | 39% |
| Wyoming | 2,079 | 2,596 | 517 | 25% | 2% | 3% |
| NOTE: Includes employer-sponsored plans, special needs plans, and other private plans. Total U.S. includes Puerto Rico. SOURCE: Authors’ analysis of CMS Medicare Advantage enrollment and Landscape files, 2016-2017. |
||||||
Medicare Advantage Penetration
In half of all states, at least 30 percent of Medicare beneficiaries are enrolled in Medicare private plans, including 6 states (CA, FL, HI, MN, OR, and PA) in which at least 40 percent of beneficiaries are enrolled in Medicare private plans (Figure 4). While Medicare Advantage enrollment is increasing in many states, Medicare Advantage enrollment continues to be very low (less than 10 percent of Medicare beneficiaries) in 3 states (AK, VT, and WY). This variation reflects the history of managed care in the state, the uneven prevalence of employer-sponsored insurance for retirees, and growth strategies pursued by various Medicare Advantage sponsors, among other factors.
Within states, Medicare Advantage penetration varies across counties. For example, 56 percent of beneficiaries in the Bronx in New York City, New York are enrolled in Medicare Advantage plans whereas only 19 percent of beneficiaries in Suffolk County (Long Island), New York are enrolled (Table A4).
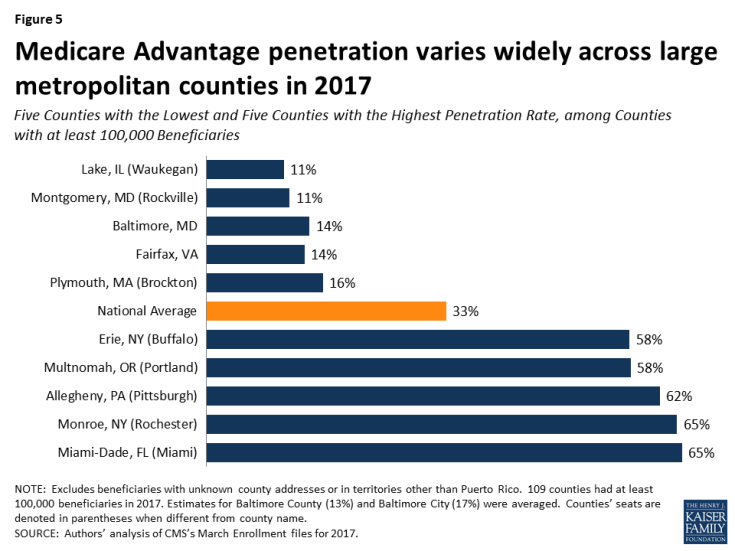
Medicare Advantage penetration also varies across metropolitan counties, such that not all metropolitan counties have high Medicare Advantage penetration rates. For example, only 14 percent of Medicare beneficiaries are enrolled in Medicare private plans in Baltimore, Maryland, but 65 percent of Medicare beneficiaries are enrolled in Medicare private plans in Miami-Dade County, Florida (Figure 5).
Medicare Advantage Enrollment, by Firm and Affiliates
Enrollment by Firm and Affiliates
Medicare Advantage enrollment tends to be highly concentrated among a small number of firms (Figure 6). In 2017, UnitedHealthcare, Humana, and the BCBS affiliates (including Anthem BCBS plans) together account for well over half (57%) of Medicare Advantage enrollment. Eight firms or affiliates accounted for about three-quarters (77%) of the market, including UnitedHealthcare, Humana, Blue Cross Blue Shield (BCBS) affiliated plans (excluding Anthem), Kaiser Permanente, Aetna, Anthem, Cigna, and Wellcare. Enrollment in UnitedHealthcare’s plans grew more than any other firm, increasing by more than 800,000 beneficiaries between 2016 and 2017, and the firm’s share of the Medicare Advantage market increased from 21 percent in 2016 to 24 percent in 2017 (Table A5). In 2016-2017, major mergers were under regulatory review for four of these firms (Humana with Aetna, Anthem with Cigna). It is not clear how the prospect of a merger may have affected each firm’s Medicare Advantage market strategy over this period. The mergers were not allowed to proceed due to concerns about the potential effects on market competition.
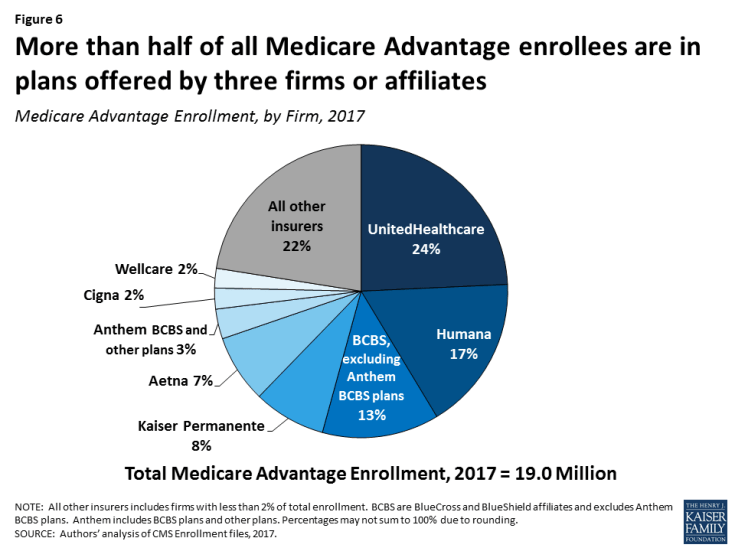
Figure 6: More than half of all Medicare Advantage enrollees are in plans offered by three firms or affiliates
Market Concentration by State
In most states, a few firms dominate Medicare Advantage enrollment (Figure 7). Similar to prior years, in every state other than Oregon, the three largest firms or BCBS affiliates account for more than 50 percent of enrollment. In 38 states and the District of Columbia, at least 75 percent of enrollees are in plans offered by one of three firms. In 17 states, one company has more than half of all Medicare Advantage enrollment – an indicator that these markets may not be very competitive (Table A6). Except for three states with small enrollments (the Dakotas and Alaska), all of these states are dominated by either UnitedHealthcare, Humana, or BCBS affiliated plans. (Medica Holding Company’s plans dominate enrollment in the Dakotas and Aetna’s plans dominate enrollment in Alaska.)
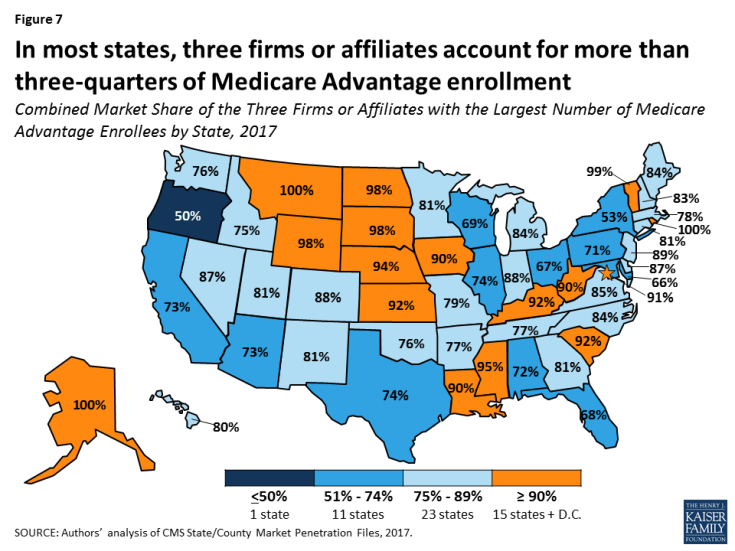
Figure 7: In most states, three firms or affiliates account for more than three-quarters of Medicare Advantage enrollment
UnitedHealthcare is a major player in the Medicare Advantage markets of 42 states and the District of Columbia; the firm has the largest share of enrollment in 24 states (up from 19 states in 2016) and is among the top three firms in an additional 18 states and the District of Columbia. Humana has the largest share of enrollment in 7 states (down from 10 states in 2016) and is among the top 3 firms in another 22 states. Plans offered by BCBS affiliates have the most enrollees in 8 states and are among the top firms in another 15 states.
Kaiser Permanente’s presence is more geographically focused than other major national firms, with a heavy concentration in California, Colorado, the District of Columbia area, Hawaii, Georgia, and Oregon. Kaiser Permanente also recently added to its presence in Washington with its acquisition of Group Health Cooperative. In some states, locally operated plans play a much larger role than the national firms, and include Martin’s Point Health Care (ME), Tufts Associated HMO (MA), Presbyterian Healthcare Services (NM), and Medica Holding Company (ND and SD). New West, which had the most Medicare Advantage enrollees in Montana between 2011 and 2015, announced in 2016 that it is going out of business and did not offer Medicare Advantage plans in 2017 Other firms appear to have offset this loss in plan options as Medicare Advantage enrollment in Montana has continued to grow. EmblemHealth, a New York-based not-for-profit plan, had the most Medicare Advantage enrollees in Connecticut from 2014 to 2016, but UnitedHealthcare replaced it in this position in 2017.
Premiums
Medicare Advantage enrollees are responsible for paying the Part B premium, in addition to any premium charged by the plan. This brief analyzes premiums for Medicare Advantage plans that offer prescription drug benefits (MA-PDs) because the vast majority (89%) of Medicare Advantage enrollees is in MA-PDs and Medicare Advantage enrollees who seek prescription drug benefits are required to get them through their plan if the plan offers prescription drugs.
Average Premium Trends
The average MA-PD enrollee pays a monthly premium of about $36 in 2017, about $1 per month less than in 2016 (Figure 8). Actual premiums paid by enrollees vary widely, across and within counties, by plan type and other plan characteristics. Average premiums range from $28 per month for HMO enrollees to $55 per month for local PPO enrollees and $41 per month for regional PPO enrollees. Overall, average premiums at the national level have been relatively steady for plan enrollees since 2012, although premiums for regional PPO enrollees have increased.
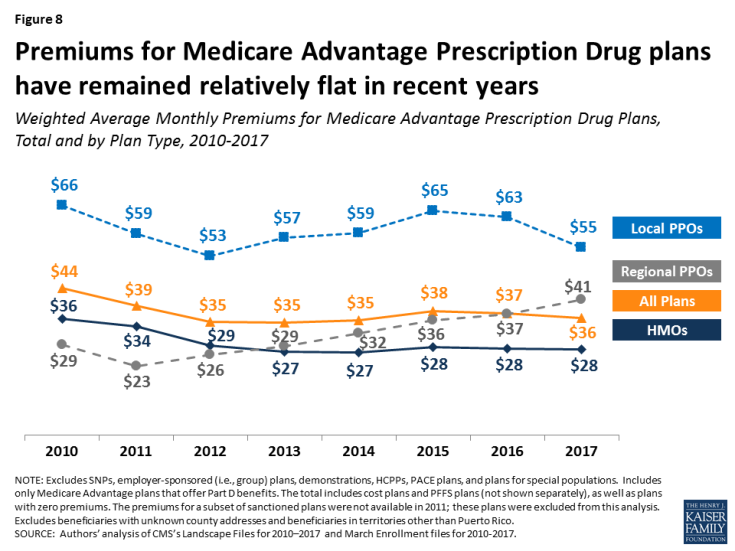
Figure 8: Premiums for Medicare Advantage Prescription Drug plans have remained relatively flat in recent years
Zero Premium Plans
In 2017, as in prior years, most Medicare beneficiaries (81%) had a choice of at least one “zero premium” MA-PD,4 plans that charge no additional premium for coverage of Medicare Part A, B, and D benefits , other than the monthly Part B premium. Plans can offer zero-premium MA-PDs by using their rebate (the difference between the plan bid and the maximum federal payment or benchmark) to reduce the Part D premium.
While seniors have said that premiums are important factor in their plan choice,5 the data indicate that other factors must also play an important role. Among MA-PD enrollees with access to a zero premium plan (97% of all MA-PD enrollees), only about half (52%) are enrolled in such a plan (Figure 9). More than one-quarter (26%) of MA-PD enrollees with access to a zero premium plan are in plans with premiums of $50 per month or more, including 10 percent with premiums of $100 per month or more. In total, only half (50%) of MA-PD enrollees are in a zero premium plan in 2017, including about 400,000 MA-PD enrollees (3%) who do not have access to a zero premium plan.
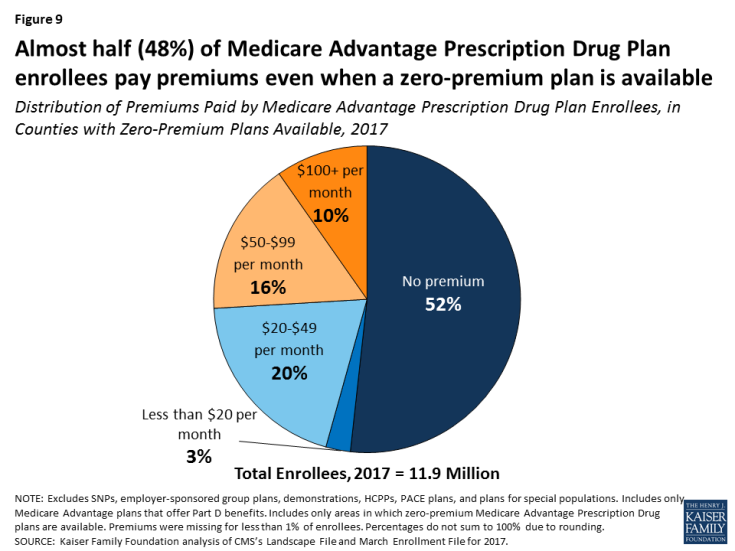
Figure 9: Almost half (48%) of Medicare Advantage Prescription Drug Plan enrollees pay premiums even when a zero-premium plan is available
Between 2016 and 2017, the share of enrollees in zero premium MA-PDs remained relatively unchanged (49% in 2016 versus 50% in 2017) (Figure 10). Similar to prior years, a larger share of HMO enrollees is enrolled in zero premium plans (59%) than regional PPO enrollees (33%) or local PPO enrollees (30%).
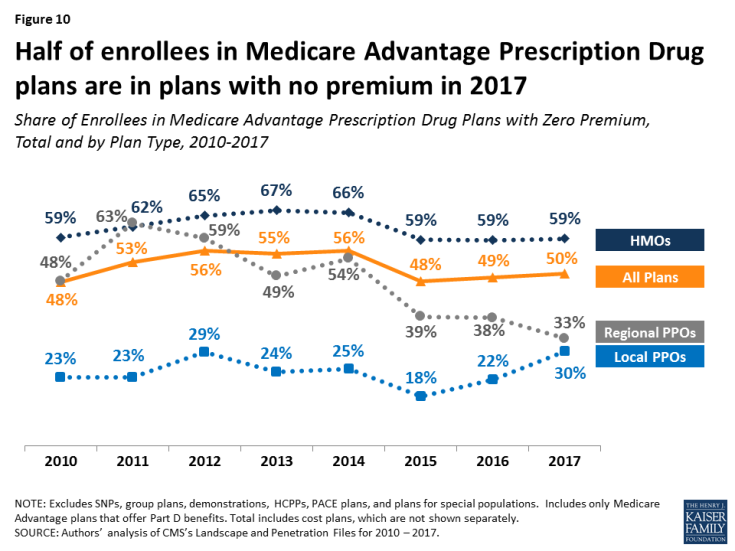
Figure 10: Half of enrollees in Medicare Advantage Prescription Drug plans are in plans with no premium in 2017
Premium Variation Across States
Comparing premiums across states is complicated by the fact that premiums reflect many factors, including the underlying costs of care in a given county relative to the national average, the level of payments to Medicare Advantage plans in the area, and firms’ strategy about whether to use plans’ rebates to offer extra benefits, reduce cost-sharing, or lower premiums. Additionally, as previously discussed, premiums vary across plan types and enrollment by plan type varies across states.
Average monthly MA-PD premiums paid per enrollee range from $6 (Florida) to $131 (Minnesota, which mainly has cost plans rather than risk-based plans), relative to the $36 per month average premium paid by enrollees in 2017 (Figure 11). Average monthly premiums exceed $70 in six states: Hawaii, Massachusetts, Michigan, Minnesota, North Dakota, and Pennsylvania. In contrast, average monthly premiums are less than $20 in nine states: Arizona, Iowa, Florida, Louisiana, Missouri, Nebraska, Nevada, New Mexico, and Texas.
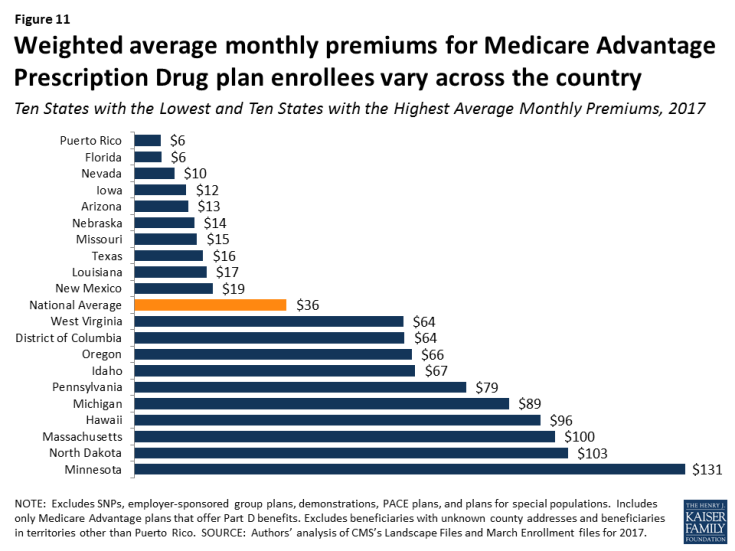
Figure 11: Weighted average monthly premiums for Medicare Advantage Prescription Drug plan enrollees vary across the country
Premiums also vary greatly within a state since plans and federal payments to plans vary by county. For example, MA-PD enrollees pay an average of $4 per month in Los Angeles County, California but $66 per month in San Francisco County, California. Similarly, MA-PD enrollees pay, on average, $20 per month in Queens County, New York (a part of New York City) but $74 per month in Albany, New York.
Cost Sharing
Medicare Advantage plans are required to provide all Medicare covered services, and have some flexibility in setting cost-sharing for specific Medicare-covered services. In addition, since 2011 Medicare Advantage plans have been required to limit enrollees’ out-of-pocket expenditures for services covered under Parts A and B – in contrast with traditional Medicare. In 2011, CMS began requiring all Medicare Advantage plans to limit enrollees’ out-of-pocket expenditures for Part A and B in-network services to no more than $6,700 annually, and recommended a limit of $3,400 or lower.6
Out-of-Pocket Limits
In 2017, the average out-of-pocket limit for MA-PD enrollees is $5,219, about the same as in 2016 ($5,223) and up from $4,313 in 2011 (Figure 12). HMO enrollees have generally had lower out-of-pocket limits than enrollees in local PPOs or regional PPOs, and this remains the case in 2017. More than half of all enrollees (52%) are in plans with limits above $5,000 in 2017, similar to 2016. More than one-third of all enrollees in 2017 (36%) are in plans with limits at the $6,700 maximum, similar to 2016 and up from 32 percent in 2015 and 17 percent in 2011 (data not shown). As out-of-pocket limits approach the maximum allowed limit, it is important to look at other dimensions of cost sharing to better understand how beneficiaries with different needs are affected by year-to-year changes and trends in Medicare Advantage cost-sharing for benefits covered under Parts A and B.
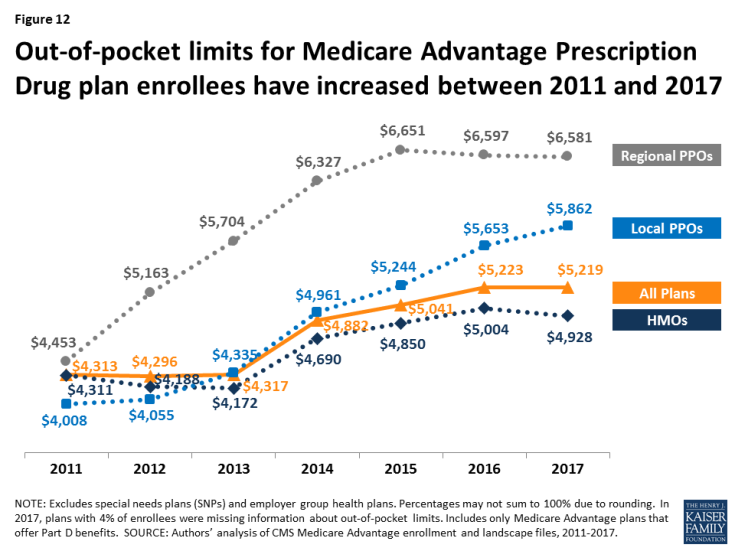
Figure 12: Out-of-pocket limits for Medicare Advantage Prescription Drug plan enrollees have increased between 2011 and 2017
Part D Cost Sharing
The standard Medicare Part D benefit in 2017, for both stand-alone prescription drug plans (PDPs) and MA-PDs, has a $400 deductible and 25 percent coinsurance up to an initial coverage limit of $3,700 in total drug costs, followed by a coverage gap (the so-called “donut hole”) where beneficiaries pay a larger share of total costs until their total out of pocket Part D spending reaches $4,950. After exceeding this catastrophic threshold, beneficiaries pay 5 percent of the cost of drugs. Both stand-alone Medicare prescription drug plans (PDPs) and MA-PDs have the flexibility to vary the cost-sharing design of their Part D benefit; however, CMS limits the plans’ deductibles and in 2017 the deductible cannot exceed $400.
Part D Deductibles
Average Part D drug deductibles for MA-PD enrollees have steadily climbed since 2011, with the largest increases between 2014 and 2016 (Figure 13). The average Part D deductible for MA-PD enrollees is $131 in 2017, up from $128 in 2016. Enrollees in HMOs continue to have lower average drug deductibles ($108) than enrollees in local PPOs ($166) or enrollees in regional PPOs ($227) in 2017.
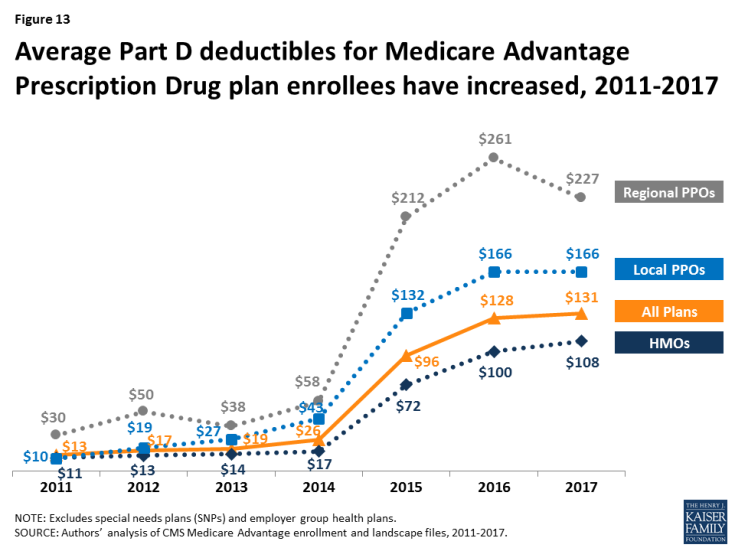
Figure 13: Average Part D deductibles for Medicare Advantage Prescription Drug plan enrollees have increased, 2011-2017
In 2017, just 8 percent of MA-PD enrollees are in a plan with the maximum Part D deductible. Less than half (46%) are in plans with no Part D deductible and an equal share (46%) have deductibles less than $400 (data not shown). Among Medicare Advantage enrollees, those in HMOs (54%), followed by local PPOs (36%), are most likely to be in a plan with no deductible; only 8 percent of regional PPO enrollees are in a plan with no Part D deductible (data not shown).
Star Quality Ratings
For many years, CMS has posted quality ratings of Medicare Advantage plans to provide beneficiaries with additional information about plans offered in their area. All plans are rated on a 1 to 5-star scale, with 1 star representing poor performance, 3 stars representing average performance, and 5 stars representing excellent performance. CMS assigns quality ratings at the contract level, rather than for each individual plan, meaning that each plan covered under the same contract receives the same quality rating (and most contracts cover multiple plans of the same type). Since 2012, Medicare Advantage plans with 4 or more stars and plans without ratings have been receiving bonus payments based on quality ratings.7 Beneficiaries can enroll in a plan with 5 stars at any time during the year, not just during the annual open enrollment period.
In 2017, 66 percent of Medicare Advantage enrollees are in plans with 4 or more stars, a slight decrease from 68 percent in 2016 (Figure 14). A somewhat larger share of enrollees is in plans with 3 stars in 2017 (9% in 2017 versus 6% in 2016). Overall, enrollment by star quality ratings appears to have been relatively stable since 2015. Much of the increase in enrollment in plans with four or more stars has occurred in the plans with 4 or 4.5 stars, while the share of enrollees in plans with 5 stars has been relatively stable.
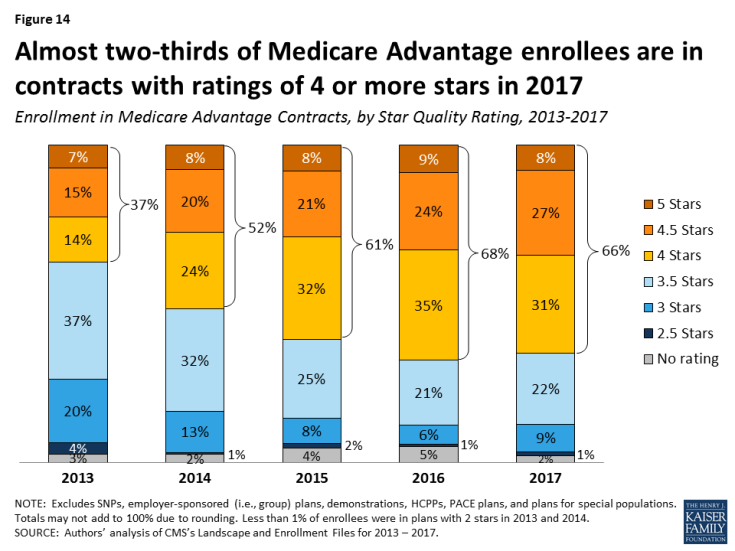
Figure 14: Almost two-thirds of Medicare Advantage enrollees are in contracts with ratings of 4 or more stars in 2017
Notably, while a larger share of beneficiaries is in a Medicare Advantage plan with relatively high star ratings, seniors have said in focus groups that they do not use the star ratings to select their plan.8 Nonetheless, the star ratings may be correlated with factors that seniors do use to select their plan, including provider networks, and plan benefits and costs, and thus may be correlated with enrollment.
Discussion
Medicare Advantage enrollment has steadily increased both nationally and across states since 2005, with one-third of Medicare beneficiaries enrolled in Medicare Advantage plans in 2017. Enrollment continues to be highly concentrated among a handful of firms, both nationally and in local markets; UnitedHealthcare and Humana together account for 41 percent of enrollment in 2017. Average premiums paid by enrollees have remained relatively flat since 2011, but out-of-pocket limits have increased 21 percent and Part D drug deductibles have increased more than 9-fold since 2011, suggesting that enrollees have less financial protection in plans than they have in the past. More granular information about benefits and plans’ cost-sharing is needed to fully understand costs incurred by beneficiaries with different service needs, how Medicare Advantage enrollees’ out-of-pocket costs compare to beneficiaries in traditional Medicare, how they vary across plans, and how out-of-pocket costs in Medicare Advantage plans have changed since the ACA. Additionally, there is a growing but still inconclusive literature on the differences in quality of care between Medicare Advantage and traditional Medicare, particularly with respect to high-need, high cost patients.9
Looking to the future, both the Congressional Budget Office and the Health and Human Services (HHS) Office of the Actuary (OACT) project that Medicare Advantage enrollment and penetration rate will continue to grow over the next decade, with CBO projecting that about 41 percent of Medicare beneficiaries will be enrolled in Medicare Advantage in 2027. As this growth continues, it will be increasingly important to assess how well the Medicare’s current payment methodology, and the competitive model behind Medicare Advantage is working to enhance efficiency and hold down beneficiary costs and Medicare spending. It will also be important to understand the implications for beneficiaries in both Medicare Advantage plans and traditional Medicare, in terms of costs, benefits, premiums, quality of care, patient outcomes, and access to providers.
As Medicare Advantage takes on an even larger presence in the Medicare program, careful stewardship and oversight by policymakers is needed to make sure that plans provide value to the Medicare program, and the 57 million beneficiaries it covers.
Gretchen Jacobson and Tricia Neuman are with the Kaiser Family Foundation; Anthony Damico is an independent consultant; and Marsha Gold is a Senior Fellow Emeritus with Mathematica Policy Research and independent consultant.

