Visualizing Health Policy: Understanding the Effect of Medicaid Expansion Decisions in the South
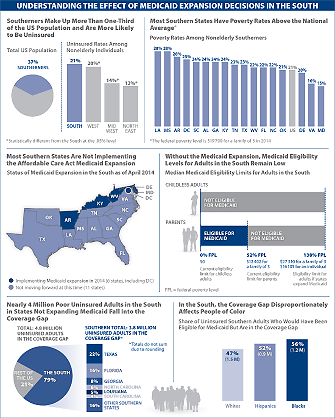
This Visualizing Health Policy infographic examines the effect of decisions by states in the South to implement or forgo the Affordable Care Act Medicaid expansion. It shows that Southerners are more likely than people living in other parts of the United States to be uninsured; that most Southern states have poverty rates above the national average; that without the Medicaid expansion (which most Southern states are not implementing), Medicaid eligibility levels for adults in the South remain low; that nearly 80% of the 4.8 million uninsured US adults who fall into the coverage gap live in the South; and that the coverage gap in the South disproportionately affects people of color.
Visualizing Health Policy is a monthly infographic series produced in partnership with the Journal of the American Medical Association (JAMA). The full-size infographic is freely available on JAMA’s website and is published in the print edition of the journal.

