U.S. Funding for International Nutrition Programs
Summary
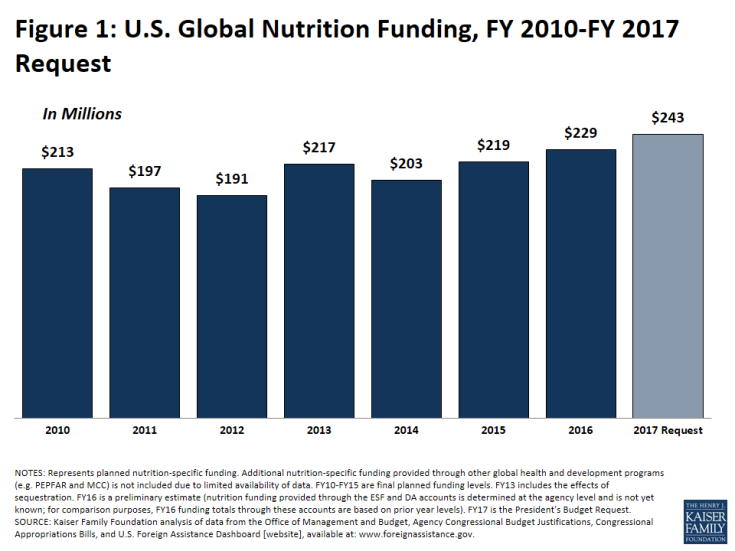
The U.S. has a long history of supporting global efforts to improve nutrition and is the largest donor to nutrition efforts in the world. Most of the government’s effort in this area operates at the nexus of its global health, Feed the Future (FtF), and Food for Peace (FFP) programs. Between FY10 and FY16, the U.S. Congress provided nearly $1.5 billion for nutrition activities, and funding in FY16 was an estimated $229 million; the budget request for FY17 includes $243 million (see Table 1 and Figure 1).1 Other U.S. global health and development programs provide some direct nutrition support, such as PEPFAR and the MCC, though such amounts are only available for select years. Beyond this direct support for nutrition (“nutrition-specific activities”), the U.S. also provides significant resources that address the underlying and systemic causes of malnutrition (“nutrition-sensitive activities”), estimated to have totaled $2.2 billion in 2013.2 This brief provides an overview of U.S. support for nutrition including trends in funding and top country recipients and places the U.S. within the larger context of overall donor support for the sector.
Introduction
The U.S. has a long history of supporting global efforts to improve nutrition and address the underlying causes of malnutrition, and is the largest donor to nutrition efforts in the world. Most of the government’s effort in this area is conducted through its global health, FtF, and FFP programs, operated by the U.S. Agency for International Development (USAID) and focused in 19 countries.3 Nutrition interventions include management of malnutrition, direct supplementation of minerals and nutrients, the promotion of breastfeeding and other activities. Beyond direct support for nutrition, also called “nutrition-specific activities”, which aim to address immediate nutrition needs, the U.S. also provides support for “nutrition-sensitive activities”, areas that have an impact on its overall nutrition goals, including, for instance water, sanitation, and hygiene (WASH) programs, agricultural activities, and girls’ and women’s education. In 2014, USAID released a nutrition strategy to guide efforts between 2014 and 2025.4 The strategy aims to reduce malnutrition globally through a multi-sectoral approach that works across programs and agencies to identify and promote a wider range of nutrition efforts – both those that are nutrition-specific as well as nutrition sensitive.
Overview of Funding Trends
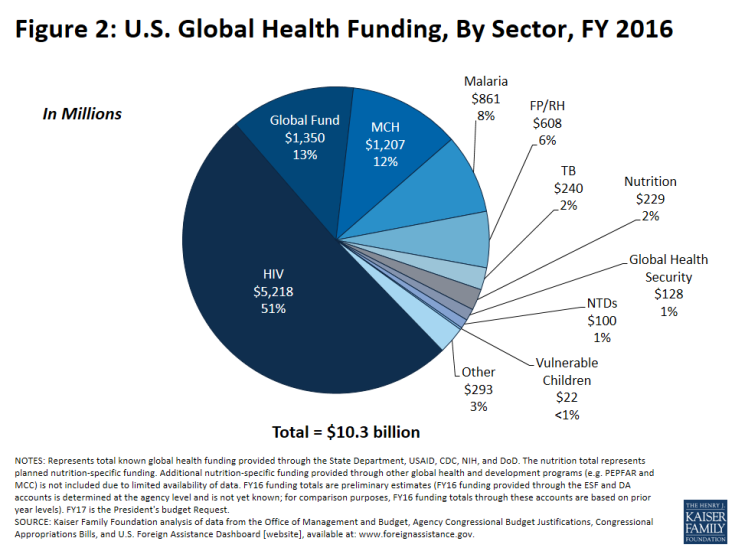
Historically, funding for global nutrition efforts was included within broader maternal and child health (MCH) funding, and was not specifically delineated. However, in FY10 the Obama Administration created a nutrition-specific funding line, elevating attention to these resources. Between FY10 and FY16, the U.S. Congress provided nearly $1.5 billion for nutrition activities and in FY16, funding was an estimated $229 million; still, funding for nutrition accounts for a relatively small share of the total U.S. global health budget (approximately 2%) (see Figure 2). Other U.S. global health and development programs provide some direct nutrition support, such as PEPFAR and the MCC, though such amounts are only available for select years. In addition, funding for nutrition-sensitive activities are not included in nutrition totals. Both nutrition-specific and nutrition-sensitive funding are described below.
Nutrition-Specific Funding
In FY10, the first year in which nutrition funding was delineated, total specified funding was $213 million. Since then, funding for nutrition has fluctuated, including decreases in some years. Estimated nutrition funding in FY16 is $229 million, the highest level to date, and an 8% increase over FY10 levels. The President’s FY17 budget request includes $243 million for nutrition activities, which would represent a $13 million increase (6%) above the FY16 estimated level. All nutrition-specific funding is provided though bilateral channels.
Of the $219 million in funding in FY15 (the most recent year for which detailed funding by account and country are available), the majority ($115 million or 52%) was provided through the Global Health Programs (GHP) account, and $82 million (37%) was provided through the FFP account, with the remaining amount provided through other the Economic Support Fund (ESF) and Development Assistance (DA) accounts (see Table 1). Twenty countries received nutrition funding in FY15 under the GHP account, while thirteen countries received nutrition funding under the FPP program (seven countries received funding under both the GHP account and through FFP). The 19 nutrition priority countries received $134 million in FY15, accounting for more than 60% of total nutrition funding.5 The top recipient of funding in FY15 was Bangladesh ($27.0 million), followed by Afghanistan ($21.2 million), Uganda ($18.0 million), Burundi ($11.5 million), and Democratic Republic of the Congo ($11.3 million) (see Table 2).
In addition to these amounts, data for direct nutrition support provided though other U.S. global health and development programs are only available for select years. For example, PEPFAR requested $13.5 million for HIV-related nutrition activities in FY17 and the MCC’s five-year compact with Indonesia includes $131.5 million for the “Community-Based Health and Nutrition to Reduce Stunting Project.”
Nutrition-Sensitive Funding
Funding for nutrition-sensitive activities, those that address the underlying causes of malnutrition and have an impact on its overall nutrition goals, is provided through multiple programs and initiatives, including FtF, FFP, MCC, McGovern-Dole International Food for Education and Child Nutrition Program, and contributions to the Global Agriculture and Food Security Program (GAFSP). Some of these programs include funding for both nutrition-specific and nutrition-sensitive activities. For instance, while FtF and FFP support nutrition-specific activities, the majority of their funding is directed towards nutrition-sensitive efforts. Other areas and programs highlighted in USAID’s Multi-Sectoral Nutrition Strategy as being nutrition-sensitive include: family planning; WASH; food safety and food processing; early childhood care and development; girls’ and women’s education; and economic strengthening, livelihoods, and social protection. USAID has worked to develop a methodology – in partnership with other donors through the Scale Up Nutrition (SUN) Movement – to provide a more comprehensive assessment of total resources provided for both nutrition-specific and nutrition-sensitive efforts.6 In 2013, it is estimated that U.S. nutrition-sensitive activities totaled approximately $2.2 billion.2
The United States in Context: International Donor Assistance for Nutrition
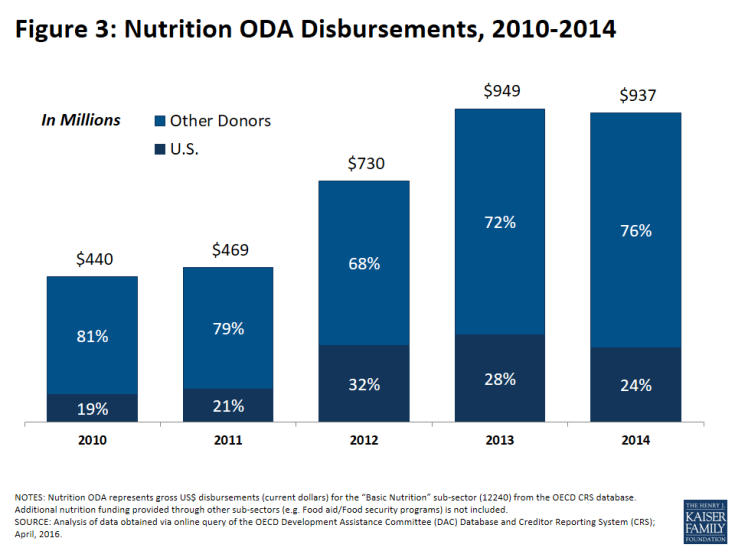
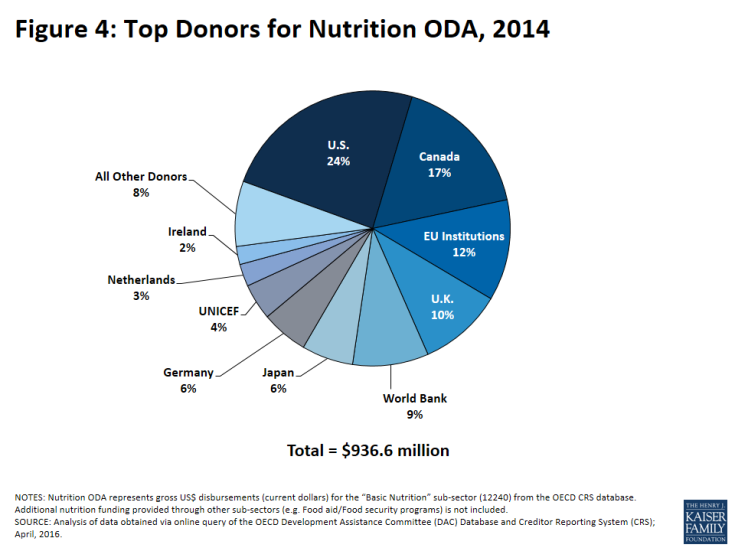
The U.S. is the single largest donor to nutrition efforts in the world.7,8 In 2014, the most recent year for which data are available, donor governments provided $936.6 million to support bilateral nutrition programs in low- and middle-income countries, a slight decline compared to 2013 ($948.8 million), which was the highest level to date (see Figure 3). The U.S. was the single largest bilateral donor in 2014, providing $225.5 million and accounting for almost a quarter (24%) of total bilateral funding (see Figure 4). Canada ($159.3 million, 17%) was the second largest bilateral donor, followed by the E.U. (US$111.4 million, 12%), the U.K. (US$92.6 million, 10%), and the World Bank (US$83.6 million, 9%).
Figures & Tables
| Table 1. U.S. Government Funding for Nutrition-Specific Programs, by Account, in Millions, FY10-FY17 Request | ||||||||
| 2010 | 2011 | 2012 | 2013 | 2014 | 2015 | 2016 | 2017 Request |
|
| Nutrition | $213.3 | $196.9 | $190.6 | $217.2 | $203.4 | $219.4 | $229.4 | $242.5 |
|
Global Health Programs (GHP) |
$70.5 | $89.8 | $95.0 | $95.1 | $115.0 | $115.0 | $125.0 | $108.5 |
|
Economic Support Fund (ESF) |
$26.6 | $3.0 | $2.0 | $2.3 | $23.7 | $21.2 | $21.2 | $36.5 |
|
Development Assistance (DA) |
$3.6 | — | — | — | — | $1.0 | $1.0 | $9.9 |
|
Food for Peace (FFP) |
$112.6 | $104.0 | $93.6 | $119.8 | $64.7 | $82.3 | $82.3 | $87.6 |
| Notes: Represents planned nutrition-specific funding. Additional nutrition-specific funding provided through other global health and development programs (e.g. PEPFAR and MCC) is not included due to limited availability of data. FY10-FY15 are final funding levels. FY13 includes the effects of sequestration. FY16 is a preliminary estimate (FY16 nutrition funding provided through the ESF and DA accounts is determined at the agency level and is not yet known for FY16; for comparison purposes, FY16 funding totals through these accounts are based on prior year levels). FY17 is the President’s budget Request. Source: Kaiser Family Foundation analysis of data from the Office of Management and Budget, Agency Congressional Budget Justifications, Congressional Appropriations Bills, and the U.S. Foreign Assistance Dashboard (www.foreignassistance.gov; accessed April, 2016). |
||||||||
| Table 2. U.S. Government Funding for Nutrition-Specific Programs, by Country & Region, in Millions, FY10-FY15 | ||||||
| 2010 | 2011 | 2012 | 2013 | 2014 | 2015 | |
| Country Total | $192.5 | $180.1 | $173.6 | $199.4 | $184.2 | $202.4 |
| Afghanistan | $1.3 | $2.5 | $2.0 | $7.4 | $20.0 | $21.2 |
| Angola | $0.0 | $0.0 | $0.0 | $1.6 | $0.0 | $0.0 |
| Bangladesh* | $21.9 | $22.4 | $25.0 | $29.9 | $24.0 | $27.0 |
| Bolivia | $0.5 | $0.0 | $0.0 | $0.0 | $0.0 | $0.0 |
| Brazil | $1.3 | $0.0 | $0.0 | $0.0 | $0.0 | $0.0 |
| Burkina Faso | $0.9 | $5.3 | $6.2 | $4.6 | $2.2 | $3.4 |
| Burundi | $5.6 | $0.0 | $0.0 | $9.2 | $0.0 | $11.5 |
| Cambodia* | $1.0 | $1.0 | $1.0 | $1.0 | $1.5 | $1.5 |
| Chad | $0.0 | $0.9 | $1.3 | $0.1 | $0.0 | $0.0 |
| Democratic Republic of Congo | $1.1 | $3.8 | $4.6 | $14.1 | $11.0 | $11.3 |
| Egypt | $3.0 | $0.5 | $0.0 | $0.0 | $3.7 | $0.0 |
| Ethiopia* | $12.8 | $18.4 | $14.1 | $8.2 | $14.9 | $9.5 |
| Ghana* | $2.3 | $5.4 | $6.5 | $6.5 | $7.0 | $7.0 |
| Guatemala* | $19.9 | $19.9 | $14.4 | $10.6 | $7.5 | $8.7 |
| Haiti* | $25.2 | $18.7 | $6.6 | $2.0 | $10.2 | $10.2 |
| Honduras* | $1.6 | $0.0 | $0.0 | $0.0 | $0.0 | $0.0 |
| India | $2.4 | $0.5 | $0.0 | $0.0 | $0.0 | $0.0 |
| Kenya* | $1.3 | $3.0 | $2.0 | $3.0 | $4.0 | $4.0 |
| Laos | $0.0 | $0.0 | $0.0 | $0.0 | $0.0 | $3.0 |
| Liberia* | $1.5 | $3.6 | $3.6 | $3.9 | $4.0 | $0.0 |
| Madagascar | $4.2 | $3.1 | $2.4 | $0.9 | $1.0 | $5.0 |
| Malawi* | $7.2 | $9.2 | $9.4 | $9.5 | $8.0 | $6.9 |
| Mali* | $2.0 | $4.2 | $5.0 | $5.7 | $5.0 | $7.0 |
| Mauritania | $0.0 | $1.4 | $1.4 | $0.0 | $0.0 | $0.0 |
| Mozambique* | $7.8 | $15.2 | $13.9 | $5.0 | $6.3 | $6.3 |
| Nepal* | $3.7 | $6.2 | $7.0 | $6.7 | $8.0 | $8.0 |
| Nicaragua | $0.7 | $0.0 | $0.0 | $0.0 | $0.0 | $0.0 |
| Niger | $2.1 | $2.4 | $12.0 | $4.5 | $1.0 | $1.1 |
| Nigeria | $2.0 | $0.0 | $0.0 | $0.0 | $2.5 | $2.5 |
| Pakistan | $2.6 | $0.0 | $0.0 | $7.6 | $0.0 | $0.0 |
| Peru | $0.6 | $0.0 | $0.0 | $0.0 | $0.0 | $0.0 |
| Philippines | $0.7 | $0.0 | $0.0 | $0.0 | $0.0 | $0.0 |
| Rwanda* | $2.0 | $2.5 | $3.0 | $3.0 | $3.0 | $3.0 |
| Senegal* | $1.8 | $4.0 | $4.5 | $4.5 | $4.5 | $4.5 |
| Sierra Leone | $3.0 | $0.0 | $3.1 | $9.5 | $2.7 | $1.0 |
| Somalia | $0.0 | $0.0 | $0.0 | $1.9 | $0.0 | $0.0 |
| South Sudan | $0.0 | $1.0 | $0.0 | $1.9 | $0.0 | $0.0 |
| Sudan, Pre-2011 Election | $29.9 | $0.0 | $0.0 | $0.0 | $0.0 | $0.0 |
| Tajikistan* | $0.0 | $0.0 | $0.0 | $1.0 | $1.0 | $1.0 |
| Tanzania* | $1.5 | $6.7 | $7.2 | $7.2 | $7.8 | $7.8 |
| Uganda* | $14.2 | $14.2 | $13.9 | $12.8 | $11.5 | $18.0 |
| West Bank and Gaza | $0.2 | $0.0 | $0.0 | $0.0 | $0.0 | $0.0 |
| Yemen | $0.0 | $0.0 | $0.0 | $3.8 | $0.0 | $0.0 |
| Zambia* | $2.9 | $4.3 | $3.6 | $3.6 | $4.0 | $4.0 |
| Zimbabwe | $0.0 | $0.0 | $0.0 | $8.1 | $8.1 | $8.1 |
| Regional Total | $2.6 | $0.0 | $0.0 | $1.0 | $1.2 | $1.2 |
| Africa Regional Office (USAID) | $1.2 | $0.0 | $0.0 | $0.0 | $0.0 | $0.0 |
| East Africa Regional Office (USAID) | $0.8 | $0.0 | $0.0 | $0.0 | $0.0 | $0.0 |
| Sahel Regional Program (USAID) | $0.0 | $0.0 | $0.0 | $1.0 | $1.2 | $1.2 |
| West Africa Regional Office (USAID) | $0.6 | $0.0 | $0.0 | $0.0 | $0.0 | $0.0 |
| Total | $195.1 | $180.1 | $173.6 | $200.4 | $185.4 | $203.6 |
| Notes: Represents planned country and regional nutrition-specific funding provided through the GHP, ESF, DA, and FFP accounts. Additional country and regional nutrition-specific funding provided through other global health and development programs (e.g. PEPFAR and MCC) is not included due to limited availability of data. FY10-FY15 are final funding levels. FY13 includes the effects of sequestration. *Represents a USAID nutrition (and Feed the Future) priority country. Source: Kaiser Family Foundation analysis of data from the U.S. Foreign Assistance Dashboard (www.foreignassistance.gov; accessed April, 2016). |
||||||


