Medicare Advantage in 2024: Enrollment Update and Key Trends
Medicare Advantage enrollment has been on a steady climb for the past two decades following changes in policy designed to encourage a robust role for private plan options in Medicare. After a period of some instability in terms of plan participation and enrollment, The Medicare Modernization Act of 2003 created stronger financial incentives for plans to participate in the program throughout the country and renamed private Medicare plans Medicare Advantage. In 2024, 32.8 million people are enrolled in a Medicare Advantage plan, accounting for more than half, or 54 percent, of the eligible Medicare population, and $462 billion (or 54%) of total federal Medicare spending (net of offsetting receipts, such as premiums). Medicare Advantage enrolls a disproportionate share of people of color in Medicare as well as an increasing number of dual eligible beneficiaries. The average Medicare beneficiary in 2024 has access to 43 Medicare Advantage plans, the same as in 2023, but more than double the number of plans offered in 2018.
The growth in Medicare Advantage enrollment is due to a number of factors, including the availability of plans that charge no premium (other than the Part B premium), and extra benefits offered by most Medicare Advantage plans. Nearly all Medicare Advantage plans offer some benefits not included in traditional Medicare, such as coverage of dental, vision, or hearing services, often for no additional premium. Medicare beneficiaries are also drawn to the financial protection that comes with an out-of-pocket limit, which Medicare Advantage plans are required to provide, while traditional Medicare has no out-of-pocket cap on spending. On the other hand, Medicare Advantage plans have limited provider networks and apply cost management tools such as prior authorization, which traditional Medicare does not.
Generally, research shows that Medicare pays more to private Medicare Advantage plans for enrollees than their costs would be in traditional Medicare. The Medicare Payment Advisory Commission (MedPAC) reports that plans receive payments from CMS that are 122% of spending for similar beneficiaries in traditional Medicare, on average, translating to an estimated $83 billion in higher spending in 2024. As Medicare Advantage takes on a more dominant presence in the Medicare program, and with current payments to plans higher for Medicare Advantage than for traditional Medicare for similar beneficiaries, policymakers have become increasingly focused on how well Medicare’s current payment methodology for Medicare Advantage is working to enhance efficiency and hold down beneficiary costs and Medicare spending.
To better understand trends in the growth of the program, this brief provides current information about Medicare Advantage enrollment, by plan type and firm, and shows how enrollment varies by state and county. A second, companion analysis describes Medicare Advantage premiums, out-of-pocket limits, supplemental benefits offered, and prior authorization requirements in 2024. This analysis does not provide detailed information by enrollee characteristics, such as race/ethnicity, income, or dual status, because that information is not available.
Highlights for 2024:
- More than half (54%) of eligible Medicare beneficiaries are enrolled in Medicare Advantage in 2024. The share of Medicare beneficiaries in Medicare Advantage plans varies across states, ranging from 2% to 63%. In 7 states, AL, CT, MI, HI, ME, FL, RI (and Puerto Rico), 60% or more of all Medicare beneficiaries are enrolled in Medicare Advantage plans, an increase from 3 states in 2023.
- More than one-third (37%) of Medicare beneficiaries live in a county where at least 60 percent of all Medicare beneficiaries are enrolled in Medicare Advantage plans. Three counties (excluding those in Puerto Rico) enroll 80% or more of Medicare beneficiaries in Medicare Advantage plans: Monroe County, NY (Rochester; 82%), Starr, Texas (81%), and Miami-Dade County, Florida (80%). At the same time, 8 percent of all Medicare beneficiaries nationwide live in a county with relatively low enrollment, where less than one third of all Medicare beneficiaries are enrolled in Medicare Advantage plans. The wide variation in county enrollment rates reflect several factors, such as differences in firm strategy, urbanicity of the county, Medicare payment rates, number of Medicare beneficiaries, health care use patterns, and historical Medicare Advantage market penetration.
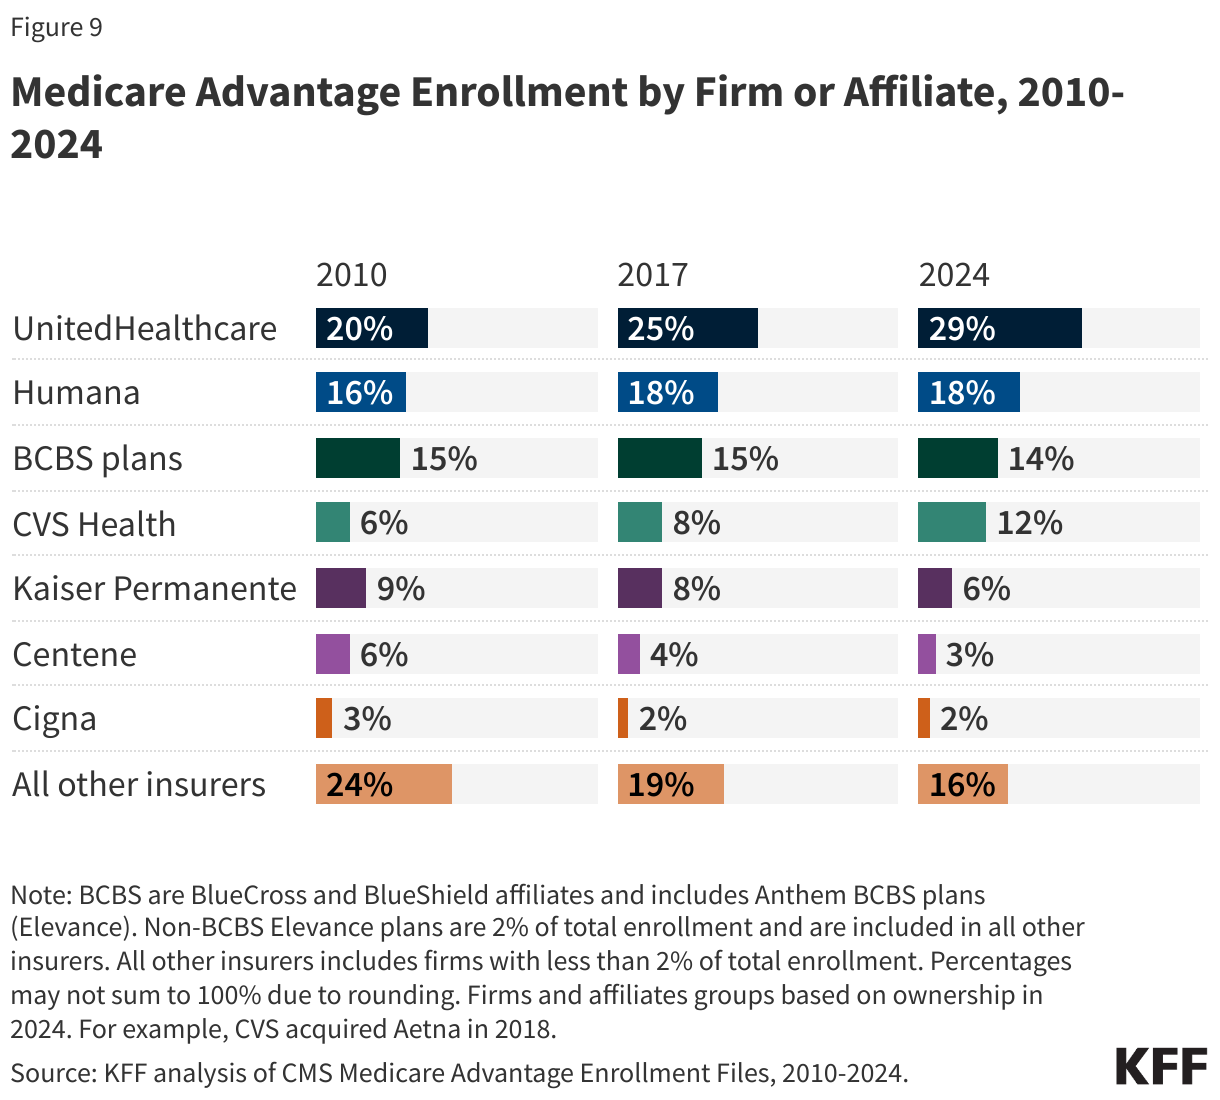
- Medicare Advantage enrollment is highly concentrated among a small number of firms, with UnitedHealthcare and Humana accounting for nearly half (47%) of all Medicare Advantage enrollees nationwide. In more than a quarter of all U.S. counties (29%; or 931 counties), these two firms account for at least 75 percent of Medicare Advantage enrollment. Since 2017, the market share for UnitedHealthcare and CVS Health has increased (25% to 29% and 8% to 12%, respectively), Humana (18%) and Cigna (2%) have held steady, while other firms’ share of total enrollment has slightly decreased (Blue Cross Blue Shield (BCBS) affiliates, Kaiser Permanente, and Centene). Small firms (which each account for less than 2% of enrollment) have a smaller share of the market in 2024 than in 2017 (19% to 16%).
More than half of eligible Medicare beneficiaries are enrolled in Medicare Advantage in 2024
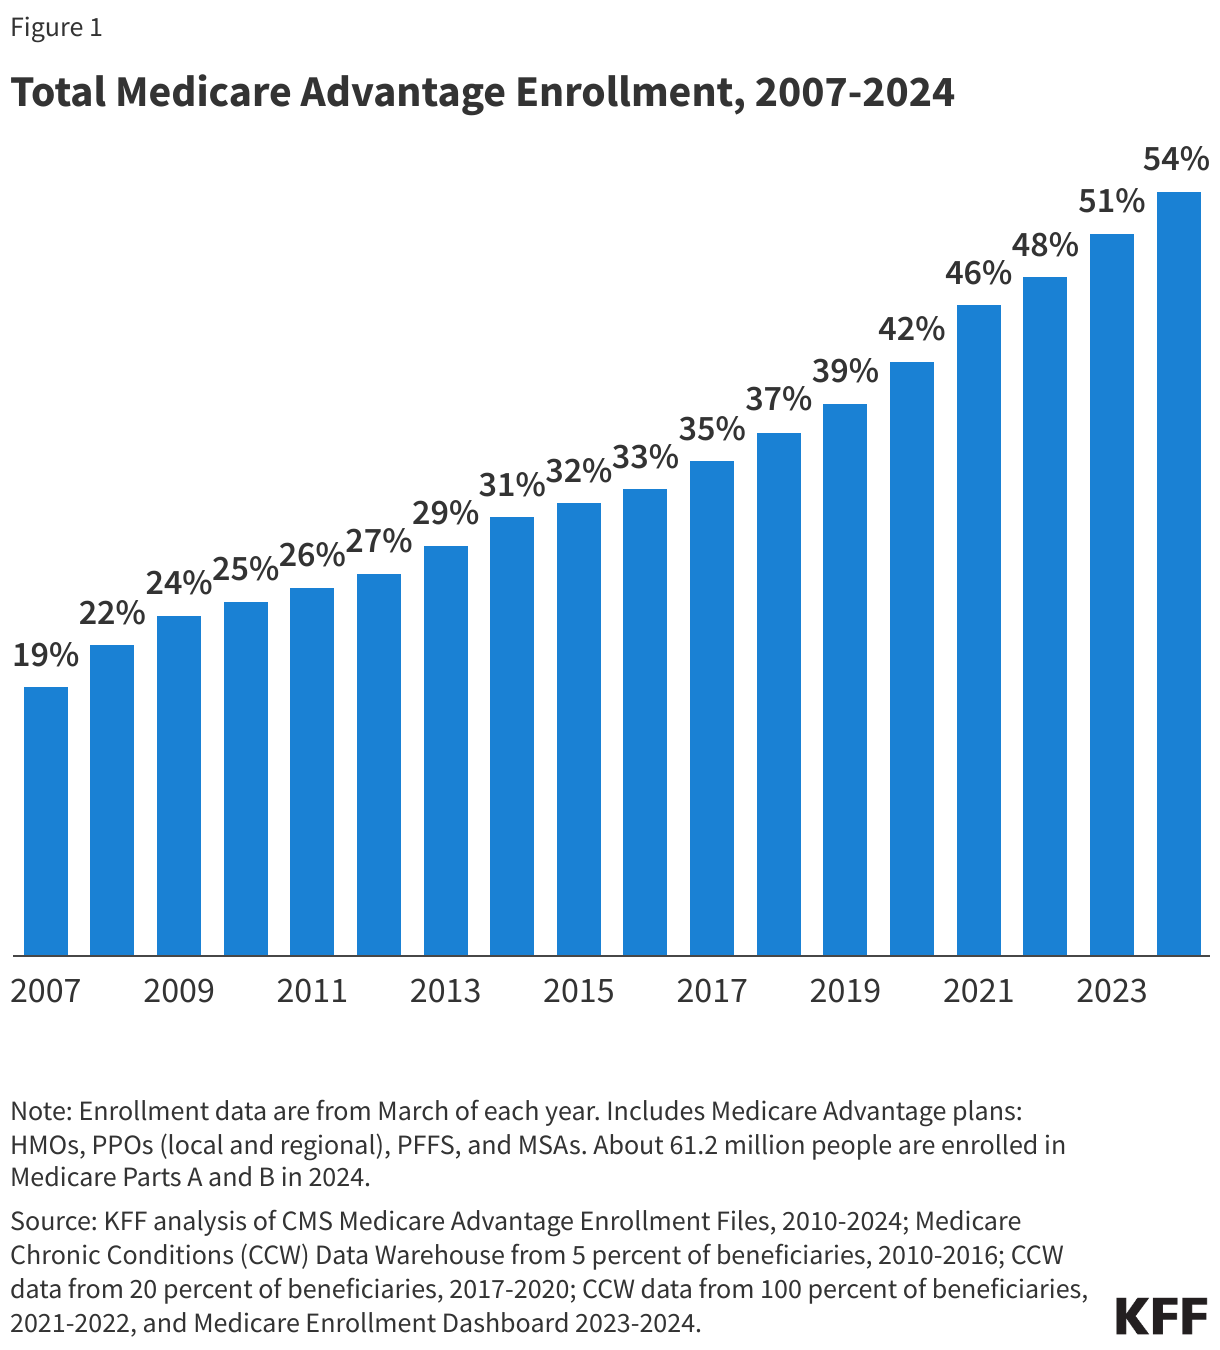
In 2024, more than half (54%) of eligible Medicare beneficiaries – 32.8 million people out of 61.2 million Medicare beneficiaries with both Medicare Parts A and B – are enrolled in Medicare Advantage plans. Medicare Advantage enrollment as a share of the eligible Medicare population has jumped from 19% in 2007 to 54% in 2024 (Figure 1).
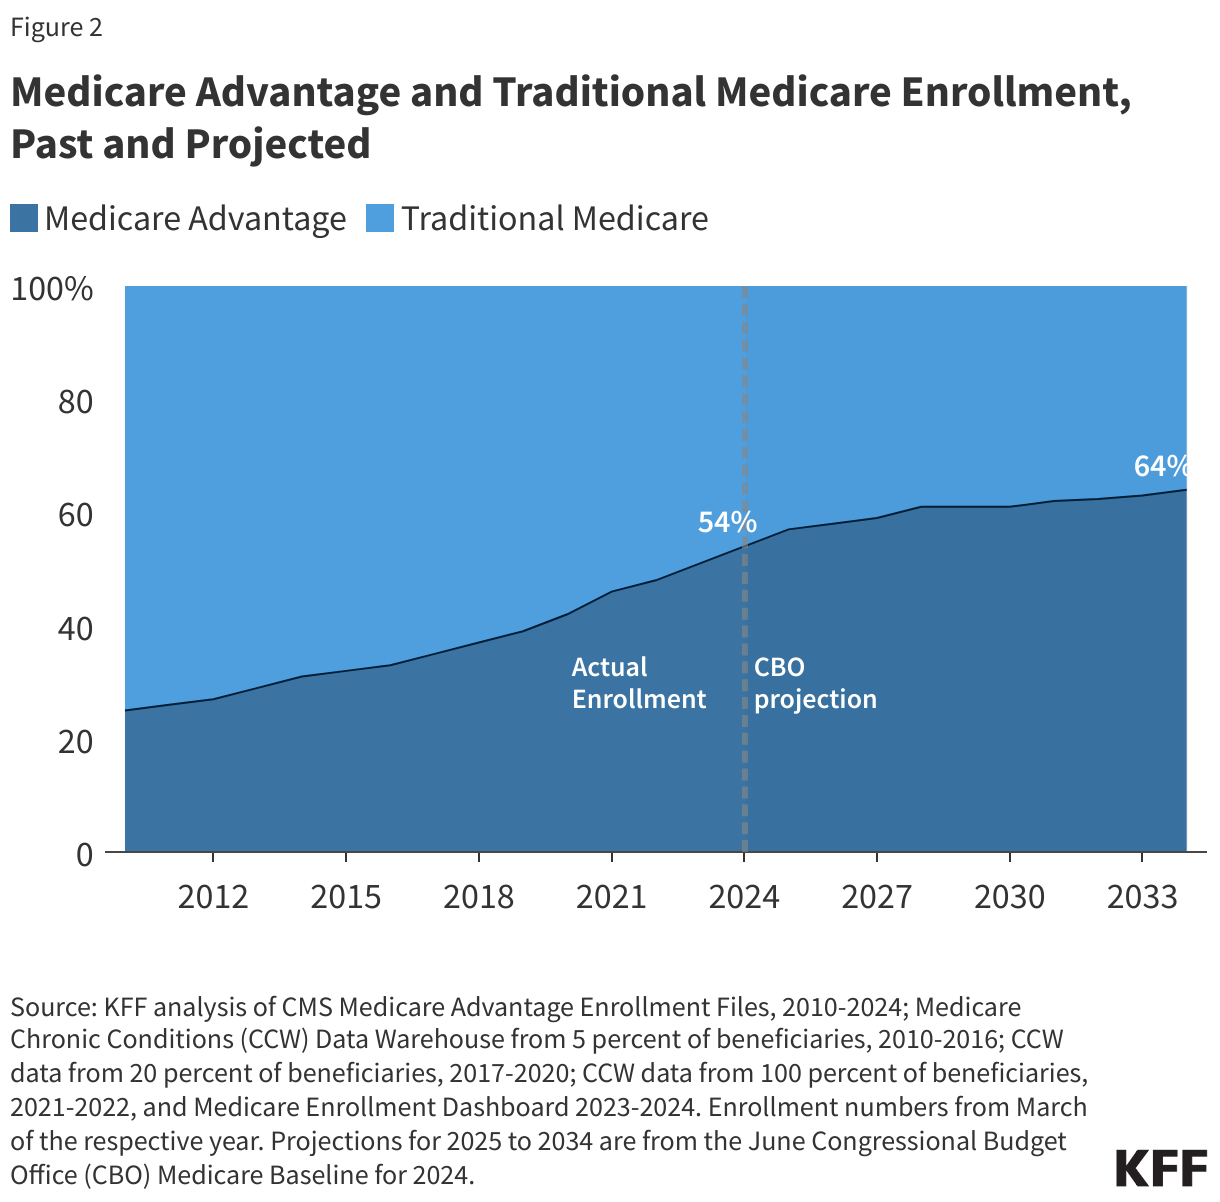
Between 2023 and 2024, total Medicare Advantage enrollment grew by about 2.1 million beneficiaries, or 7 percent – a similar growth rate as the prior year (8%). The Congressional Budget Office (CBO) projects that the share of all Medicare beneficiaries enrolled in Medicare Advantage plans will rise to 64% by 2034 (Figure 2).
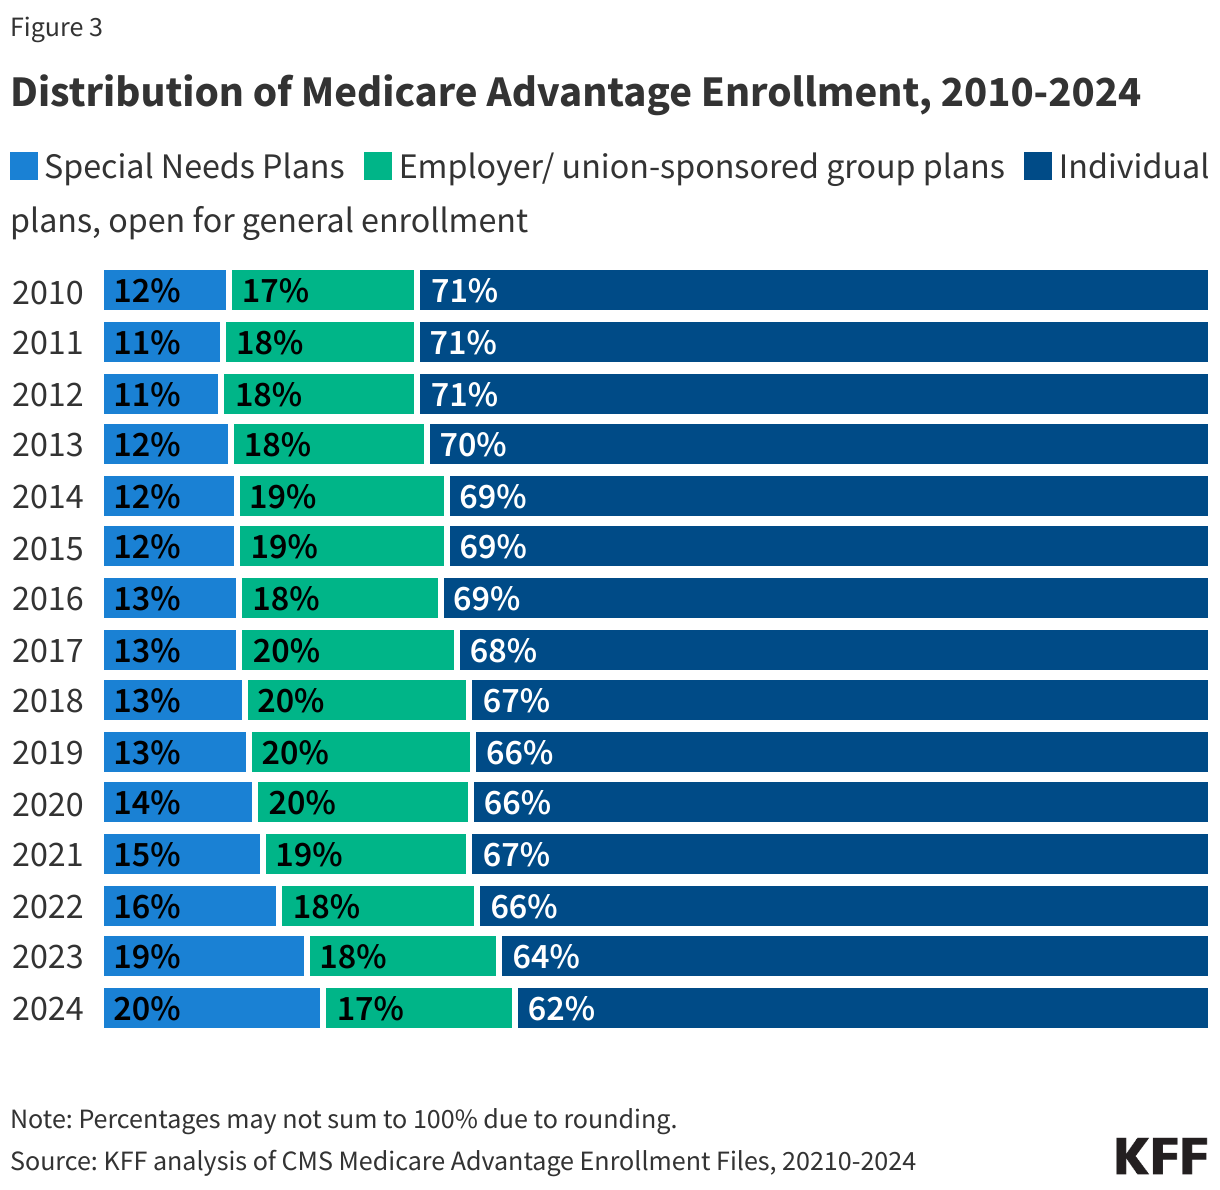
In 2024, nearly two-thirds of Medicare Advantage enrollees are in individual plans that are open for general enrollment.
More than 6 in 10 Medicare Advantage enrollees (62%), or 20.5 million people, are in plans generally available to all beneficiaries for individual enrollment (Figure 3). That is an increase of 0.9 million enrollees compared to 2023. Individual plans have declined as a share of total Medicare Advantage enrollment since 2010 (71%).
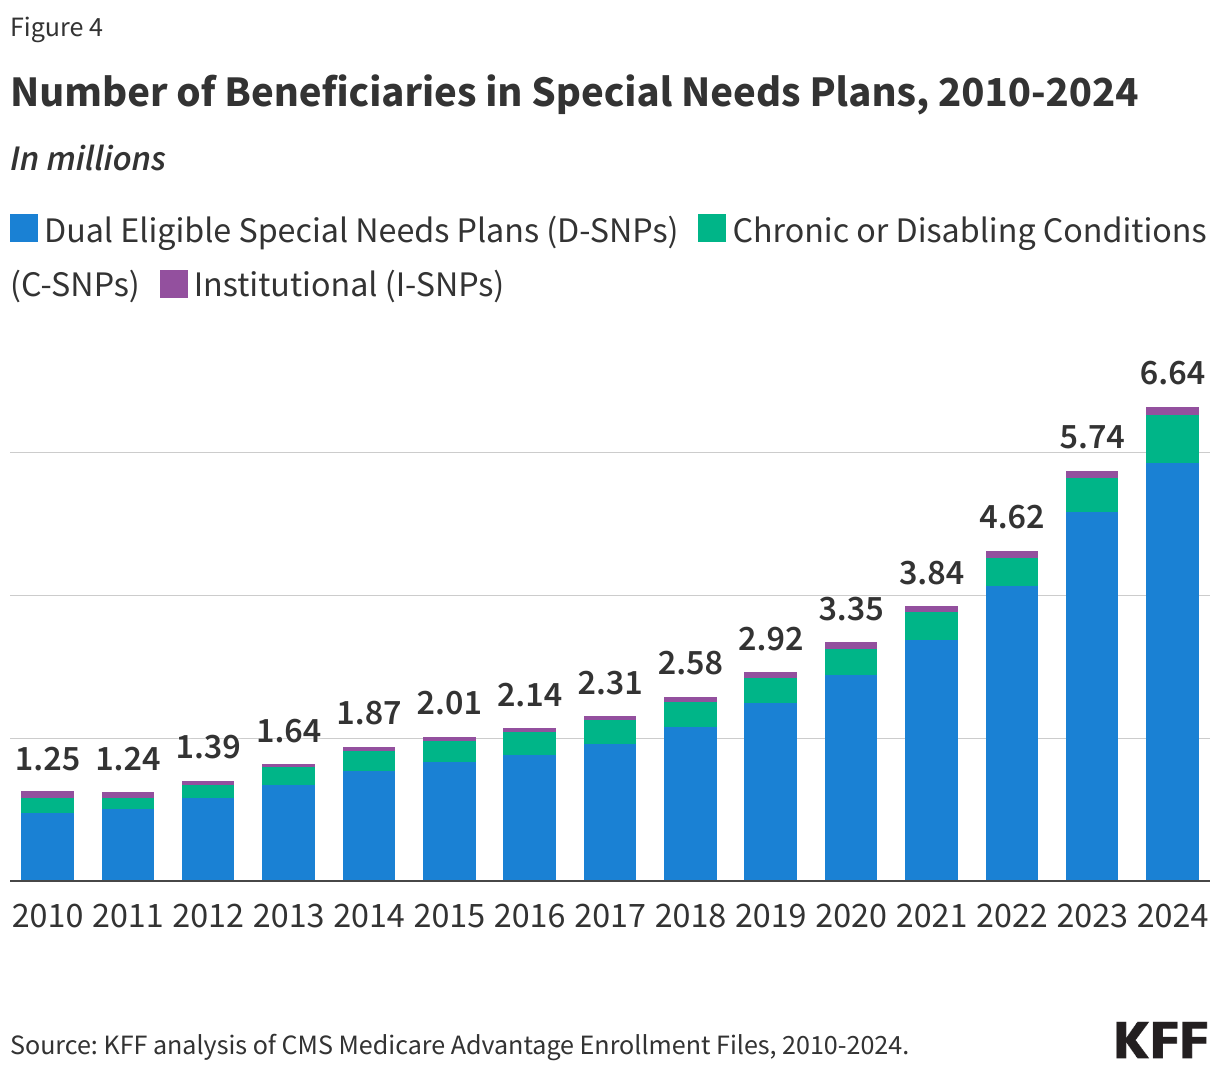
More than 6.6 million Medicare beneficiaries are enrolled in special needs plans in 2024, more than double the enrollment in 2019.
More than 6.6 million Medicare beneficiaries are enrolled in special needs plans (SNPs). SNPs restrict enrollment to specific types of beneficiaries with significant or relatively specialized care needs, or who qualify because they are eligible for both Medicare and Medicaid. Enrollment in SNPs increased by 16 percent between 2023 and 2024, and accounts for 20 percent of total Medicare Advantage enrollment in 2024, an increase from 12 percent in 2010. Since 2019, SNP enrollment has more than doubled from 2.92 million to 6.64 million (Figure 4). This increase is due in part to the increasing number of SNP plans available on average and more dual eligible individuals having access to these plans.
Most SNP enrollees (88%) are in plans for beneficiaries dually enrolled in both Medicare and Medicaid (D-SNPs). Another 10 percent of SNP enrollees are in plans for people with severe chronic or disabling conditions (C-SNPs) and 2 percent are in plans for beneficiaries requiring a nursing home or institutional level of care (I-SNPs).
While D-SNPs are designed specifically for dually-eligible individuals, 1.2 million Medicare beneficiaries with full Medicaid benefits were enrolled in Medicare Advantage plans generally available to all beneficiaries (not designed specifically for this population) in 2021, while 2.3 million full dual eligible individuals were in D-SNPs. D-SNPs have increasingly become the main source of Medicare Advantage coverage for dual eligible individuals.
SNP enrollment varies across states. In the District of Columbia and Puerto Rico, SNP enrollees comprise about half of all Medicare Advantage enrollees (49% in DC and 51% in PR). In nine states, SNP enrollment accounts for at least a quarter of Medicare Advantage enrollment: 46% in MS, 34% in AR, 33% in LA and NY, 28% in FL and GA, and 25% in CT, SC and AL.
C-SNP enrollment in 2024 (about 675,000 people) is 45% higher than it was in 2023 – an increase of about 210,000 enrollees. Nearly all (97%) C-SNP enrollees are in plans for people with diabetes or cardiovascular conditions in 2024. Enrollment in I-SNPs has been increasing slightly, with approximately 115,000 enrollees in 2024, up from about 103,000 in 2023.
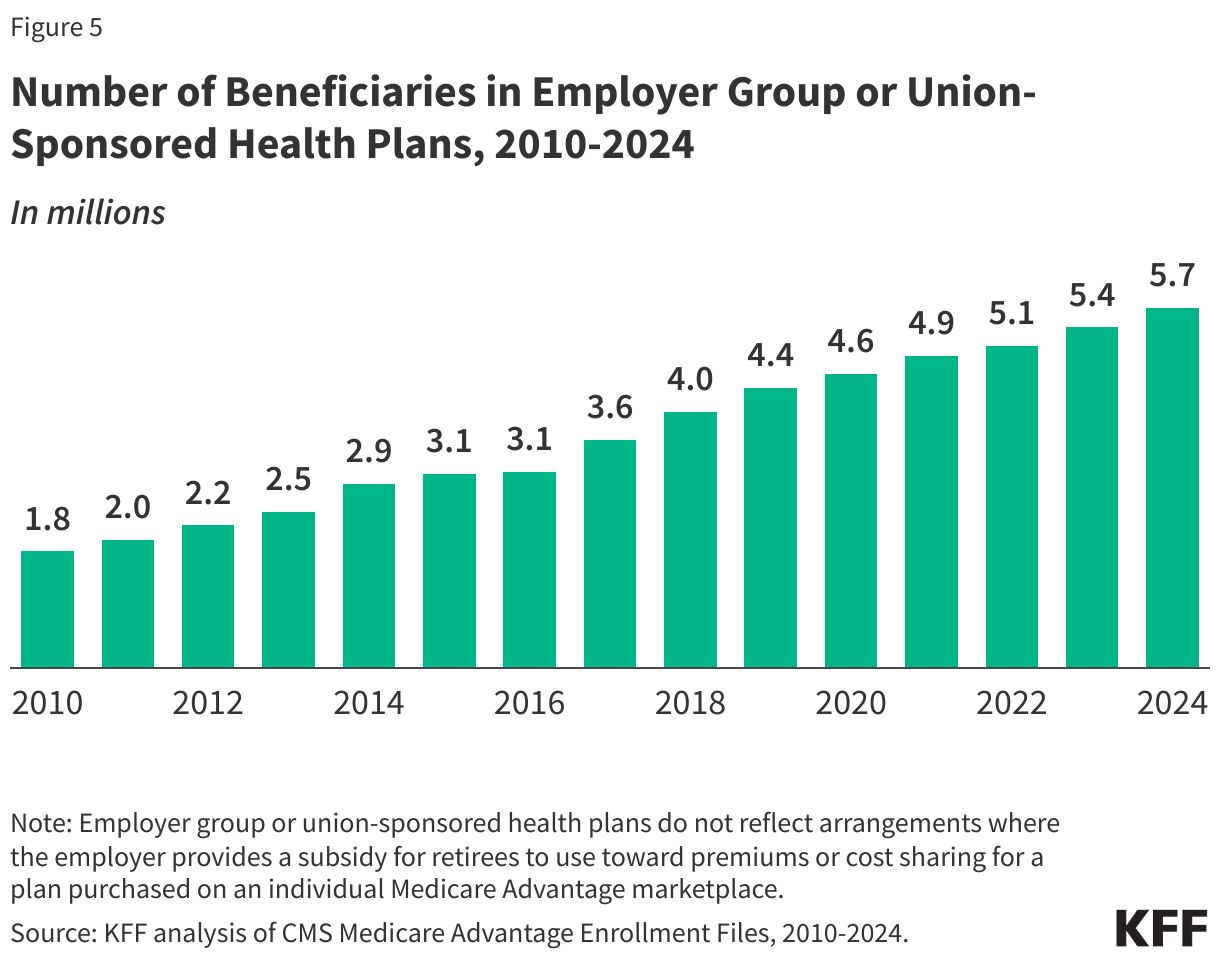
Slightly less than one in five (17% or about 5.7 million) Medicare Advantage enrollees are in a group plan offered to retirees by an employer or union.
Group enrollment as a share of total Medicare Advantage enrollment has fluctuated between 17% to 20% since 2010, but the actual number has increased from 1.8 million in 2010 to 5.7 million in 2024 (Figure 5). With a group plan, an employer or union contracts with an insurer and Medicare pays the insurer a fixed amount per enrollee to provide benefits covered by Medicare. For example, 13 states provide health insurance benefits to their Medicare-eligible retirees exclusively through Medicare Advantage plans.
As with other Medicare Advantage plans, employer and union group plans may provide additional benefits and/or lower cost sharing than traditional Medicare and are eligible for bonus payments if they obtain required quality scores. The employer or union (and sometimes the retiree) may also pay an additional premium for these supplemental benefits. Group enrollees comprise a quarter or more of Medicare Advantage enrollees in nine states: Alaska (100%), Michigan (38%), New Jersey (33%), West Virginia (31%), Maryland (30%), Illinois (29%), Vermont (27%), Kentucky (26%), and Connecticut (25%).
The share of Medicare beneficiaries in Medicare Advantage plans varies by state and county
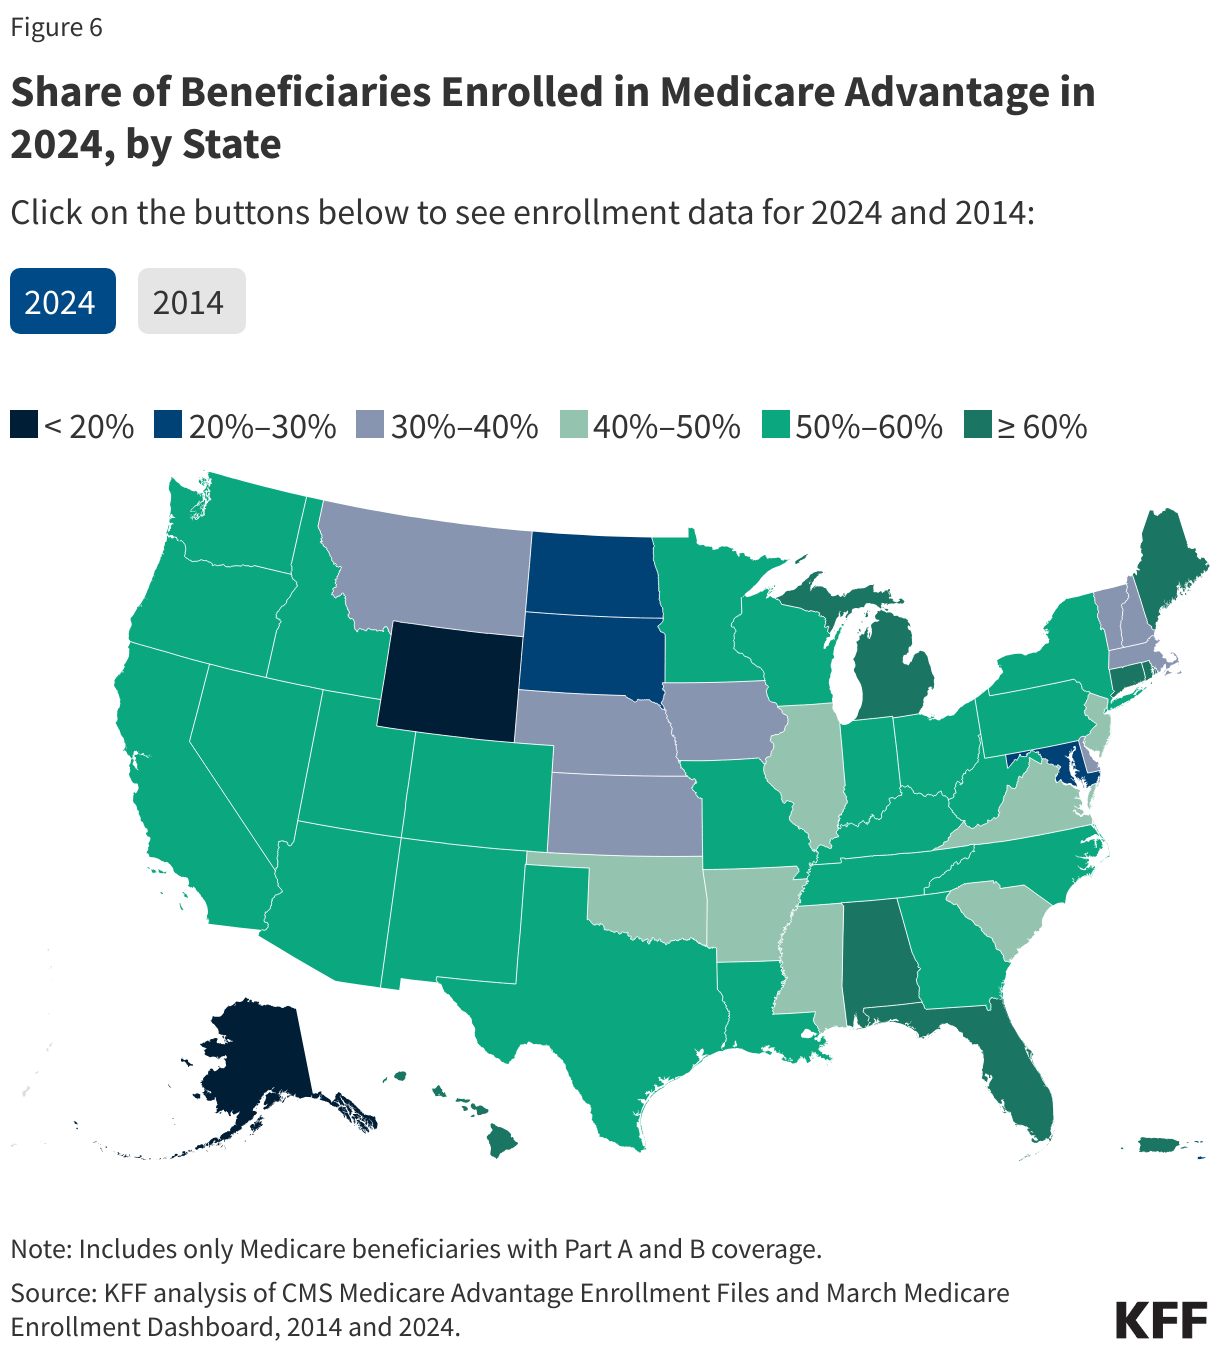
The share of Medicare beneficiaries in Medicare Advantage plans varies across states, ranging from 2% to 63%.
In 30 states, Medicare Advantage enrollees account for more than half of all Medicare beneficiaries, including in 7 states, AL, CT, MI, HI, ME, FL, RI (and Puerto Rico) where 60% or more of all Medicare beneficiaries are enrolled in Medicare Advantage plans (Figure 6). In contrast, Medicare Advantage enrollment is relatively low (less than 40%) in 13 states, including five states with less than 30% of beneficiaries enrolled in a Medicare Advantage plan – AK, MD, ND, SD, and WY – all of which (beside MD) are mostly rural. Overall, Puerto Rico has the highest Medicare Advantage penetration, with 95 percent of Medicare beneficiaries enrolled in a Medicare Advantage plan. A decade ago, the share of Medicare beneficiaries in Medicare Advantage plans did not exceed 50 percent in any state (other than Puerto Rico).
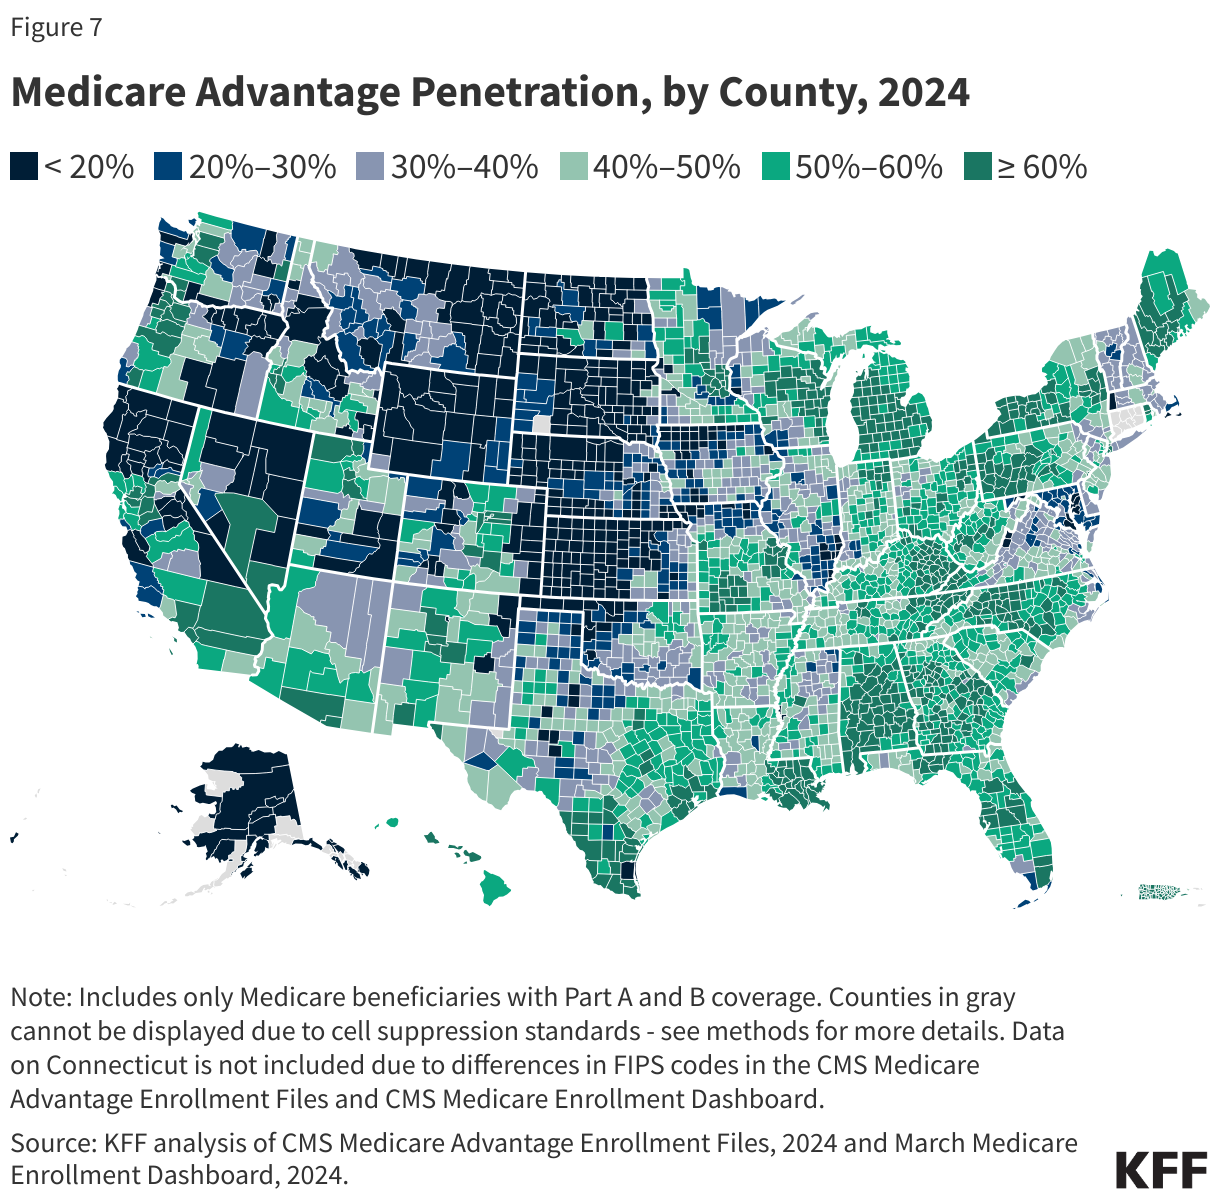
The share of Medicare beneficiaries enrolled in Medicare Advantage varies widely across counties.
For example, in Florida, 60% of all Medicare beneficiaries in the state are enrolled in Medicare Advantage, ranging from 21% in Monroe County (Key West) to 80% in Miami-Dade County (Figure 7). In Ohio, 57% of all Medicare beneficiaries are enrolled in Medicare Advantage, with the share ranging from 32% in Mercer County (Celina) to 69% in Stark County (Canton).
In 2024, more than a third (37%) of Medicare beneficiaries live in a county where at least 60 percent of all Medicare beneficiaries in that county are enrolled in Medicare Advantage plans (618 counties). That is substantially more than in 2010 when just 3 percent of the Medicare population lived in a county where 60 percent or more of Medicare beneficiaries were enrolled in a Medicare Advantage plan (83 counties). Many counties with high Medicare Advantage penetration are centered around relatively large, urban areas, such as Monroe County, NY (82%), which includes Rochester, and Allegheny County, PA (74%), which includes Pittsburgh. In contrast, 8 percent of Medicare beneficiaries live in a county where less than one third of all Medicare beneficiaries in that county are enrolled in Medicare Advantage plans (849 counties). Counties with relatively low enrollment tend to be less populated rural areas. However, others, such Montgomery County, MD (27%) and Suffolk, NY (31%), which includes much of Long Island, are in more populous areas. (This county-level analysis excludes Medicare Advantage enrollment in Connecticut. See methods for more details.)
Variation in the share of eligible Medicare beneficiaries who are enrolled in a Medicare Advantage plan is explained by a combination of factors, including firm-level strategies to target particular geographic areas, the urbanicity of the county and state, variation in Medicare payment rates, the number and characteristics of people eligible for Medicare, health care use patterns, and the historical Medicare Advantage market penetration.
Medicare Advantage enrollment is highly concentrated among a small number of firms
The average Medicare beneficiary is able to choose from Medicare Advantage plans offered by 8 firms in 2024, one fewer than in 2023 and 2022, and one-third of beneficiaries (33%) can choose among Medicare Advantage plans offered by 10 or more firms.
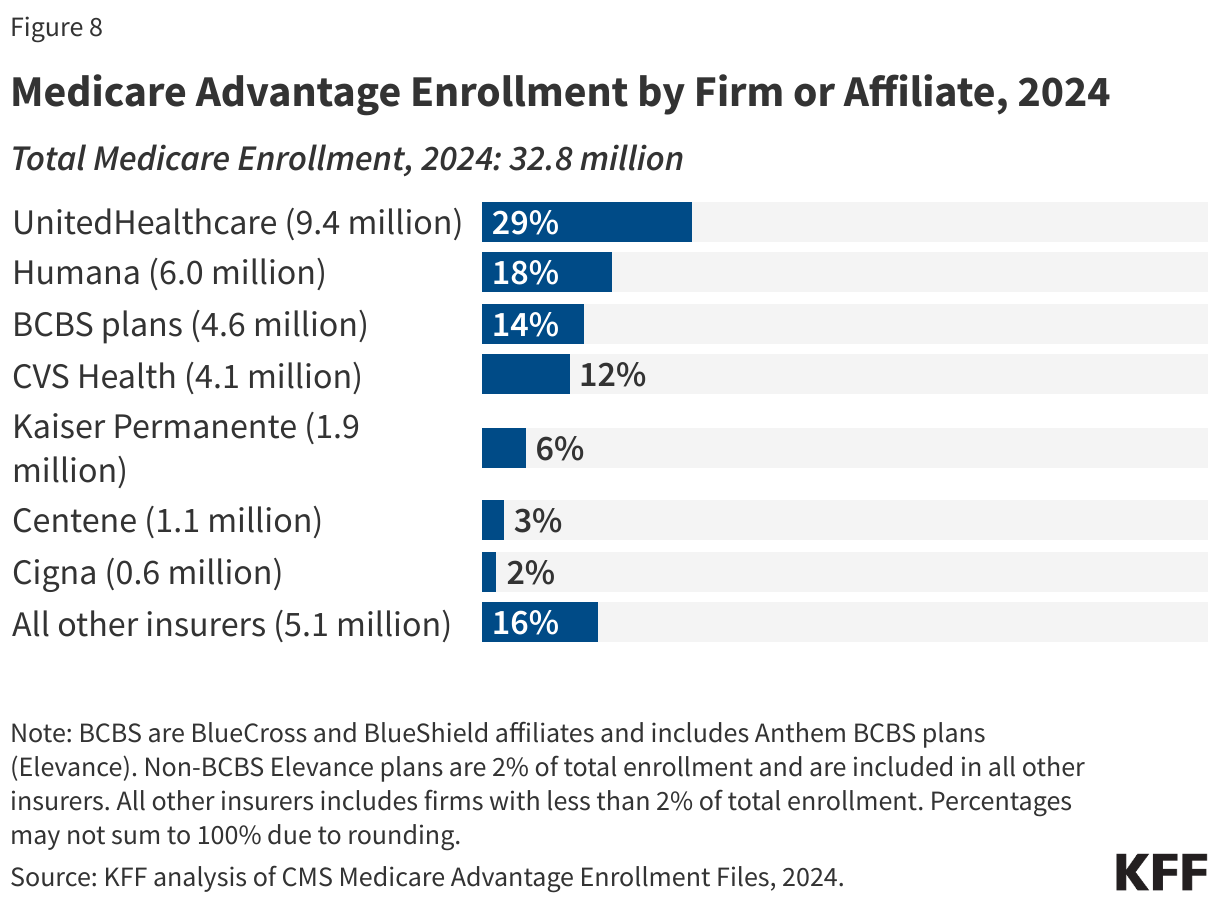
UnitedHealthcare and Humana account for nearly half of all Medicare Advantage enrollees nationwide in 2024.
Despite most beneficiaries having access to plans operated by several different firms, Medicare Advantage enrollment is highly concentrated among a small number of firms. UnitedHealthcare, alone, accounts for 29% of all Medicare Advantage enrollment in 2024, or 9.4 million enrollees. Together, UnitedHealthcare and Humana (18%) account for nearly half (47%) of all Medicare Advantage enrollees nationwide, the same as in 2023. In more than a quarter of counties (29%; or 931 counties), these two firms account for at least 75% of Medicare Advantage enrollment. These counties include East Baton Rouge (Baton Rouge), LA (81%), Clark County (Las Vegas), NV (79%), Travis County (Austin), FL (78%), and El Paso County (Colorado Springs), CO (76%). (Again, this county-level analysis does not include Connecticut.)
BCBS affiliates (including Anthem BCBS plans) account for 14% of enrollment, and four firms (CVS Health, Kaiser Permanente, Centene, and Cigna) account for another 23% of enrollment in 2024.
UnitedHealthcare and Humana have consistently accounted for a relatively large share of Medicare Advantage enrollment.
UnitedHealthcare has had the largest share of Medicare Advantage enrollment and largest growth in enrollment since 2010, increasing from 20 percent of all Medicare Advantage enrollment in 2010 to 29 percent in 2024. Humana has also had a high share of Medicare Advantage enrollment, though its share of enrollment has grown more slowly, from 16 percent in 2010 to 18 percent in 2024. BCBS plans share of enrollment has been more constant over time but has declined moderately since 2014.
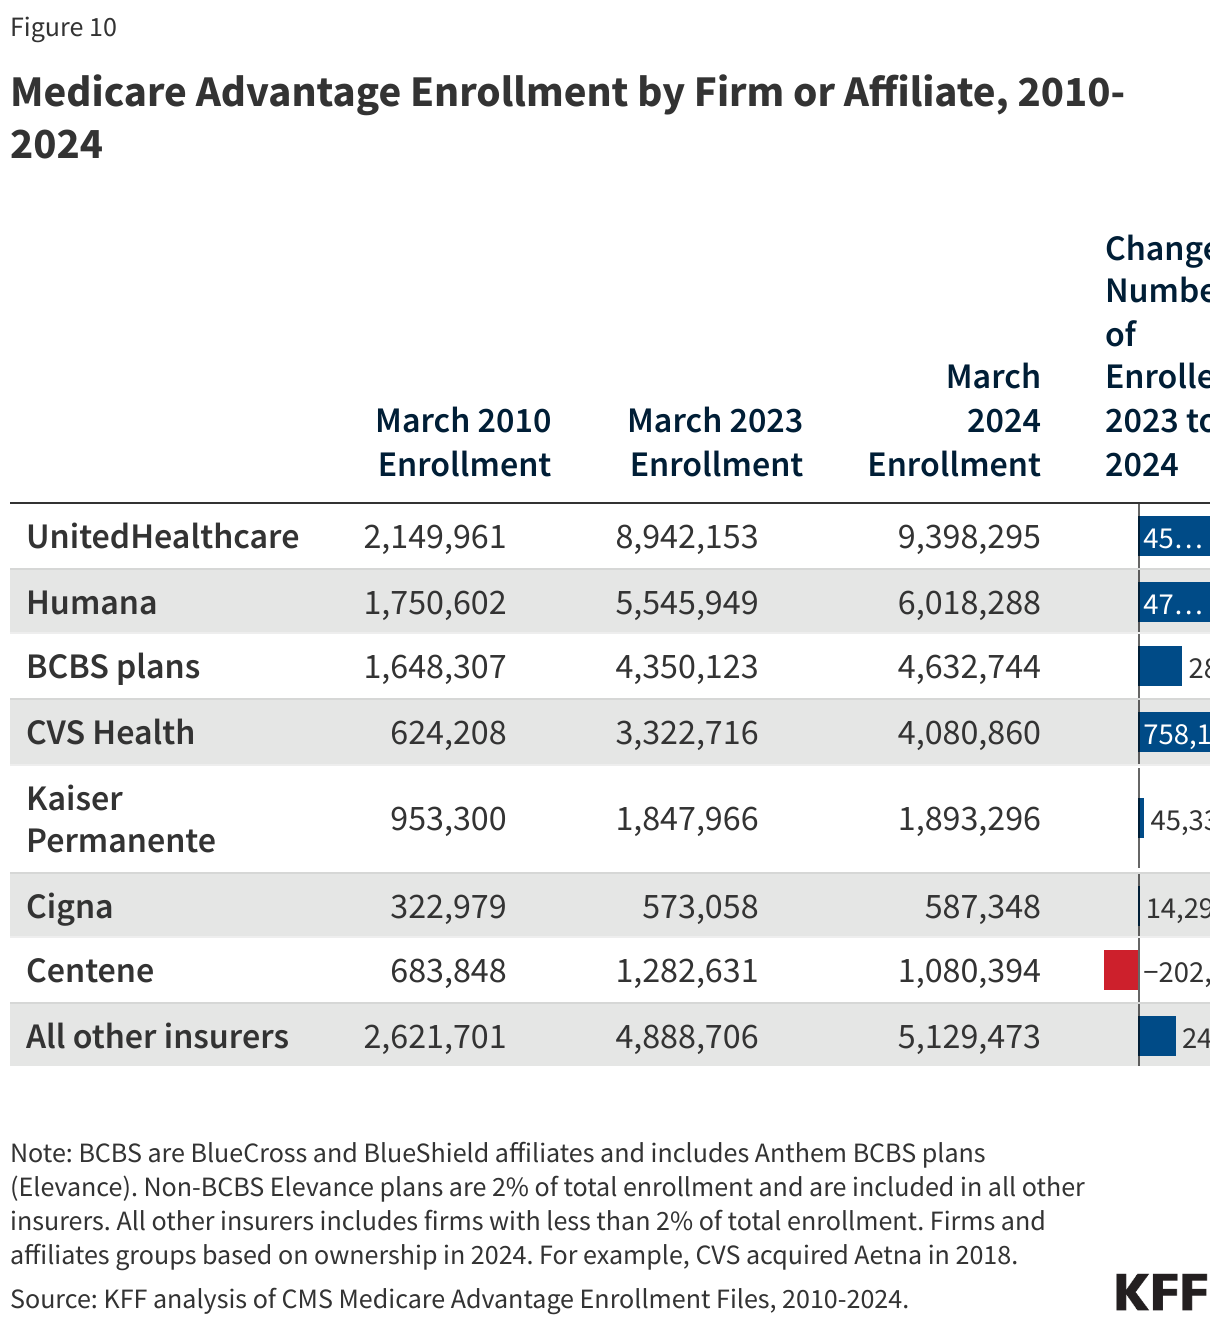
CVS Health, which purchased Aetna in 2018, has seen its share of enrollment double from 6 percent in 2010 to 12 percent in 2024. Kaiser Permanente now accounts for 6 percent of total enrollment, a moderate decline as a share of total Medicare Advantage enrollment since 2010 (9%), mainly due to the growth of enrollment in plans offered by other insurers and only a modest increase in enrollment growth for Kaiser Permanente over that time. However, for those insurers that have seen declines in their overall share of enrollment, the actual number of enrollees for each insurer is larger than it was in 2010.
By absolute numbers, CVS Health had the largest growth in plan year enrollment, increasing by 758,000 beneficiaries between March 2023 and March 2024. Humana had the second largest growth in plan year enrollment, with an increase of about 472,000 beneficiaries between March 2023 and March 2024. UnitedHealthcare plans had the third highest growth in plan year enrollment, increasing by 456,000 beneficiaries – the first time in 8 years it did not have the largest plan growth among all firms. BCBS plans had the fourth largest growth in plan enrollment with an increase of about 283,000, followed by Kaiser Permanente, increasing by about 45,000 beneficiaries between March 2023 and March 2024. However, Centene had fewer enrollees, with enrollment declining by about 202,000 between March 2023 and March 2024.
Meredith Freed, Jeannie Fuglesten Biniek, and Tricia Neuman are with KFF. Anthony Damico is an independent consultant.
Methods |
| This analysis uses data from the Centers for Medicare & Medicaid Services (CMS) Medicare Advantage Enrollment, Benefit and Landscape files for the respective year. KFF uses the Medicare Enrollment Dashboard for enrollment data for March 2023 and 2024, and the CMS Chronic Conditions Data Warehouse Master Beneficiary Summary File (MBSF) for March for earlier years. Trend analysis begins in 2007 because that was the earliest year of data that was based on March enrollment. Enrollment data is only provided for plan-county combinations that have at least 11 beneficiaries; thus, this analysis excludes approximately 400,000 individuals who reside in a county where county-wide plan enrollment does not meet this threshold. Connecticut is excluded from the analysis of Medicare Advantage penetration at the county level due to a change in FIPS codes that are in the Medicare Enrollment Dashboard data but are not yet reflected in the Medicare Advantage enrollment data.
KFF calculates the share of eligible Medicare beneficiaries enrolled in Medicare Advantage, meaning they must have both Part A and B coverage. The share of enrollees in Medicare Advantage would be somewhat smaller if based on the total Medicare population that includes 5.9 million beneficiaries with Part A only or Part B only (in 2024) who are not generally eligible to enroll in a Medicare Advantage plan. In previous years, KFF calculated the share of Medicare beneficiaries enrolled in Medicare Advantage by including Medicare beneficiaries with either Part A and/or B coverage. We modified our approach in 2022 to estimate the share enrolled among beneficiaries eligible for Medicare Advantage who have both Medicare Part A and Medicare B. In the past, the number of beneficiaries enrolled in Medicare Advantage was smaller and therefore the difference between the share enrolled with Part A and/or B vs Part A and B was also smaller. For example, in 2010, 24% of all Medicare enrollees were enrolled in Medicare Advantage versus 25% with just Parts A and B. However, these shares have diverged over time: in 2024, 49% of all Medicare beneficiaries were enrolled in Medicare Advantage versus 54% with just Parts A and B. These changes are reflected in all data displayed trending back to 2007. Additionally, in previous years, KFF had used the term Medicare Advantage to refer to Medicare Advantage plans as well as other types of private plans, including cost plans, PACE plans, and HCPPs. However, cost plans, PACE plans, and HCPPs are now excluded from this analysis in addition to MMPs. In this analysis, KFF excludes these other plans as some may have different enrollment requirements than Medicare Advantage plans (e.g., may be available to beneficiaries with only Part B coverage) and in some cases, may be paid differently than Medicare Advantage plans. These exclusions are reflected in all data displayed trending back to 2007. Medicare projections for 2025-2033 are from the June Congressional Budget Office (CBO) Medicare Baseline for 2024. Using the CBO baseline, Medicare enrollment is based on individuals who are enrolled in Part B, which is designed to include only individuals who are eligible for Medicare Advantage and exclude those who only have Part A only (~5 million people in 2025) and cannot enroll in Medicare Advantage. However, it may include some individuals who have Part B only and also are not eligible for Medicare Advantage. Enrollment counts in publications by firms operating in the Medicare Advantage market, such as company financial statements, might differ from KFF estimates due to inclusion or exclusion of certain plan types, such as SNPs or employer group health plans. |