How Much Is Enough? Out-of-Pocket Spending Among Medicare Beneficiaries: A Chartbook
Section 1: Out-of-Pocket Spending By Medicare Beneficiaries, 2010
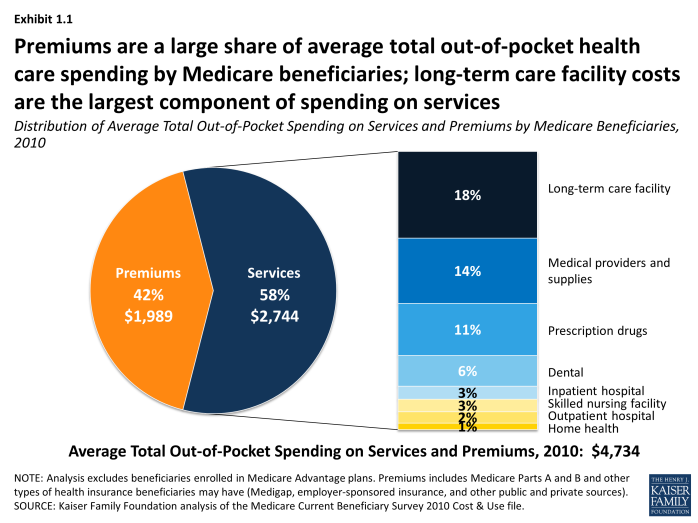
In 2010, Medicare beneficiaries spent $4,734 out of pocket, on average, including premiums for Medicare and other types of supplemental insurance and medical and long-term care services. Premiums are a large share of average total out-of-pocket health care spending for all Medicare beneficiaries, accounting for 42 percent of spending. Of the 58 percent of average total out-of-pocket spending on services, long-term facility costs are the largest component (18%), followed by medical providers/supplies (14%) and prescription drugs (11%) (Exhibit 1.1).
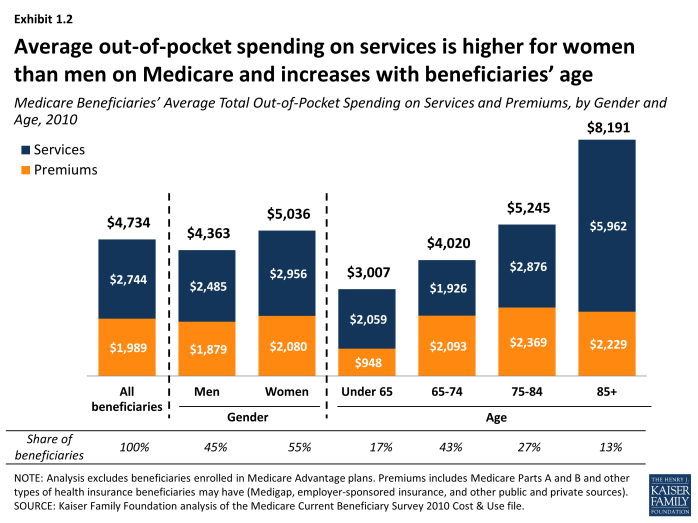
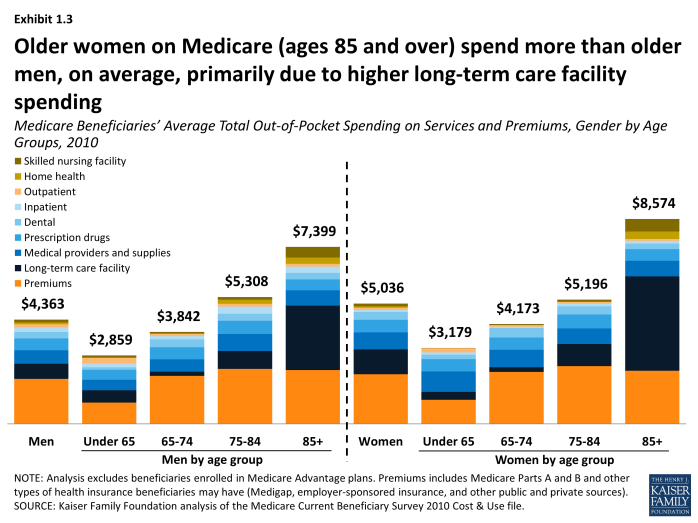
Out-of-pocket spending rises with age among beneficiaries ages 65 and older and is higher for women than men, especially among those ages 85 and older; these differences are driven primarily by variation in average spending on medical and long-term care services, rather than in premium spending. Total out-of-pocket spending on services and premiums was particularly high among beneficiaries ages 85 and older who spent, on average, twice the amount spent by beneficiaries ages 65 to 74 in 2010 ($8,191 vs. $4,020). In 2010, average total out-of-pocket spending was higher for women than men ($5,036 vs. $4,363, respectively, in 2010), and this difference grew somewhat wider with age. Women ages 85 and over spent an average of $8,574 while men ages 85 and over spent an average of $7,399—a difference of nearly $1,200. This difference is primarily attributable to higher long-term care facility costs among older women (Exhibit 1.2) and (Exhibit 1.3).
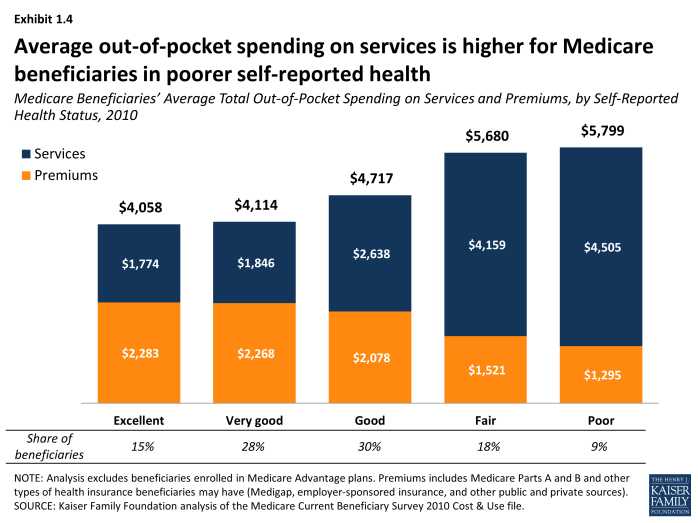
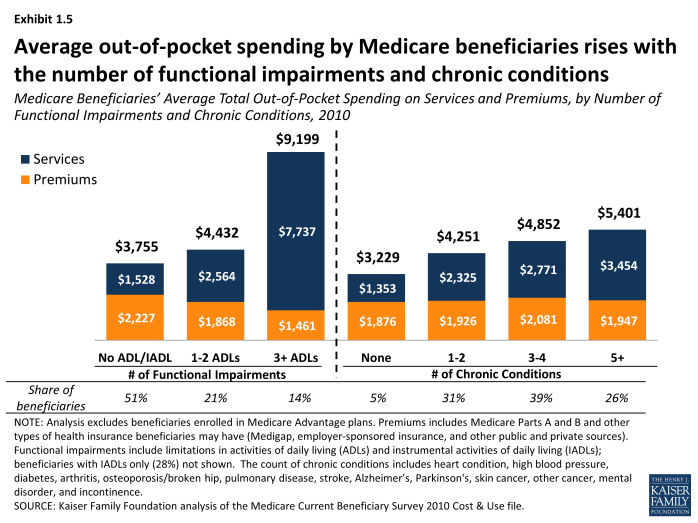
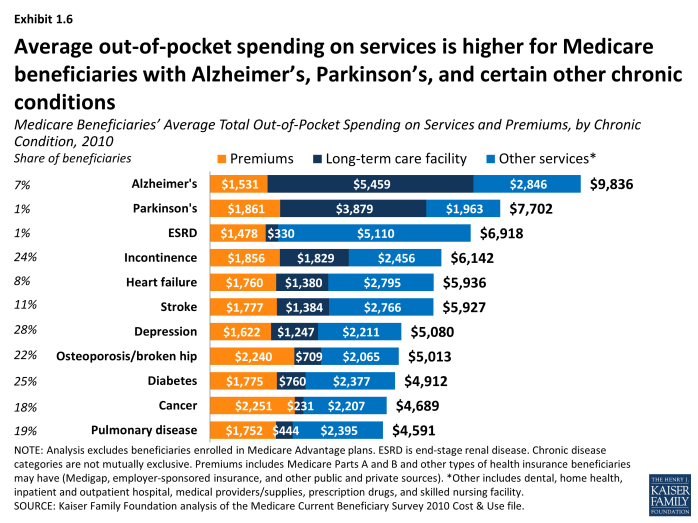
Beneficiaries’ health status and chronic conditions also are significant drivers of out-of-pocket spending, primarily due to large differences in spending on health and long-term care services. Not surprisingly, those beneficiaries with poorer self-reported health status spend more than those who rate themselves in better health. In 2010, beneficiaries in poor health spent around $1,700 more out of pocket in total than those in excellent or very good health, on average (Exhibit 1.4). Those in poor health spent less on premiums than those in excellent health ($1,295 vs. $2,283, on average) but significantly more on medical and long-term care services ($4,505 vs. $1,774). Average total out-of-pocket spending also rises with the number of functional impairments and chronic conditions beneficiaries have, and is especially high among those with three or more limitations in activities of daily living (Exhibit 1.5). Beneficiaries with Alzheimer’s disease, Parkinson’s disease, and end-stage renal disease (ESRD) incurred significantly higher out-of-pocket spending than beneficiaries with certain other conditions (averaging $9,836, $7,702 and $6,918, respectively, in total, including $8,305, $5,841, and $5,439 on services alone), but their higher costs were driven by using more and different types of services (Exhibit 1.6). For example, for those with Alzheimer’s, long-term care facility costs accounted for a majority of their out-of-pocket costs in 2010, while those with ESRD faced higher out-of-pocket costs for medical services. Among chronic conditions, Alzheimer’s disease is one of the most costly in terms of out-of-pocket spending, primarily due to long-term care facility expenses.
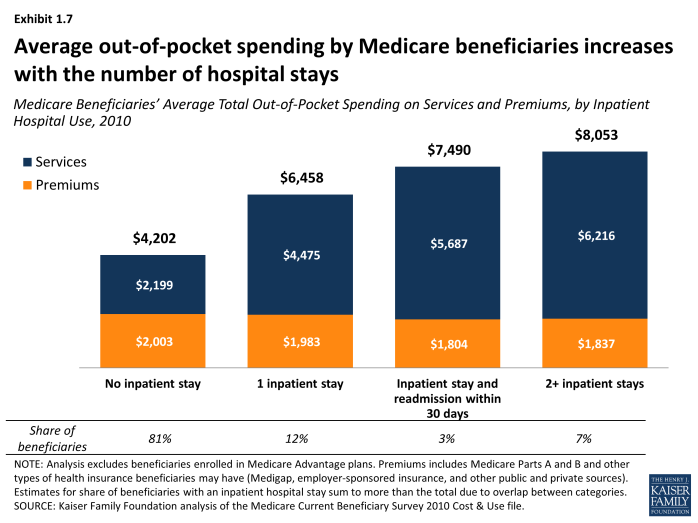
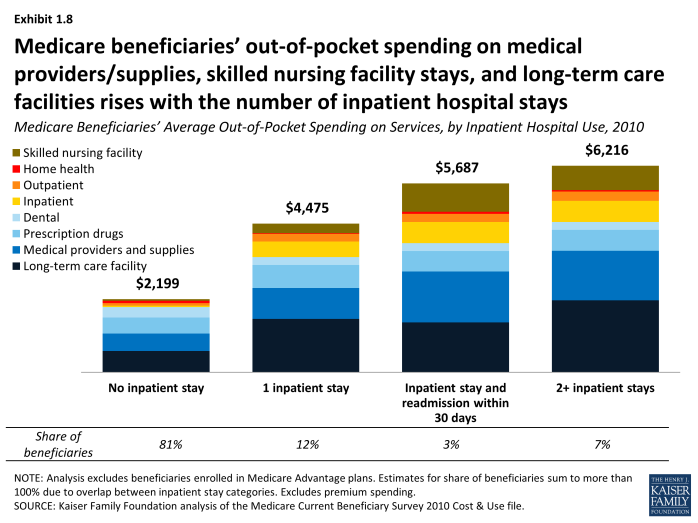
The types of medical services beneficiaries use leads to large differences in average total out-of-pocket spending; in particular, being hospitalized and using post-acute skilled nursing facility services. Being hospitalized leads to higher total out-of-pocket spending, on average, compared to those without an inpatient hospital stay (Exhibit 1.7). In 2010, roughly one in five Medicare beneficiaries experienced an inpatient hospital stay; those with one inpatient stay had average total out-of-pocket spending more than 50 percent higher than those without a hospital stay ($6,458 vs. $4,202) and their spending on services was twice as high, on average ($4,475 vs. $2,199). Those with two or more inpatient stays spent nearly twice as much in total as those without a hospital stay, on average ($8,053 vs. $4,202) and their average spending on services was nearly three times as much ($6,216 vs. $2,199). Patients with a hospital readmission within 30 days in 2010 spent on average roughly $1,200 more on services than those with only one inpatient stay ($5,687 vs. $4,475, respectively), including higher spending for medical providers/supplies, inpatient services, and skilled nursing facility services (Exhibit 1.8).
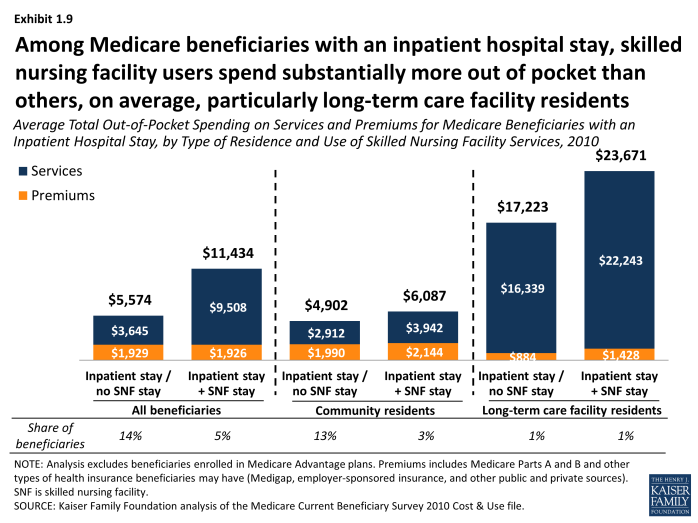
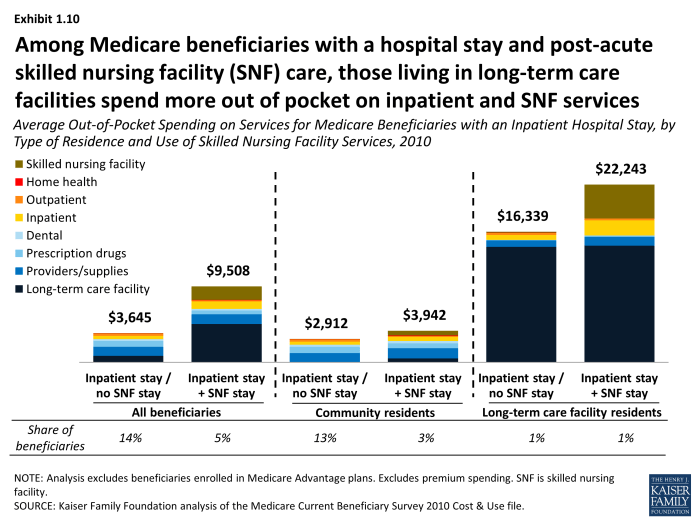
Among Medicare beneficiaries with an inpatient hospital stay, skilled nursing facility users spend substantially more out of pocket than others, on average, particularly long-term care facility residents. Among beneficiaries who were hospitalized in 2010, those who received post-acute care in a SNF had significantly higher total out-of-pocket spending than those who were discharged without SNF care ($11,434 vs. $5,574, respectively, on average); their spending on medical and long-term care services was 2.5 times greater ($9,508 vs. $3,645); these average amounts were even larger for long-term care facility residents with an inpatient stay and post-acute SNF care (Exhibit 1.9). For this group, out-of-pocket spending on SNF services among those with a hospital stay and SNF care averaged $4,258 in 2010, seven times greater than average SNF spending among community residents ($595) (Exhibit 1.10). These beneficiaries also spent nearly twice as many days in a SNF than community residents in 2010 (49 days vs. 28 days, on average).1
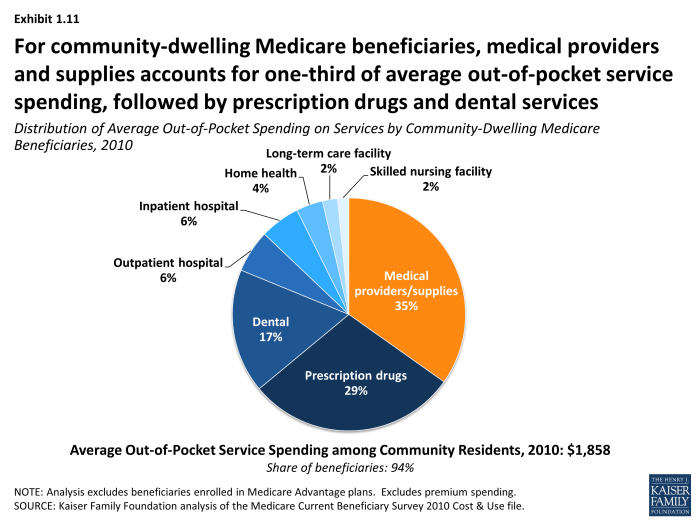
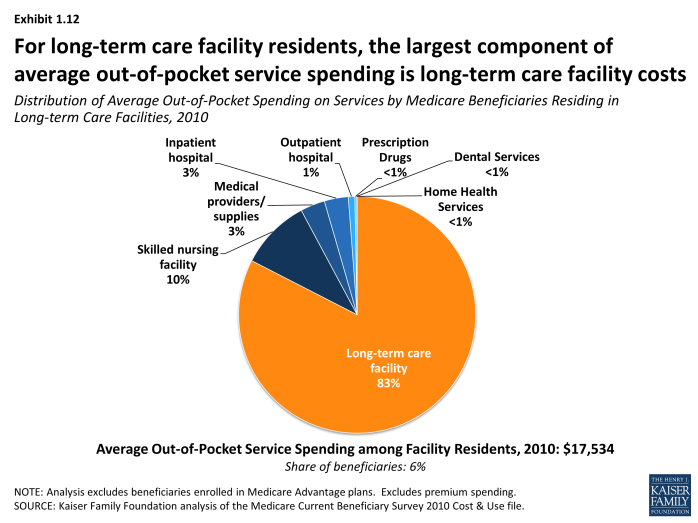
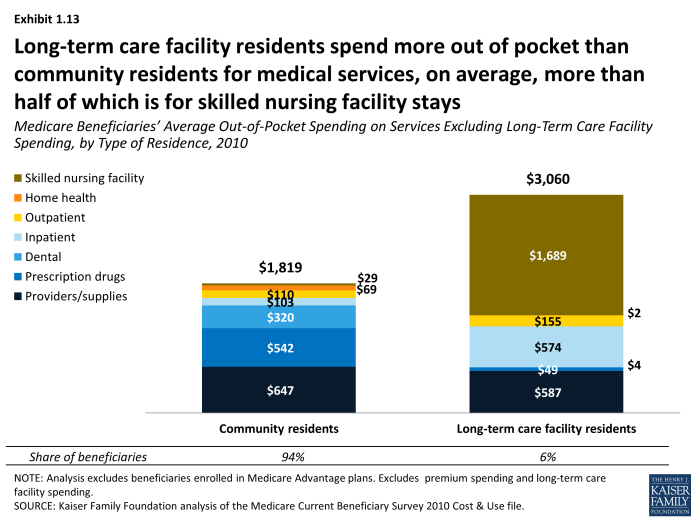
Whether beneficiaries live in the community or in long-term care facilities produces significant differences in the average amount spent out of pocket on services and where those dollars go. Community residents spent $1,858 out of pocket in 2010 on medical and long-term care services, on average, while long-term care facility residents spent $17,534 on average. For the majority of Medicare beneficiaries who lived in the community in 2010, medical providers/supplies accounted for just over one-third of average out-of-pocket service spending ($647), followed by prescription drugs ($542) and dental services ($320) (Exhibit 1.11). For the six percent of beneficiaries who were long-term care facility residents in 2010, the largest component of average out-of-pocket service spending was long-term care facility costs ($14,474)—which is not surprising, given the high cost of long-term care (Exhibit 1.12). This average amount is substantially lower than the total annual cost of nursing home care because the average includes significantly lower annual long-term care facility spending by beneficiaries who had either full-year or part-year Medicaid coverage for their long-term care costs. In addition to their higher spending on long-term care facilities, facility residents spent more out of pocket than community residents for medical services in 2010, on average ($3,060 vs. $1,819), more than half of which ($1,689) was for skilled nursing facility stays (Exhibit 1.13).
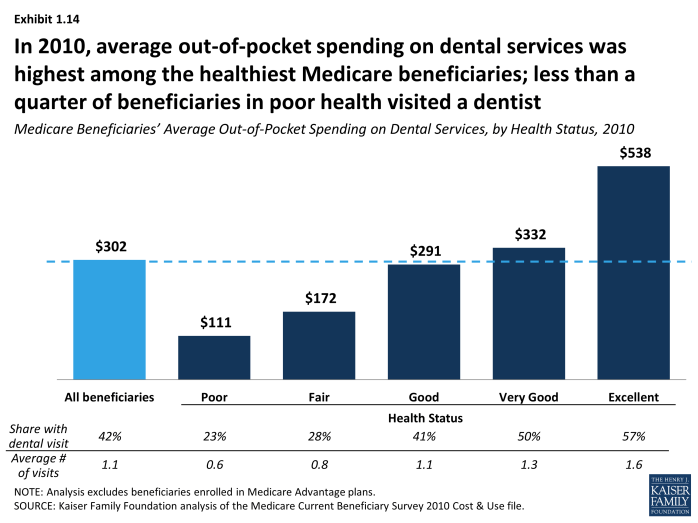
The use of dental services and out-of-pocket spending on dental care varies among beneficiaries. Although dental services are not covered by Medicare, people continue to need and use dental care as they age. However, less than a quarter of those in poor health reported visiting a dentist in 2010, and they spent far less on dental care than beneficiaries in better health (Exhibit 1.14). Average out-of-pocket spending on dental services was highest among beneficiaries in excellent health—a majority of whom (57%) visited a dentist in 2010—and five times higher than those in poor health ($538 vs. $111, respectively).
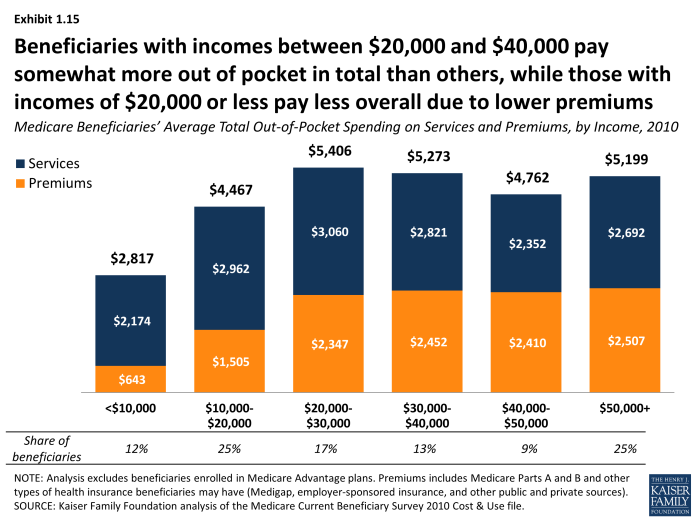
While premiums for Medicare and supplemental insurance are a significant component of total out-of-pocket spending by Medicare beneficiaries, our analysis shows less variation across different groups of beneficiaries in out-of-pocket costs for premiums than for services; premiums do vary, however, by age, income, and supplemental coverage. Among beneficiaries ages 65 and older, there is little variation in premiums by age group, while beneficiaries under age 65 with disabilities pay lower premiums than older beneficiaries (Exhibit 1.2). This is most likely related to the fact that a relatively large share of Medicare beneficiaries under age 65 is also covered by Medicaid and thus not liable for premiums. Average premiums are generally similar for beneficiaries with incomes above $20,000, but lower for beneficiaries with lower incomes, most likely due to three factors: 1) lower-income beneficiaries with Medicaid typically do not pay premiums; 2) lower-income beneficiaries with full Medicaid benefits have little need for supplemental coverage; and 3) lower-income beneficiaries without Medicaid may not be able to afford supplemental insurance (Exhibit 1.15).
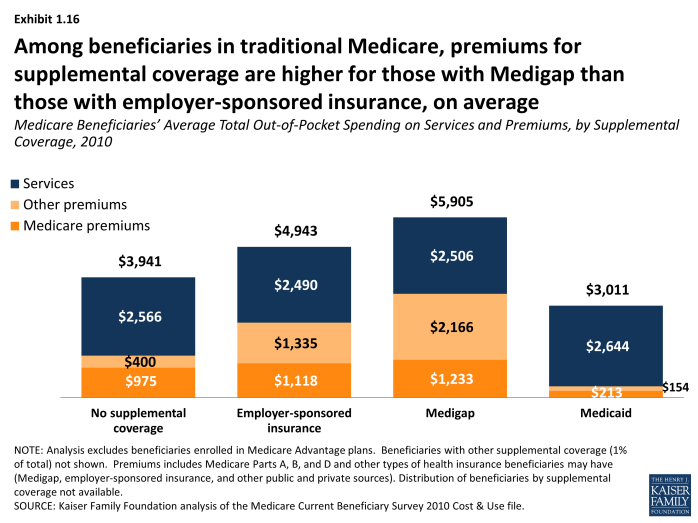
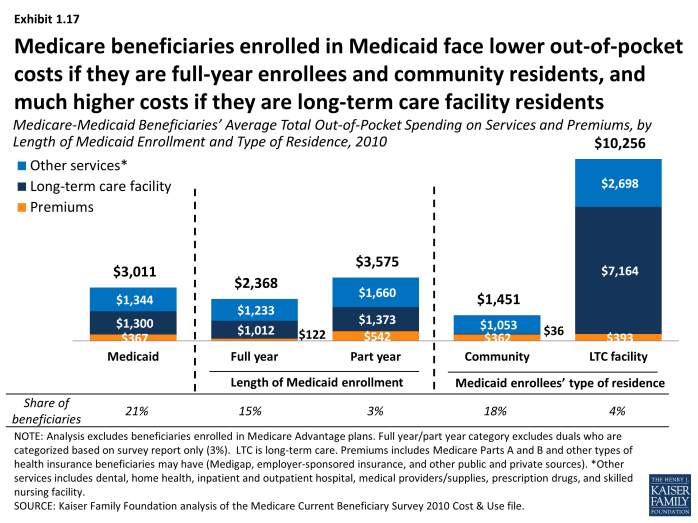
Beneficiaries with Medigap supplemental policies pay higher premiums than those with employer-sponsored retiree health coverage, while those with Medicaid pay significantly lower premiums, on average. In 2010, beneficiaries with Medigap supplemental insurance policies paid more in supplemental insurance premiums than beneficiaries with employer-sponsored retiree health insurance, on average ($2,166 and $1,335, respectively) (Exhibit 1.16). Supplemental insurance premiums accounted for more than one-third of average total out-of-pocket spending by Medigap policyholders. Medicare beneficiaries enrolled in Medicaid face lower out-of-pocket costs if they are full-year enrollees or community residents, and higher costs if they are part-year enrollees or long-term care facility residents (Exhibit 1.17).

