How Well Does the Employment-Based Health Insurance System Work for Low-Income Families?
Part 2
Even when insurance is offered to low-wage workers, its costs to these workers may be substantial, and, for some, a barrier to coverage. In 1996, workers had to contribute an average of $1,615 per year for family coverage, or about 30% of the total premium.5 Thus, a worker who earned $10 an hour in 1996, with annual wages of about $20,000, would have had to spend 8% of earnings to buy family coverage.* A worker who earned just $7 an hour would have had to spend 12% of earnings on health insurance.
* Annual earnings are estimated based on 40 weekly hours worked and 50 weeks of work per year.
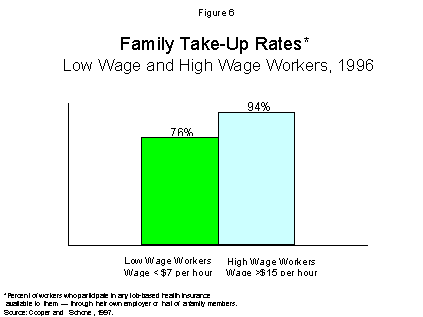
Despite substantial costs, the large majority of low-wage workers take up insurance when it is available to them. High-wage workers, though, are more likely than low-wage workers to participate in employer plans. In 1996, 76% of workers who earned less than $7 an hour participated in employer plans to which they had access (either through their own employer or through a family member’s employer), compared to 94% of workers who earned more than $15 per hour [Figure 6].6

These data do not provide much support for the view that low-income families lack coverage because they are turning down coverage that is available to them. Although high-wage workers are more likely to take up insurance, the limited impact of participation differences for low-wage workers is apparent in the following example. If low-wage workers increased their participation in any job-based plan offered to them from the current rate, 76 percent, to a rate comparable to that of high-wage workers, 94 percent, their coverage rate would only increase from 42 to 51 percent, still far below the rates found among higher wage workers.* In other words, closing the gap in participation would not close the gap in coverage between high-wage and low-wage workers. The primary reason low-income families lack coverage is not failure to participate, it is because they work for employers who do not offer them health benefits.
The Decline in Employer Coverage
The limits to employer coverage, especially for low-wage workers, are widely recognized. The deterioration of that coverage–again, especially for low-wage workers–is a pattern of even greater concern.
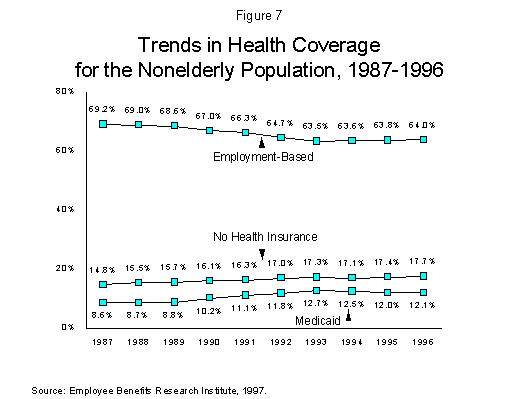
Between 1987 and 1996, the proportion of Americans under age 65 with employer coverage declined from 69.2% to 64%. Although partially offset by an increase in the proportion of the nonelderly population with Medicaid coverage (mostly for children), the proportion of the population without insurance grew from 14.8% in 1987 to 17.7% in 1996 [Figure 7].
* The coverage rate is equal to the participation rate multiplied by the proportion of workers with access to health coverage. Assuming access remains unchanged and 55% of low wage workers have access to employment-related health benefits, the coverage rate would increase from 42% (76% * 55%) to 51% (94% * 55%) if participation rates rose.

These changes in coverage–the drop in employer coverage and the rise in Medicaid– were most pronounced between 1988 and 1993. Since 1993, the deterioration in employer coverage appears to have stabilized, remaining at about 64 percent,7 while the Medicaid coverage rate dropped from 12.7% in 1993 to 12.1% in 1996, and the proportion of uninsured Americans under age 65 continued to rise, despite economic growth and relatively low unemployment.
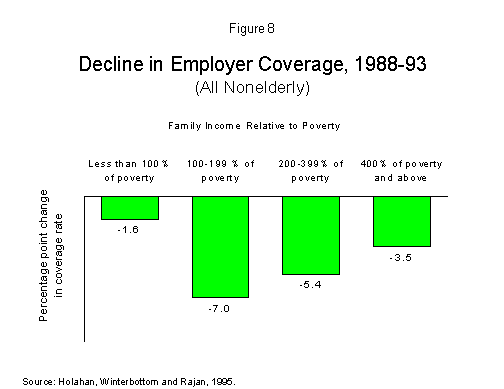
Although the deterioration of employer coverage has affected workers and families across all income levels, the impact has varied with income, with near-poor and modest income families showing the greater losses. From 1988 to 1993, the rate of employer coverage for the near-poor (with incomes between 100-199% of poverty) fell seven percentage points–from 50.9% to 43.9% [Figure 8]. Among individuals in families with incomes between 200 and 399% of poverty, the coverage rate fell from about 77.8 to 72.3 percent, and for those in families with incomes above 400% of poverty, the proportion with employer coverage dropped from 86.0% to 82.4 percent.8

Table 1 illustrates the same phenomenon over a longer period of time, focusing on workers differentiated by a variety of characteristics. Looking first at wages, coverage rates declined across all wage levels, but the drop in coverage was concentrated among low-wage workers. Coverage for workers in the bottom fifth of the wage distribution dropped 13 percentage points from 40% in 1979 to 27% in 1993. That drop is much larger than for workers in the top fifth of the wage distribution. The top wage earners were unaffected by the coverage declines in the early 1980s, but saw a small decline (of 3 percentage points) between 1988 and 1993. The fall in coverage by education level follows a similar pattern: large declines among less educated workers, with some decline in coverage in the most educated groups. Coverage rates fell more among men than women, and although employer coverage declined similarly among blacks and whites, Hispanics suffered a much larger drop.
Table 1
Change in Private Sector Employer-Provided Health Insurance Coverage, Wage and Salary Workers, 1979-1993
Health Insurance Coverage Percentage Point Change
Group*
1979
1988
1993
1979-93
All Workers
71%
69%
64%
-7
Wage (by wage fifth)
Lowest
40
32
27
-13
Second
66
62
59
-7
Middle
79
76
71
-8
Fourth
87
83
80
-7
Top
90
90
87
-3
Gender
Men
76
74
68
-8
Women
61
62
58
-3
Race
White
72
71
66
-6
Black
66
64
61
-5
Hispanic
63
56
47
-16
Education
Less Than High School
63
55
45
-18
High School Graduate
70
67
62
-8
Some College
72
68
63
-9
College
81
82
75
-6
More Than College
80
85
79
-1 *Private wage and salary workers ages 18 to 64, with at least 20 weekly hours and 26 weeks of work. Source: Mishel, Bernstein and Schmitt, 1997.
Policy Brief Part 1 Part 2 Part 3
Library Index
