2012 Employer Health Benefits Survey
Section 3: Employee Coverage, Eligibility, and Participation
Employers are the principal source of health insurance in the United States, providing health benefits for about 149 million nonelderly people in America.1 Most workers are offered health coverage at work, and the majority of workers who are offered coverage take it. Workers may not be covered by their own employer for several reasons: their employer may not offer coverage, they may be ineligible for benefits offered by their firm, they may choose to elect coverage through their spouse’s employer, or they may refuse coverage from their firm.
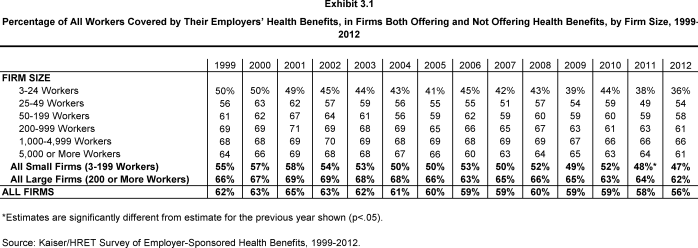
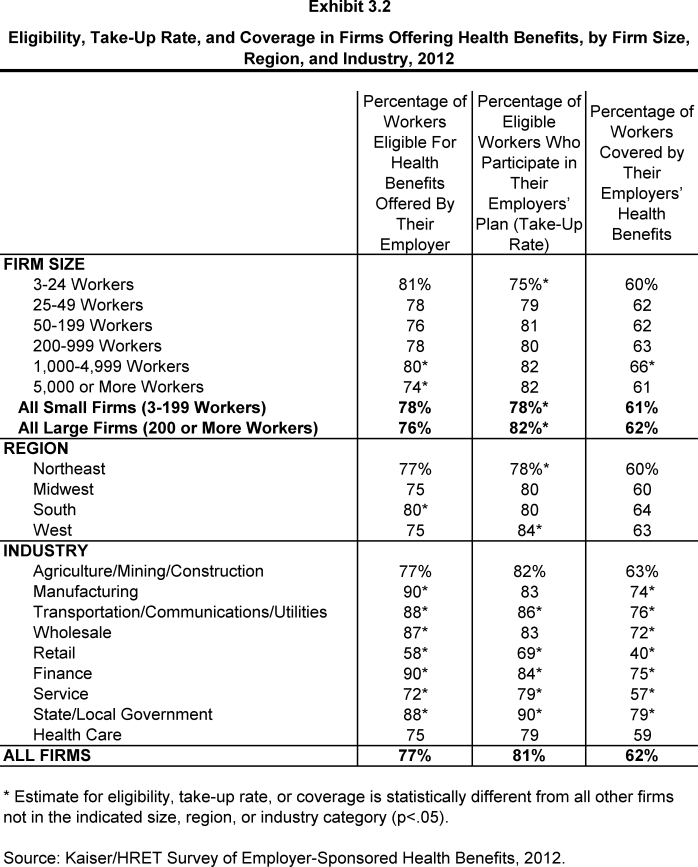
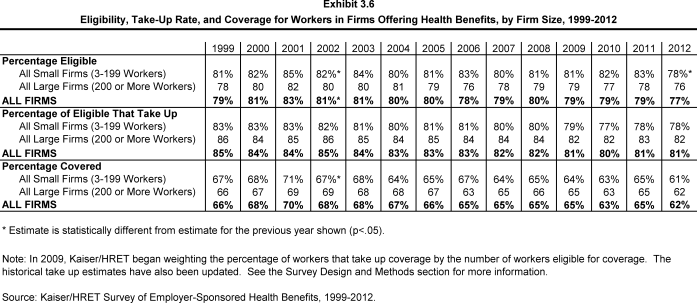
- Among firms offering health benefits, 62% percent of workers are covered by health benefits through their own employer (Exhibit 3.2). When considering both firms that offer health benefits and those that don’t, 56% of workers are covered under an employer plan (Exhibit 3.1). This coverage rate has remained stable over time.
- Not all employees are eligible for the health benefits offered by their firm, and not all eligible employees take up the offer of coverage. The share of workers covered in a firm is a product of both the percentage of workers who are eligible for the firm’s health insurance and the percentage who choose to “take up” (i.e., elect to participate in) the benefit.
- Seventy-seven percent of workers in firms offering health benefits are eligible for the coverage offered by their employer (Exhibit 3.2).
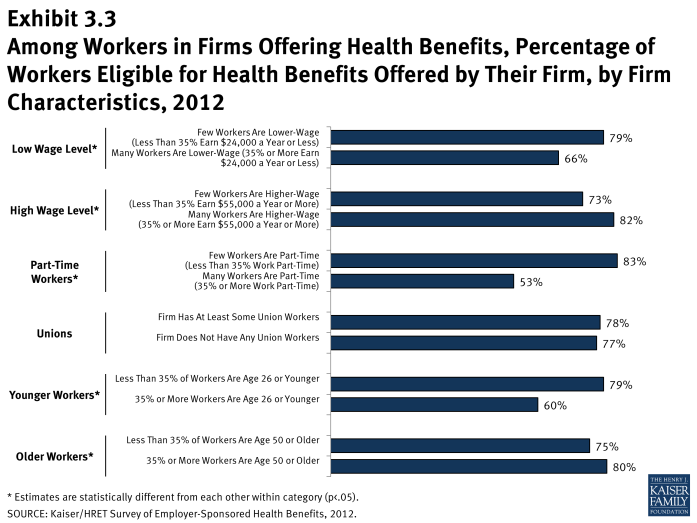
- Eligibility varies considerably by wage level. Employees in firms with a lower proportion of lower-wage workers (less than 35% of workers earn $24,000 or less annually) are more likely to be eligible for health benefits than employees in firms with a higher proportion of lower-wage workers (where 35% or more of workers earn $24,000 or less annually) (79% vs. 66%). We observe a similar pattern among firms with many higher-wage workers (35% or more of workers earn $55,000 or more annually) (82% vs. 73%) (Exhibit 3.3).
- Eligibility also varies by the age of the workforce. Those in firms with fewer younger workers (less than 35% of workers are age 26 or younger) are more likely to be eligible for health benefits than are workers in firms with many younger workers (35% or more of workers are age 26 or younger), at 79% versus 60% (Exhibit 3.3).
- Employees who are offered health benefits generally elect to take up the coverage. In 2012, 81% of eligible workers take up coverage when it is offered to them, the same as the 81% reported last year (Exhibit 3.2). 2
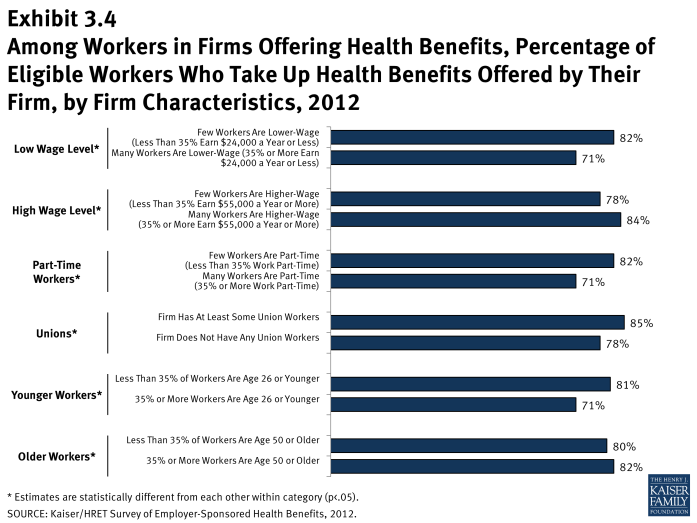
- The likelihood of a worker accepting a firm’s offer of coverage also varies by firm wage level. Eligible employees in firms with a lower proportion of lower-wage workers are more likely to take up coverage (82%) than eligible employees in firms with a higher proportion of lower-wage workers (35% or more of workers earn $24,000 or less annually) (71%) (Exhibit 3.4). Similar patterns are seen in firms with a higher proportion of younger workers, with workers in these firms being less likely to take up coverage than those in firms with a smaller share of younger workers (71% vs. 81%).
- The rate of coverage varies by certain firm characteristics.
- There is significant variation by industry in the coverage rate among workers in firms offering health benefits. For example, only 40% of workers in retail firms are covered by health benefits offered by their firm, compared to 79% of workers in state and local government, and 76% of workers in the transportation/communications/utilities industry category (Exhibit 3.2).
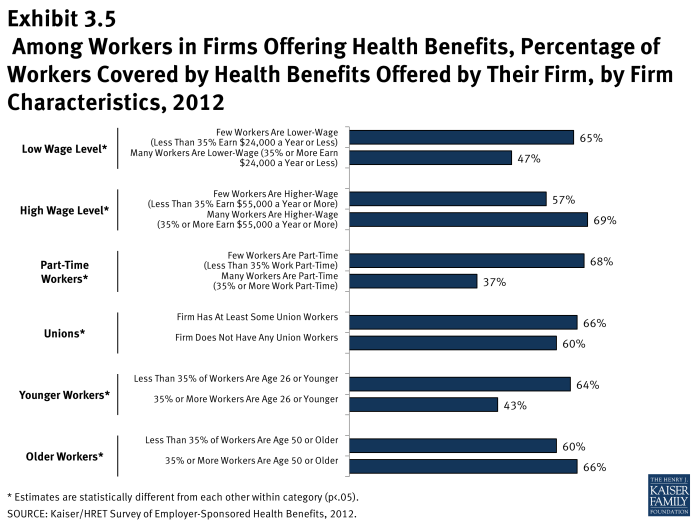
- Among workers in firms offering health benefits, those in firms with relatively few part-time workers (less than 35% of workers are part-time) are much more likely to be covered by their own firm than workers in firms with a greater percentage (35% or more) of part-time workers (68% vs. 37%) (Exhibit 3.5).
- Among workers in firms offering health benefits, those in firms with fewer lower-wage workers (less than 35% of workers earn $24,000 or less annually) are more likely to be covered by their own firm than workers in firms with many lower-wage workers (35% or more of workers earn $24,000 or less annually) (65% vs. 47%) (Exhibit 3.5). A comparable pattern exists in firms with a larger proportion of higher wage workers (35% or more earn $55,000 or more annually).
- Among workers in firms offering health benefits, those in firms with fewer younger workers (less than 35% of workers are age 26 or younger) are more likely to be covered by their own firm than workers in firms with many younger workers (35% or more of workers are age 26 or younger) (64% vs. 43%) (Exhibit 3.5).
Average Waiting Periods
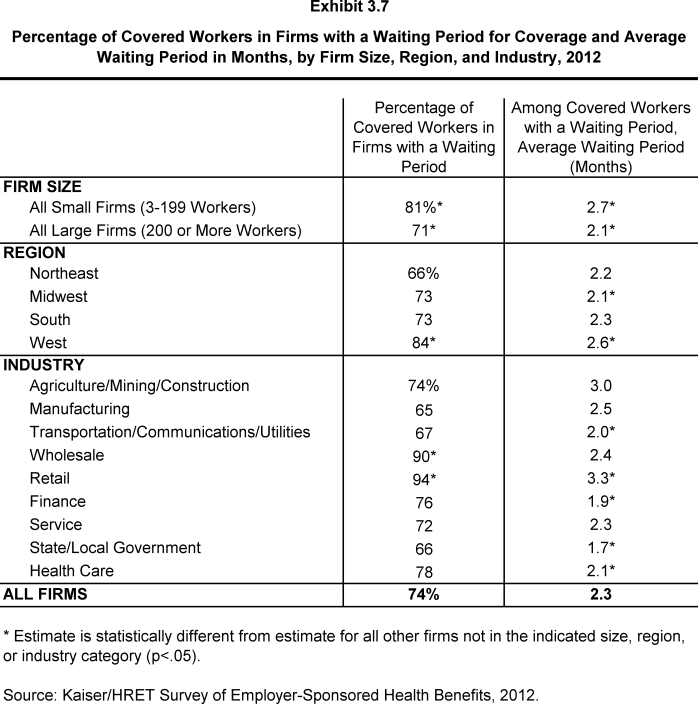
- Seventy-four percent of covered workers face a waiting period before coverage is available. Covered workers in small firms (3-199 workers) are more likely than those in large firms to have a waiting period, at 81% versus 71% (Exhibit 3.7). Workers in the West also are more likely to face a wait for coverage (84%).
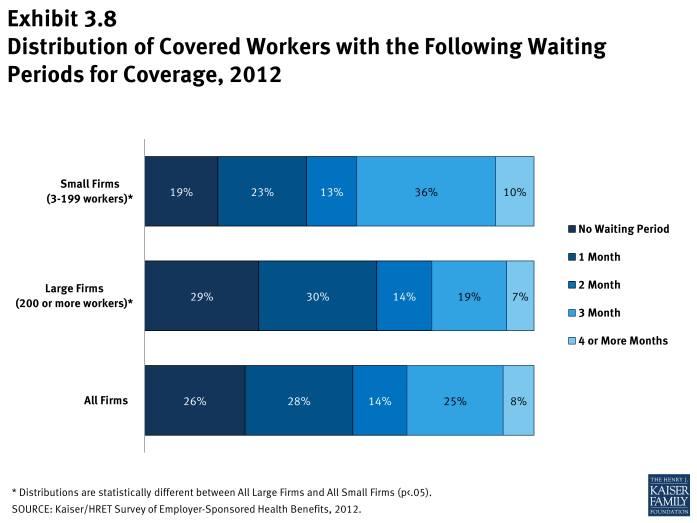
- The average waiting period among covered workers who face a waiting period is 2.3 months (Exhibit 3.7). While 33% of covered workers face a waiting period of 3 months or more, only 8% face a waiting period of 4 months or more. Workers in small firms (3-199 workers) are more likely to have longer waiting periods than workers in larger firms (Exhibit 3.8).
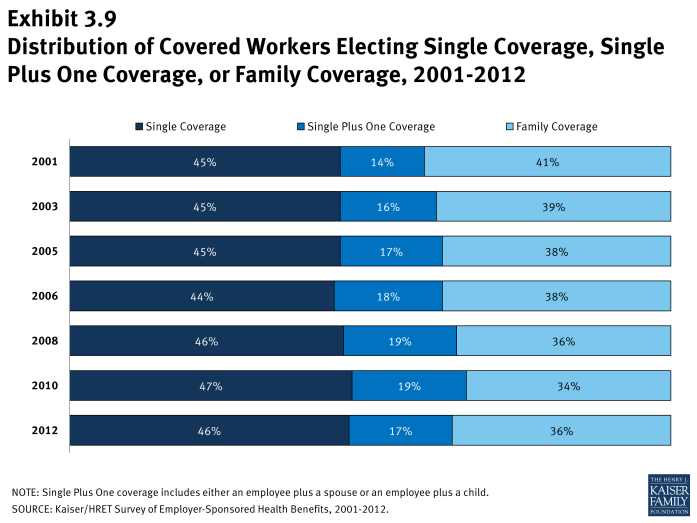
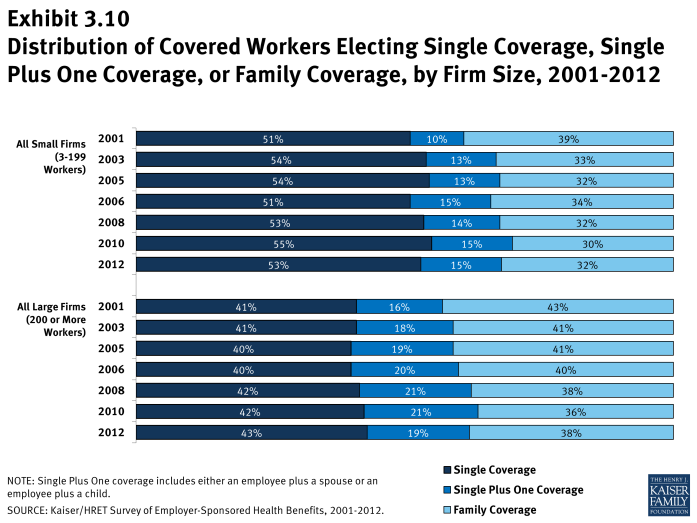
- The distribution of covered workers electing single coverage, single plus one coverage, or family coverage is 46%, 17%, and 36% respectively in 2012 (Exhibit 3.9). The distribution of enrollment in single coverage, single plus one and family coverage has remained stable over time.
x
Exhibit 3.2
x
Exhibit 3.1
x
Exhibit 3.3
x
Exhibit 3.4
x
Exhibit 3.5
x
Exhibit 3.7
x
Exhibit 3.8
x

