Survey of Health Insurance Marketplace Assister Programs
Section 1: Characteristics of Assister Programs
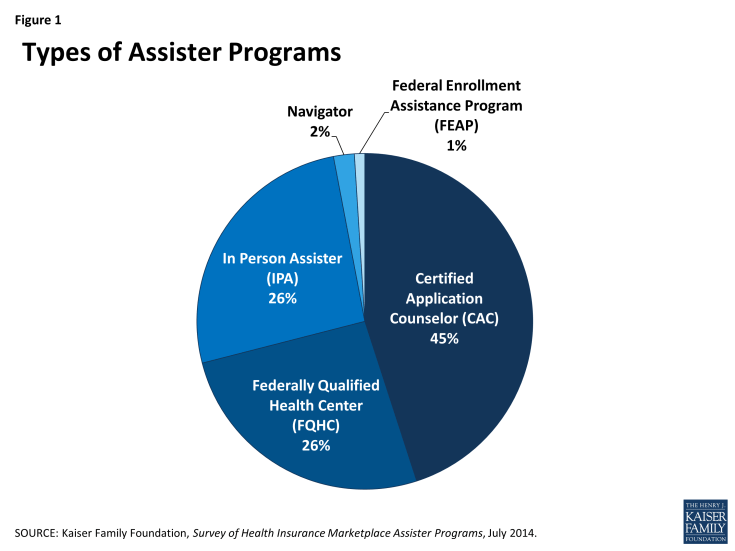
In all, more than 4,400 Marketplace Assister Programs were established to help consumers during the first Open Enrollment. This total is based on Program data provided by all state and federal Marketplaces. Certified Application Counselor Programs (CACs) account for the largest number of Assister Programs, representing 45% of the total Programs and operating in most states. These Programs are likely most numerous because they faced fewer requirements to get started, needing only to complete the online training and register with the Marketplace. Programs sponsored by Federally Qualified Health Centers (FQHCs) accounted for 26% of total Assister Programs and operated in every Marketplace. Another 26% of Assister Programs are In Person Assisters (IPAs) operating in states with State-based Marketplaces (SBMs) and Consumer Assistance Federal Partnership Marketplaces (FPMs). While Navigators, which operated in states with a Federally-facilitated Marketplace (FFM), represented only 2% of the total number of Assister Programs, they were more likely to subcontract with other organizations. As a result, the total number of organizations that operated as Navigators is likely somewhat greater than this figure suggests (Figure 1).
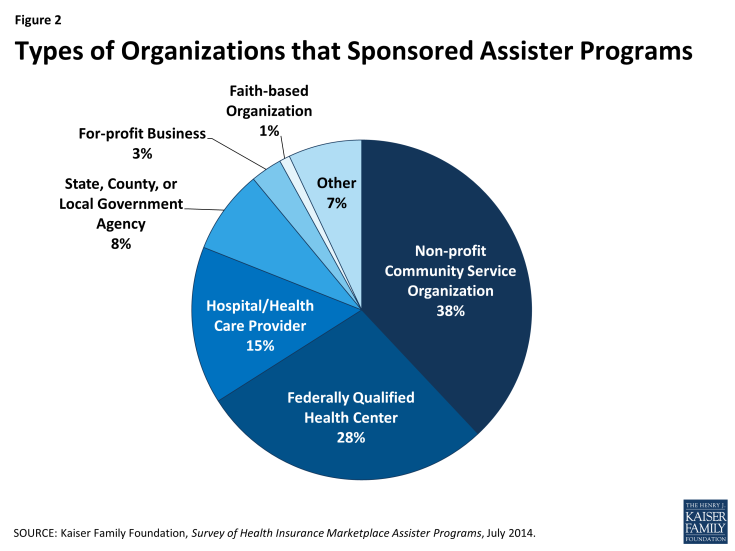
Health care providers, including FQHCs and hospitals, along with non-profit community-based organizations sponsored the majority of Assister Programs. Although a variety of organizations decided to develop and implement Assister Programs, FQHCs and other health care providers sponsored 43% of Assister Programs nationwide. Provider organizations have long played a role in connecting consumers to coverage so it is perhaps not surprising that they signed up in large numbers. Nonprofit community service organizations sponsored another 38% of Assister Programs nationwide. State and local agencies make up about 8% of Assister Programs, though these mostly operate in states that elected to expand Medicaid eligibility. Churches, legal aid organizations, colleges and universities, and trade associations also sponsored Assister Programs (Figure 2).
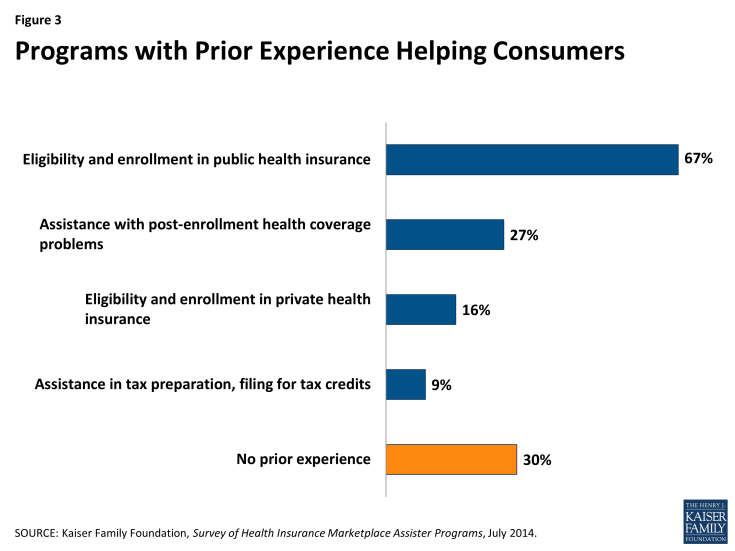
Most Assister Programs (70%) report having some prior experience providing consumer assistance. Two-thirds of Programs had experience helping people enroll in Medicaid and CHIP prior to Open Enrollment. Just over one-quarter of Programs had helped consumers with post-enrollment health coverage problems, such as denied claims. Only 16% of Programs had previously helped consumers enroll in private health insurance. Nine percent reported experience helping with tax preparation or filing for tax subsidies (Figure 3).
Most Assister Programs served specific geographic areas or targeted population groups. Just 13% of Assister Programs operated in a statewide service area, the rest served more targeted regions or populations.1 Programs that contracted directly with Marketplaces (Navigators, IPAs and FEAPs) were somewhat more likely to report statewide service areas. This is likely because Marketplaces sometimes favored applicants who would operate statewide. Most Assister Programs also operated independently, but one-in-five worked as part of a formal network or coalition of sub-contracting organizations. Navigators, IPAs and FEAPs were more likely to operate as part of a formal coalition (Table 1).
Assister Programs varied in size and in the number of consumers they helped. The majority of Programs have a small staff; 71% have five or fewer full-time-equivalent (FTE) staff (paid or volunteer), while 5% of Programs have more than 20 FTE staff. CACs were more likely than other Assister Programs to have small staffs, with 81% reporting fewer than five FTEs. CACs were also more likely to rely primarily on volunteers (18% vs. 2% for FQHCs and 9% for other Programs).
Almost half of all Assister Programs report providing eligibility and enrollment assistance to no more than 500 people during Open Enrollment, with 20% of Programs helping 100 or fewer people. The CAC Programs were most likely to report helping smaller numbers of people; only 19% of CAC Programs said they helped more than 1,000 people. By contrast, 67% of FQHC Programs and 36% of other Marketplace Assister Programs reported helping more than 1,000 people during Open Enrollment.
| Table 1. Assister Programs by Size, Service Area, and Numbers of People Helped | ||||
| Program Characteristics | All Assister Programs | Program Type | ||
| CAC | FQHC | IPA, Navigator, and FEAP | ||
| Independent vs. part of a coalition | ||||
| Independent | 72% | 76%c | 73%c | 64% |
| Part of a coalition | 20% | 16% | 17% | 28%ab |
| Don’t know/No answer | 8% | 8% | 9% | 8% |
| Statewide vs. specific geographic service area | ||||
| Statewide | 13% | 12% | 8% | 18%ab |
| Specific area within state | 85% | 86% | 88% | 81% |
| Other | 2% | 2% | 4% | 2% |
| Paid staff vs. volunteer | ||||
| Most/all volunteers | 11% | 18%bc | 2% | 9%b |
| Most/all paid staff | 89% | 82% | 98% | 91% |
| Number of full-time-equivalent staff and volunteers | ||||
| 5 or fewer | 71% | 81%bc | 63% | 64% |
| 6-10 | 16% | 9% | 25%ac | 18%a |
| 11-20 | 7% | 6% | 6% | 9% |
| 21-50 | 3% | 1% | 3% | 6%a |
| More than 50 | 2% | <1% | 1% | 4%b |
| Don’t know/No answer | 1% | 1% | 1% | <1% |
| Number of consumers helped during Open Enrollment | ||||
| 100 or fewer | 20% | 33%bc | 1% | 17%b |
| 101-500 | 29% | 35%b | 16% | 31%b |
| 501-1,000 | 14% | 14% | 15% | 14% |
| 1,001-2,500 | 17% | 10% | 33%ac | 13% |
| 2,501-5,000 | 10% | 6% | 17%ac | 9% |
| More than 5,000 | 10% | 3% | 17%a | 14%a |
| No answer | 1% | <1% | 1% | <1% |
| a indicates a statistically significant difference from CAC, p<.05 b indicates a statistically significant difference from FQHC, p<.05 c indicates a statistically significant difference from IPA, Navigator, FEAP, p<.05 NOTE: Numbers may not sum to 100% due to rounding. |
||||
Assister Program budgets were mostly modest. Thirty percent of all Assister Programs report having an annual budget of $50,000 or less.2 Almost as many Programs (26%) had annual budgets between $50,000 and $200,000. Only 5% of Programs reported annual budgets larger than $500,000. CACs tended to have the smallest Program budgets compared to other types of Assister Programs3 (Table 2).
CACs were most likely to rely on re-programmed resources from their sponsoring organization or on other private sector support. FQHCs relied more heavily on grants from HRSA, while Marketplace Assister Programs (IPAs, Navigators and FEAPs) relied more heavily on direct payments from the Marketplaces.
| Table 2. Assister Program Budgets and Sources of Funding, FY 2014 | ||||
| All Assister Programs | by Program Type | |||
| CAC | FQHC | IPA, Navigator, FEAP | ||
| FY 2014 Program budget | ||||
| Up to $50,000 | 30% | 46%bc | 9% | 25%b |
| $50,001 – $200,000 | 26% | 16% | 45%ac | 25%a |
| $200,001 – $500,000 | 9% | 3% | 13%a | 15%a |
| $500,001 – $1,000,000 | 4% | 1% | 2% | 11%ab |
| More than $1,000,000 | 1% | 0% | 1% | 3% |
| Don’t know/No answer | 29% | 33% | 29% | 22% |
| a indicates statistically different from CAC, p<.05 b indicates statistically different from FQHC, p<.05 c indicates statistically different from IPA, Navigator, FEAP, p<.05 Numbers may not sum to 100% due to rounding. |
||||
| Programs receiving most (>50%) of budget from this funding source* | ||||
| Grants or other direct payment from Marketplace | 24% | 20%†b | 7% | 51%ab |
| Grants from HRSA, other federal agency | 30% | 14%c | 81%ac | 4% |
| Grants or payments from other state agencies | 8% | 6% | 4% | 19%ab |
| Grants from private foundations | 6% | 8% | 1% | 4% |
| Grants from other outside private sources | 2% | 5% | 0% | 0% |
| Funds re-programmed from sponsoring organization’s own budget | 22% | 41%bc | 5% | 14%b |
| † Though not required to do so, some SBMs provided funding for CAC Assister Programs. a indicates a statistically significant difference from CAC, p<.05 b indicates a statistically significant difference from FQHC , p<.05 c indicates a statistically significant difference from IPA, Navigator, FEAP, p<.05 *Percentages reflect Programs responding. Numbers do not sum to 100% because not all Programs received most funding from single source. |
||||
Assister Programs engaged in a range of activities during Open Enrollment. Virtually all Assister Programs reported providing eligibility and enrollment help to consumers, helping them apply for private health insurance and subsidies, as well as Medicaid and CHIP coverage when these options were available. Over 80% of Programs also provided outreach and education to individuals and families. These outreach efforts were important to making sure consumers understood what their coverage options were and how to apply for financial assistance.
After eligibility and enrollment assistance and outreach to individuals, the next most-often named activity (named by 77% of Programs) was helping consumers with post-enrollment questions and problems, such as denied claims. More than half of Programs also reported helping people appeal eligibility determinations. Only about one-third of Assister Programs engaged in outreach and enrollment assistance to small businesses (Table 3).
| Table 3: Assistance Activities Conducted by Assister Programs | |
| Activity | % Programs |
| Help individuals apply for premium tax credits and cost sharing subsidies | 91% |
| Help individuals apply for Medicaid/Children’s Health Insurance Program | 88% |
| Help individuals compare private health insurance plan (QHP) options | 83% |
| Outreach and public education to individuals and families | 82% |
| Help individuals with post-enrollment questions and problems (e.g., denied claims) | 77% |
| Help individuals with appeals of eligibility determinations | 59% |
| Help individuals apply for exemptions from the individual responsibility requirement | 50% |
| Help other Assister Program staff resolve questions or problems for their clients | 49% |
| Help individuals apply for other public benefits and services | 47% |
| Outreach and public education to small businesses | 31% |
| Help employees of small businesses enroll in health coverage | 28% |


